| Param | Original file | Final file |
|---|---|---|
| Filename | modeM0/AS1T04_041T01_9000004642_31801cztM0_level2.evt | modeM0/AS1T04_041T01_9000004642_31801cztM0_level2_quad_clean.evt |
| Size (bytes) | 761,198,400 | 109,535,040 |
| Size | 725.9 MB | 104.5 MB |
| Events in quadrant A | 7,245,761 | 683,485 |
| Events in quadrant B | 6,451,261 | 747,173 |
| Events in quadrant C | 4,574,020 | 725,686 |
| Events in quadrant D | 4,355,808 | 719,854 |
| Mode M9 | |||
|---|---|---|---|
| Quadrant | BADHDUFLAG | Total packets | Discarded packets |
| A | 0 | 20 | 0 |
| B | 0 | 21 | 0 |
| C | 0 | 21 | 0 |
| D | 0 | 21 | 0 |
| Mode M0 | |||
|---|---|---|---|
| Quadrant | BADHDUFLAG | Total packets | Discarded packets |
| A | 0 | 25765 | 2 |
| B | 0 | 23517 | 2 |
| C | 0 | 18143 | 2 |
| D | 0 | 17292 | 2 |
| Mode SS | |||
|---|---|---|---|
| Quadrant | BADHDUFLAG | Total packets | Discarded packets |
| A | 0 | 128 | 0 |
| B | 0 | 128 | 0 |
| C | 0 | 128 | 0 |
| D | 0 | 128 | 0 |
| Quadrant | Total seconds | Saturated seconds | Saturation percentage |
|---|---|---|---|
| A | 6314 | 1927 | 30.519481% |
| B | 6314 | 742 | 11.751663% |
| C | 6314 | 570 | 9.027558% |
| D | 6314 | 156 | 2.470700% |
Noise dominated data is calculated using 1-second bins in cleaned event files. If a bin has >2000 counts, and if more than 50% of those come from <1% of pixels, then it is considered to be noise-dominated and hence unusable.
| Quadrant | # 1 sec bins | Bins with >0 counts | Bins with >2000 counts | High rate bins dominated by noise | Noise dominated (total time) | Noise dominated (detector-on time) | Marked lightcurve |
|---|---|---|---|---|---|---|---|
| A | 7609 | 6315 | 1159 | 1159 | 15.23% | 18.35% | 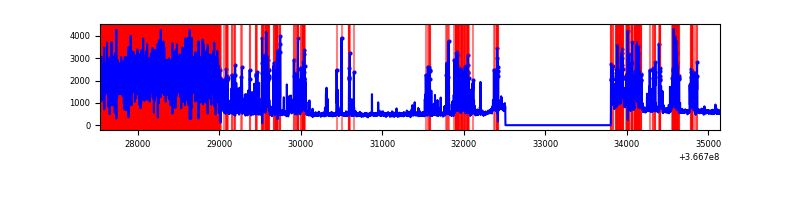 |
| B | 7609 | 6315 | 230 | 230 | 3.02% | 3.64% | 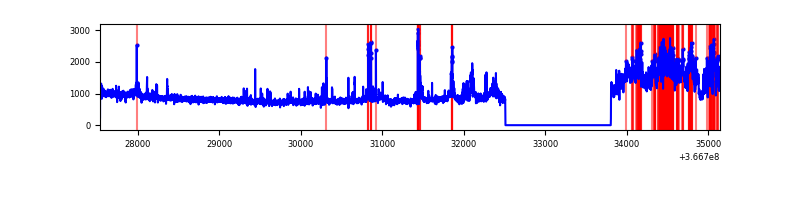 |
| C | 7609 | 6315 | 127 | 127 | 1.67% | 2.01% | 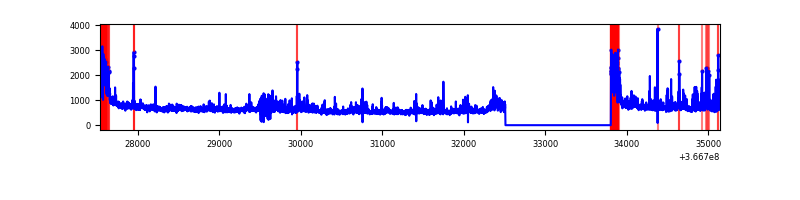 |
| D | 7609 | 6315 | 16 | 16 | 0.21% | 0.25% | 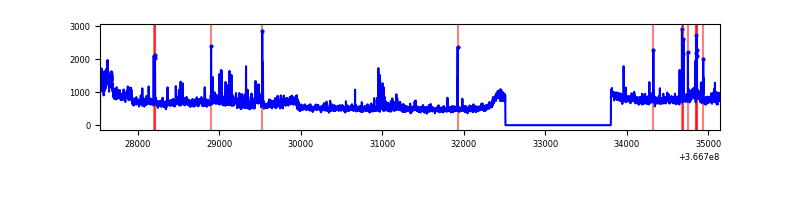 |
Top three noisy pixels from each quadrant. If the there are fewer than three noisy pixels in the level2.evt file, extra rows are filled as -1
| Pixel properties | Quadrant properties | ||||||
|---|---|---|---|---|---|---|---|
| Quadrant | DetID | PixID | Counts | Sigma | Mean | Median | Sigma |
| A | 0 | 13 | 4217497 | 27276.36 | 785 | 774 | 154.6 |
| A | 13 | 254 | 9217 | 54.61 | 785 | 774 | 154.6 |
| A | 3 | 137 | 7067 | 40.71 | 785 | 774 | 154.6 |
| B | 6 | 159 | 1585578 | 9507.89 | 898 | 878 | 166.7 |
| B | 10 | 245 | 1307201 | 7837.68 | 898 | 878 | 166.7 |
| B | 0 | 190 | 22338 | 128.76 | 898 | 878 | 166.7 |
| C | 0 | 10 | 694111 | 3484.96 | 867 | 878 | 198.9 |
| C | 3 | 233 | 228846 | 1146.02 | 867 | 878 | 198.9 |
| C | 14 | 238 | 183853 | 919.84 | 867 | 878 | 198.9 |
| D | 8 | 195 | 637903 | 3000.72 | 912 | 893 | 212.3 |
| D | 12 | 227 | 101448 | 473.68 | 912 | 893 | 212.3 |
| D | 12 | 218 | 63580 | 295.3 | 912 | 893 | 212.3 |
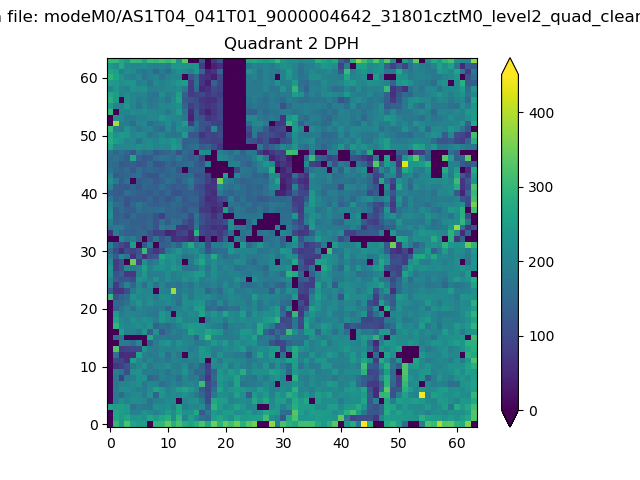
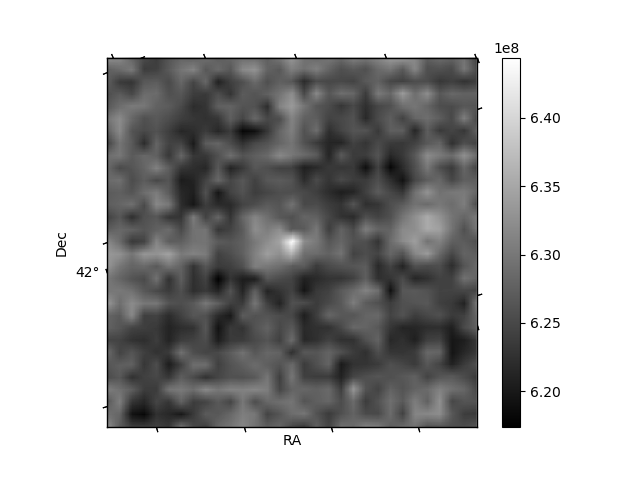
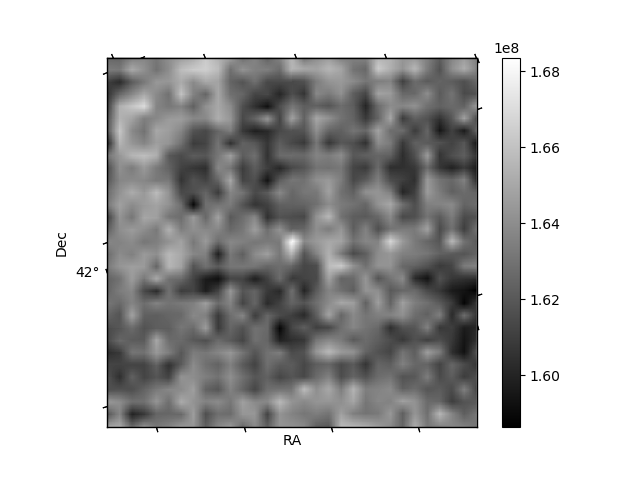
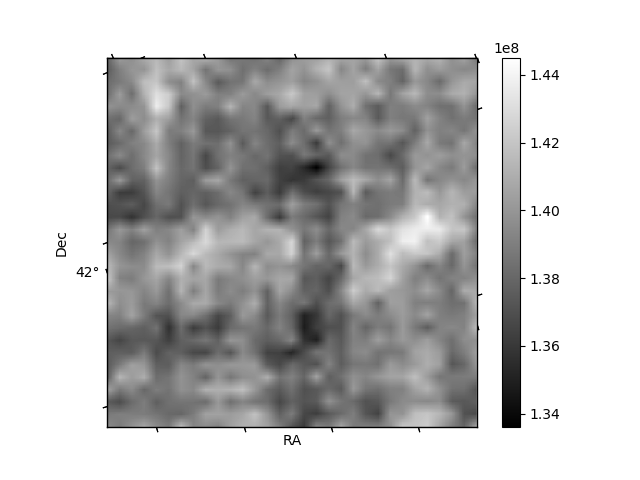
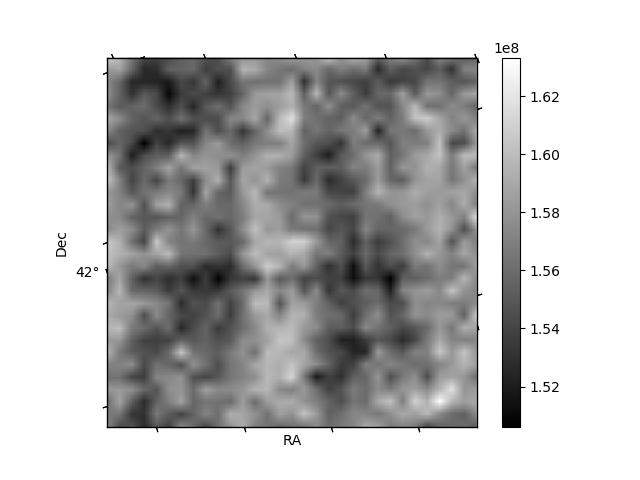
Histogram calculated using DETX and DETY for each event in the final _common_clean file
| Quadrant A | 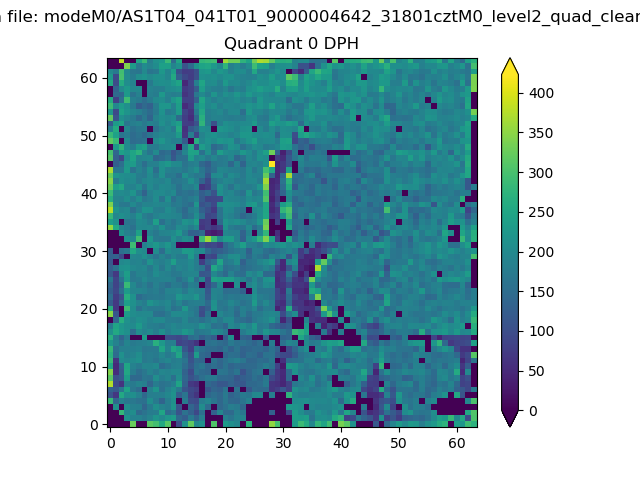 |
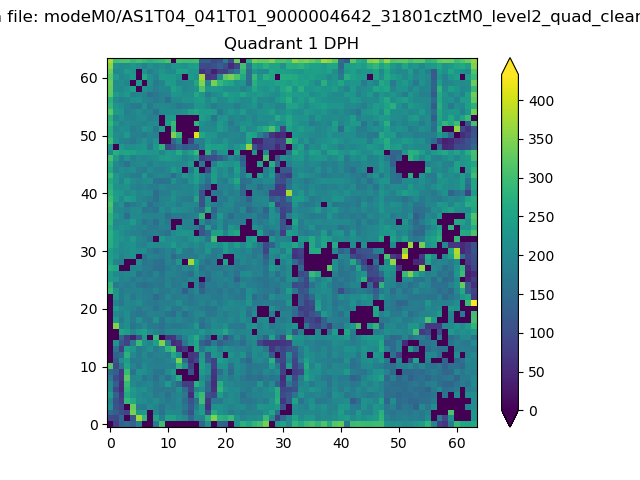 |
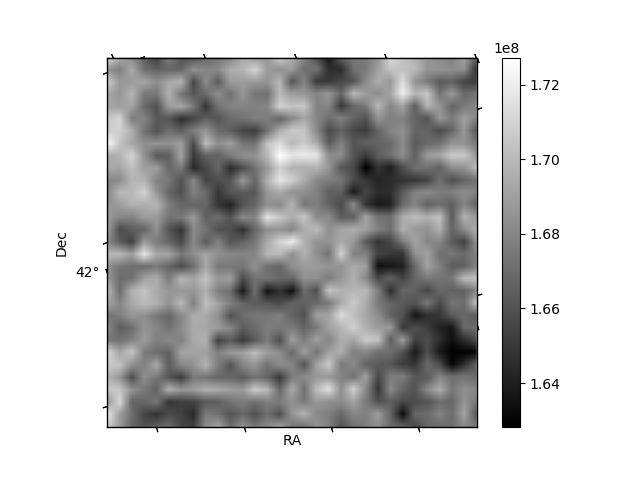
Quadrant B |
|---|---|---|---|
| Quadrant D | 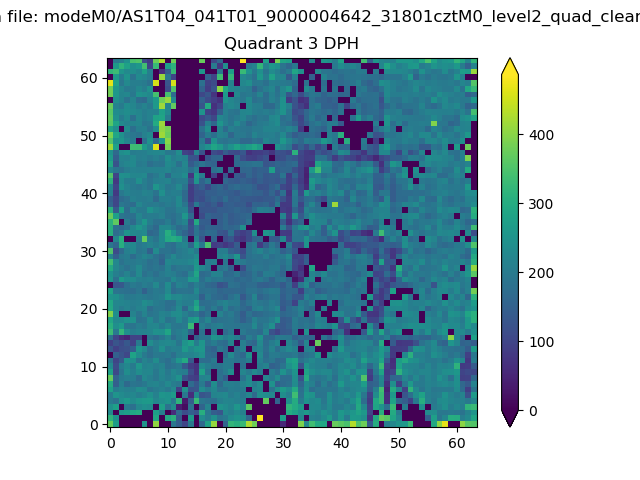 |
 |
Quadrant C |
| Plot type | Count rate plots | Images |
|---|---|---|
| Comparison with Poisson distribution Blue bars denote a histogram of data divided into 1 sec bins. Red curve is a Poisson curve with rate = median count rate of data. |
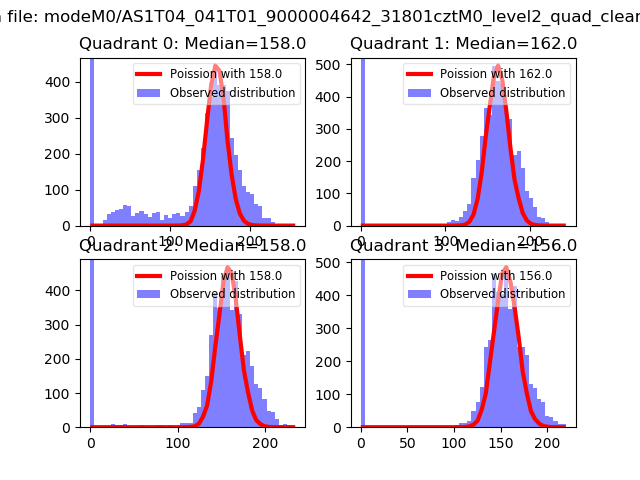 |
 |
| Quadrant-wise count rates Data is divided into 100 sec bins |
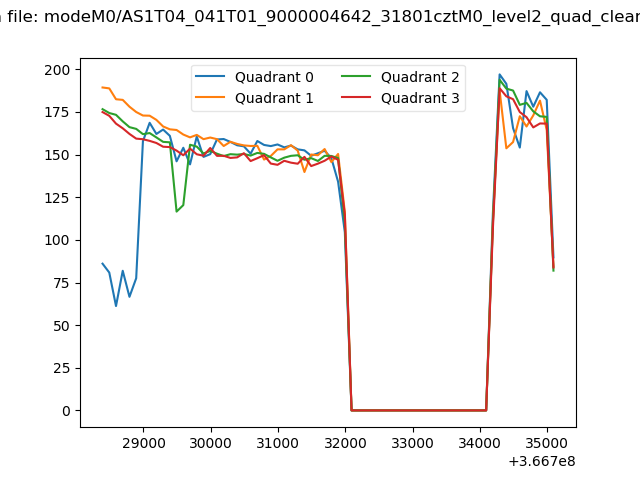 |
|
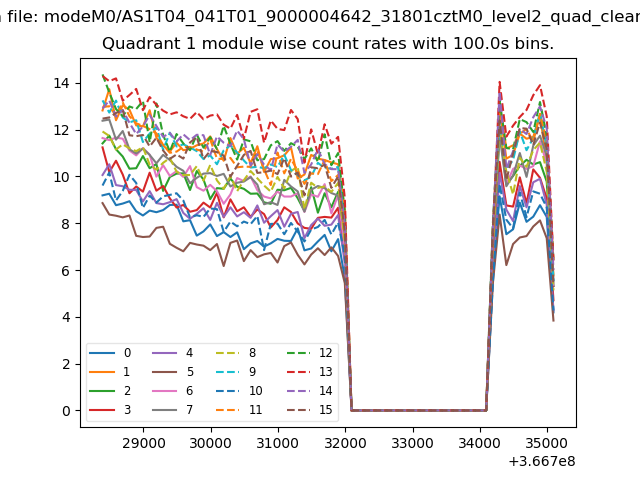
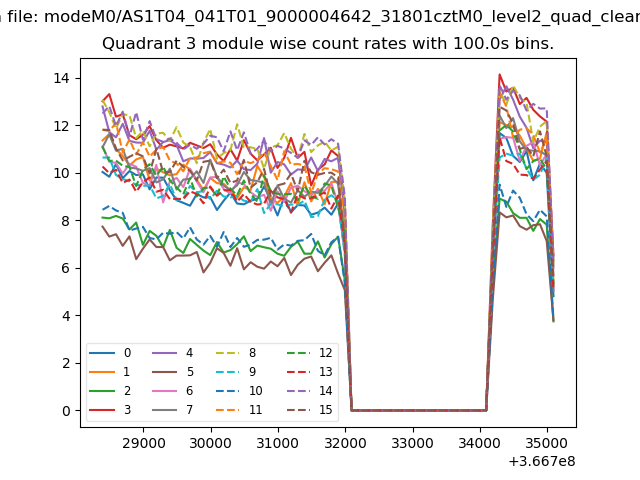
| Module-wise count rates for Quadrant A Data is divided into 100 sec bins |
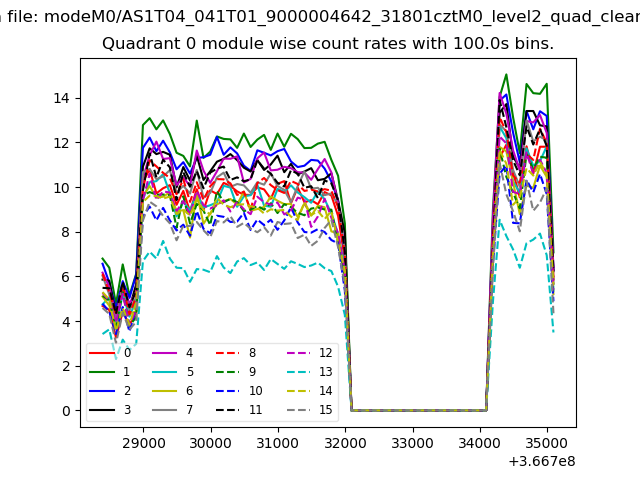 |
 |
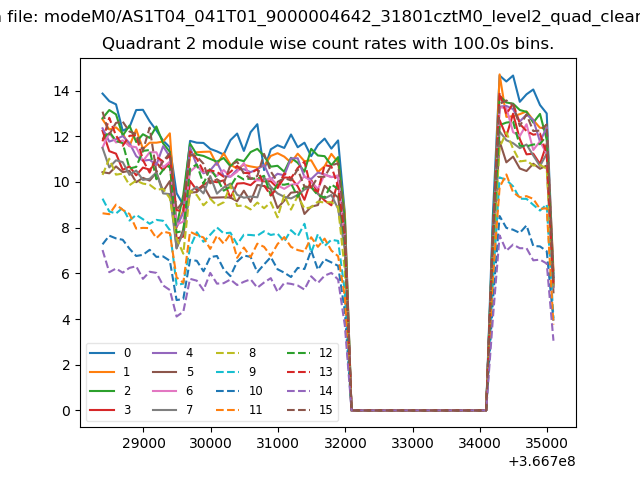
| Module-wise count rates for Quadrant B Data is divided into 100 sec bins |
 |
 |
| Module-wise count rates for Quadrant C Data is divided into 100 sec bins |
 |
 |
| Module-wise count rates for Quadrant D Data is divided into 100 sec bins |
 |
 |
| Parameter | Plot |
|---|---|
| CZT HV Monitor | 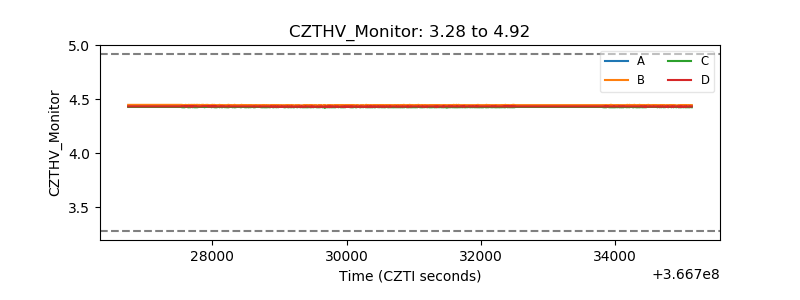 |
| D_VDD | 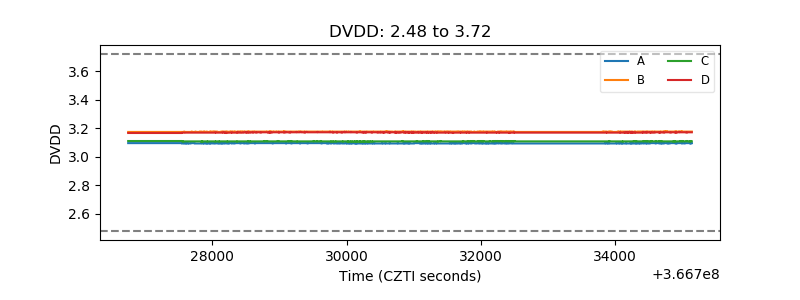 |
| Temperature 1 | 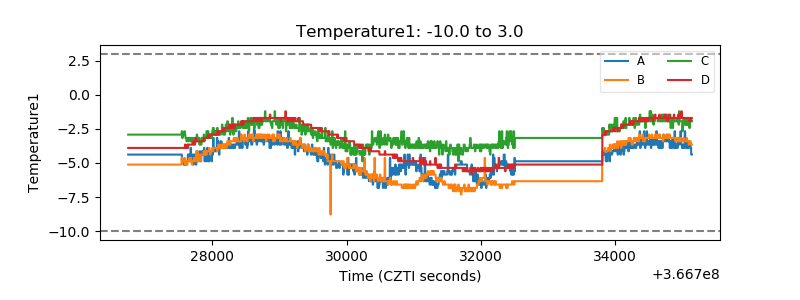 |
| Veto HV Monitor | 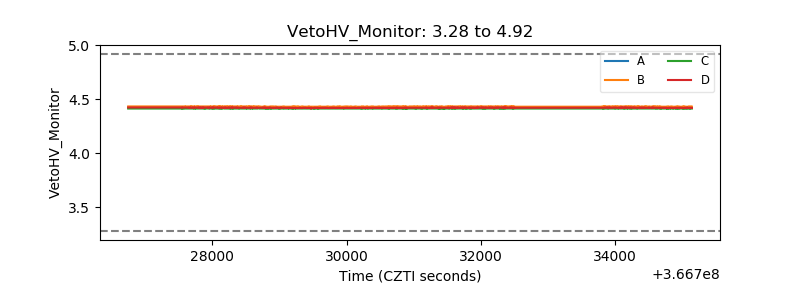 |
| Veto LLD | 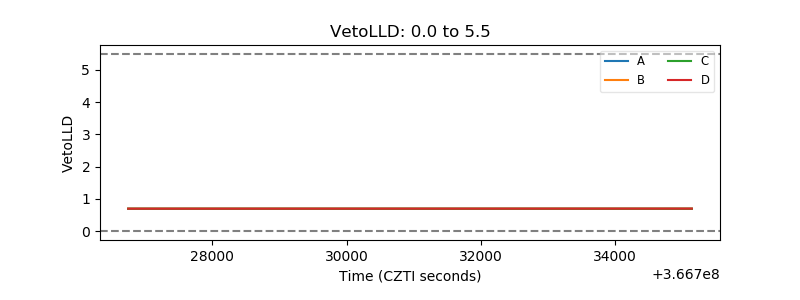 |
| Alpha Counter | 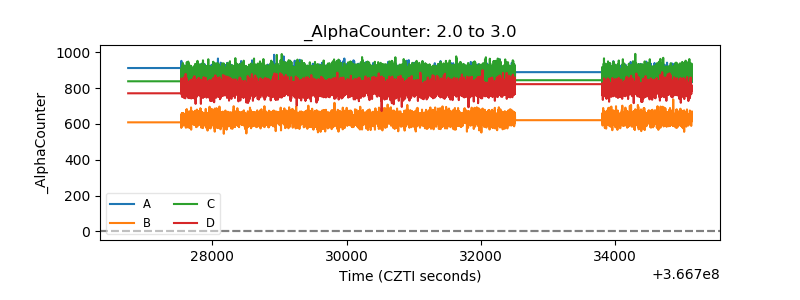 |
| _CPM_Rate | 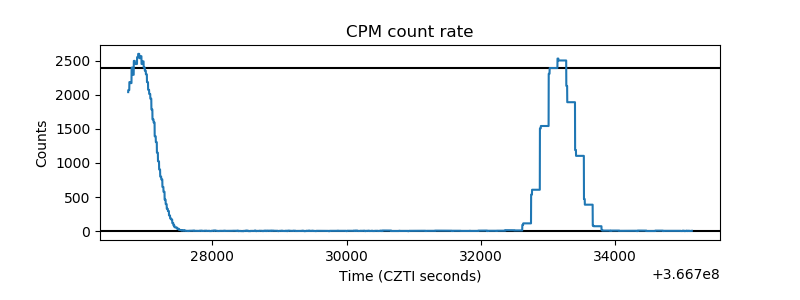 |
| CZT Counter | 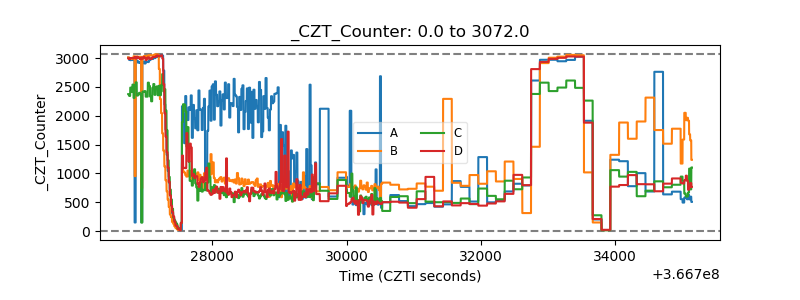 |
| +2.5 Volts monitor |  |
| +5 Volts monitor |  |
| _ROLL_ROT | 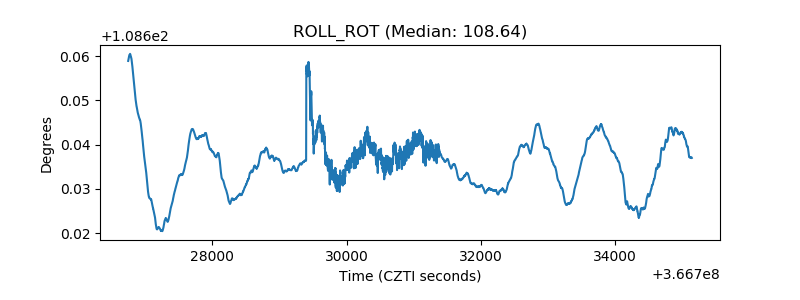 |
| _Roll_DEC | 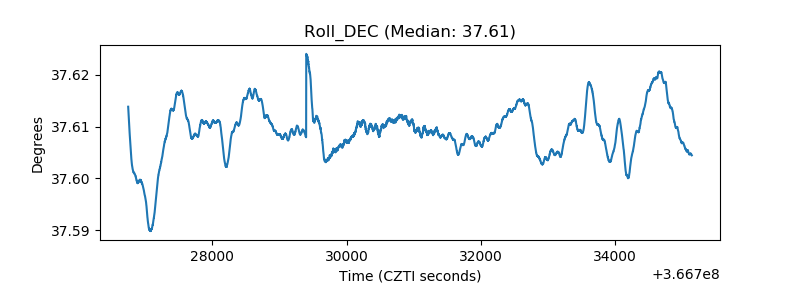 |
| _Roll_RA | 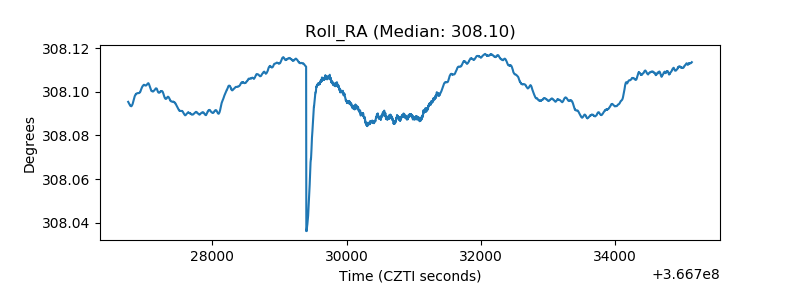 |
| Veto Counter | 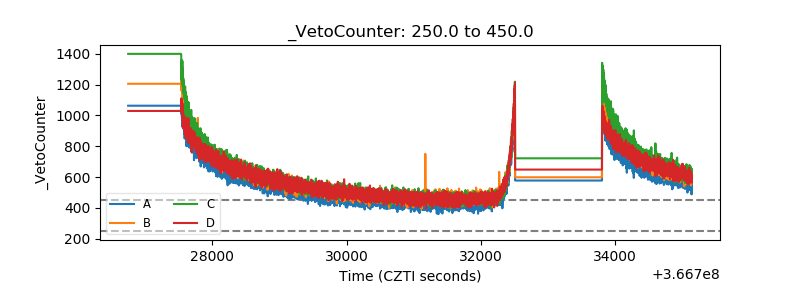 |