| Param | Original file | Final file |
|---|---|---|
| Filename | modeM0/AS1T04_041T01_9000004642_31803cztM0_level2.evt | modeM0/AS1T04_041T01_9000004642_31803cztM0_level2_quad_clean.evt |
| Size (bytes) | 567,504,000 | 115,934,400 |
| Size | 541.2 MB | 110.6 MB |
| Events in quadrant A | 3,882,553 | 783,846 |
| Events in quadrant B | 4,811,990 | 797,471 |
| Events in quadrant C | 4,031,794 | 762,304 |
| Events in quadrant D | 4,052,215 | 745,935 |
| Mode M9 | |||
|---|---|---|---|
| Quadrant | BADHDUFLAG | Total packets | Discarded packets |
| A | 0 | 13 | 0 |
| B | 0 | 13 | 0 |
| C | 0 | 13 | 0 |
| D | 0 | 13 | 0 |
| Mode M0 | |||
|---|---|---|---|
| Quadrant | BADHDUFLAG | Total packets | Discarded packets |
| A | 0 | 15454 | 1 |
| B | 0 | 18529 | 1 |
| C | 0 | 15974 | 1 |
| D | 0 | 15936 | 1 |
| Mode SS | |||
|---|---|---|---|
| Quadrant | BADHDUFLAG | Total packets | Discarded packets |
| A | 0 | 122 | 0 |
| B | 0 | 122 | 0 |
| C | 0 | 122 | 0 |
| D | 0 | 122 | 0 |
| Quadrant | Total seconds | Saturated seconds | Saturation percentage |
|---|---|---|---|
| A | 6042 | 281 | 4.650778% |
| B | 6042 | 154 | 2.548825% |
| C | 6041 | 276 | 4.568780% |
| D | 6041 | 91 | 1.506373% |
Noise dominated data is calculated using 1-second bins in cleaned event files. If a bin has >2000 counts, and if more than 50% of those come from <1% of pixels, then it is considered to be noise-dominated and hence unusable.
| Quadrant | # 1 sec bins | Bins with >0 counts | Bins with >2000 counts | High rate bins dominated by noise | Noise dominated (total time) | Noise dominated (detector-on time) | Marked lightcurve |
|---|---|---|---|---|---|---|---|
| A | 7357 | 6044 | 148 | 148 | 2.01% | 2.45% | 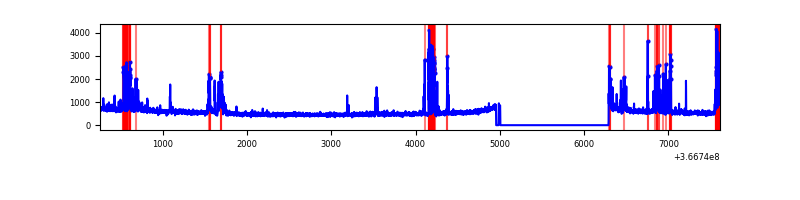 |
| B | 7357 | 6044 | 3 | 3 | 0.04% | 0.05% | 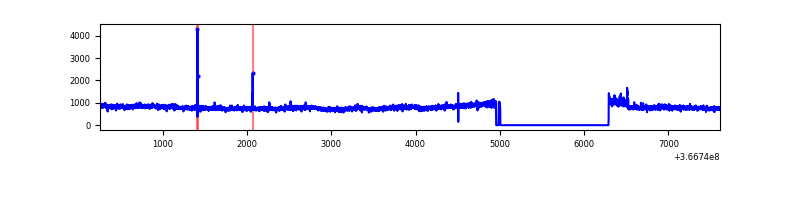 |
| C | 7356 | 6043 | 74 | 74 | 1.01% | 1.22% | 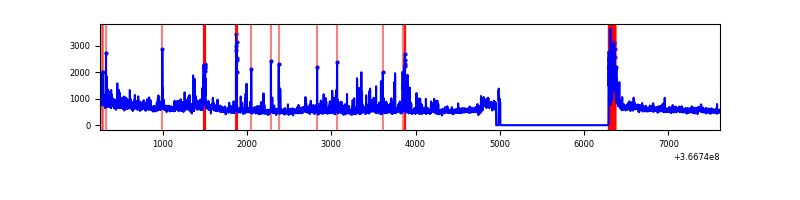 |
| D | 7356 | 6043 | 26 | 26 | 0.35% | 0.43% | 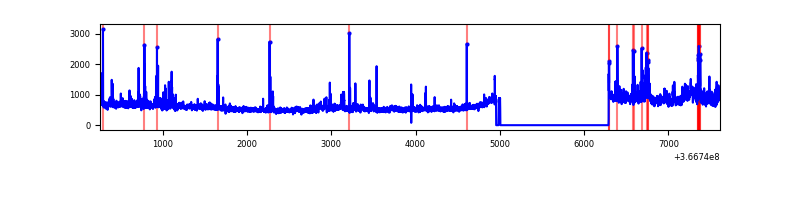 |
Top three noisy pixels from each quadrant. If the there are fewer than three noisy pixels in the level2.evt file, extra rows are filled as -1
| Pixel properties | Quadrant properties | ||||||
|---|---|---|---|---|---|---|---|
| Quadrant | DetID | PixID | Counts | Sigma | Mean | Median | Sigma |
| A | 0 | 13 | 620135 | 3816.89 | 816 | 804 | 162.3 |
| A | 15 | 174 | 103218 | 631.17 | 816 | 804 | 162.3 |
| A | 13 | 6 | 11757 | 67.5 | 816 | 804 | 162.3 |
| B | 6 | 159 | 1558001 | 10264.06 | 811 | 792 | 151.7 |
| B | 0 | 229 | 49459 | 320.78 | 811 | 792 | 151.7 |
| B | 12 | 111 | 17580 | 110.66 | 811 | 792 | 151.7 |
| C | 0 | 10 | 558655 | 3031.27 | 795 | 804 | 184.0 |
| C | 3 | 233 | 170414 | 921.63 | 795 | 804 | 184.0 |
| C | 14 | 238 | 133036 | 718.53 | 795 | 804 | 184.0 |
| D | 8 | 195 | 733178 | 3866.15 | 810 | 791 | 189.4 |
| D | 12 | 233 | 93006 | 486.79 | 810 | 791 | 189.4 |
| D | 2 | 250 | 72203 | 376.97 | 810 | 791 | 189.4 |
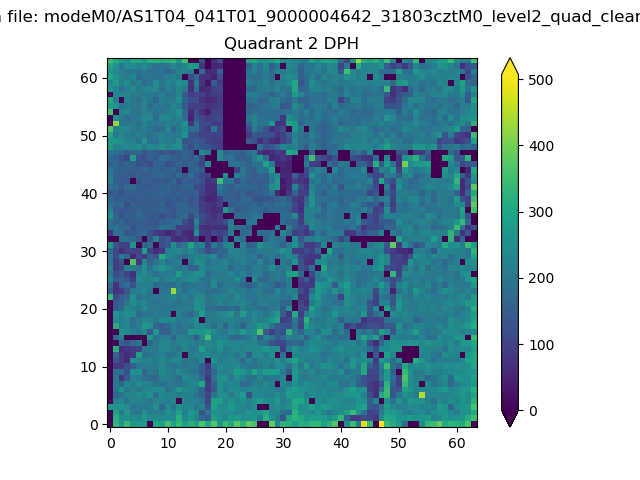
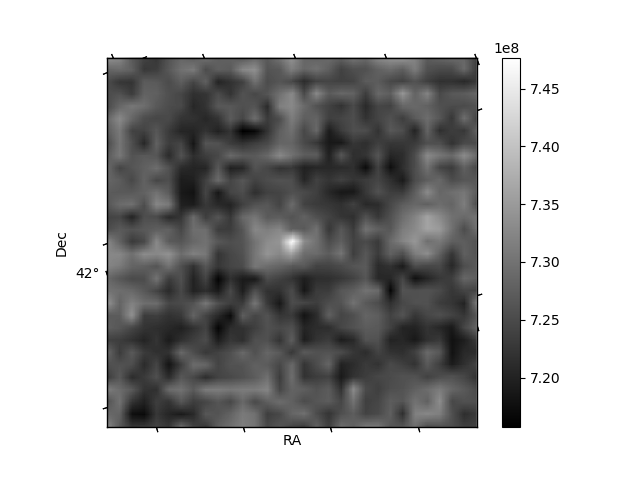
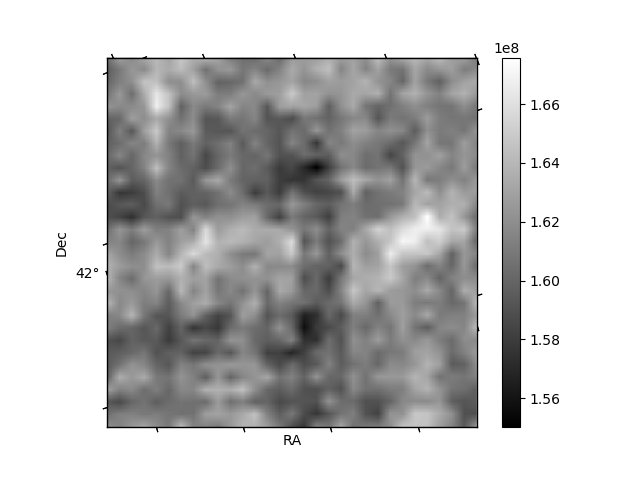
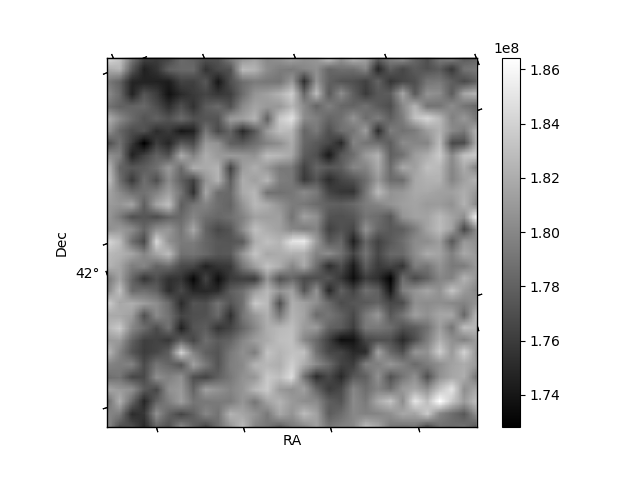
Histogram calculated using DETX and DETY for each event in the final _common_clean file
| Quadrant A | 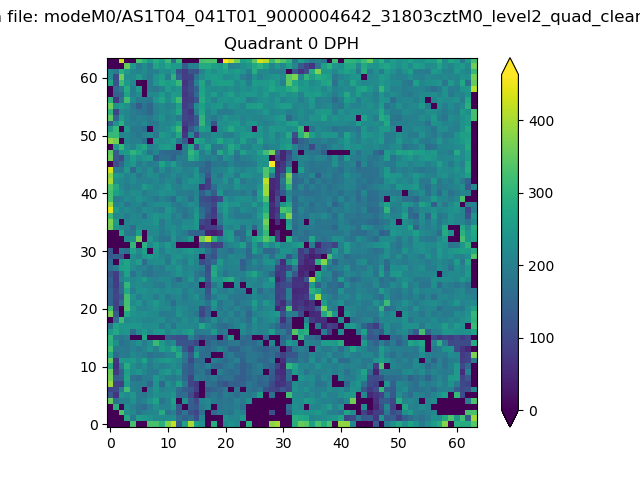 |
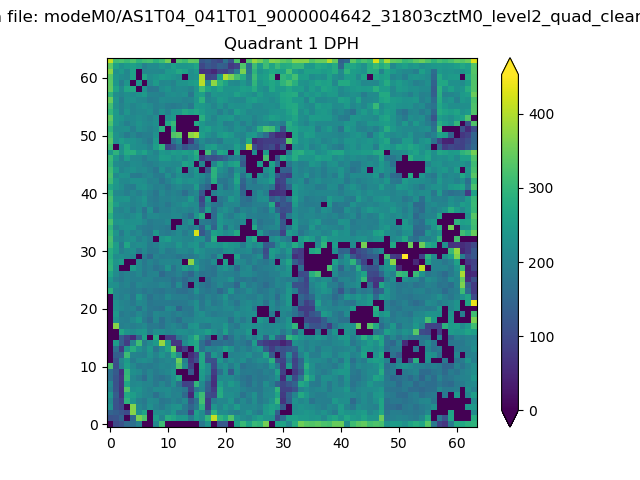 |
Quadrant B |
|---|---|---|---|
| Quadrant D | 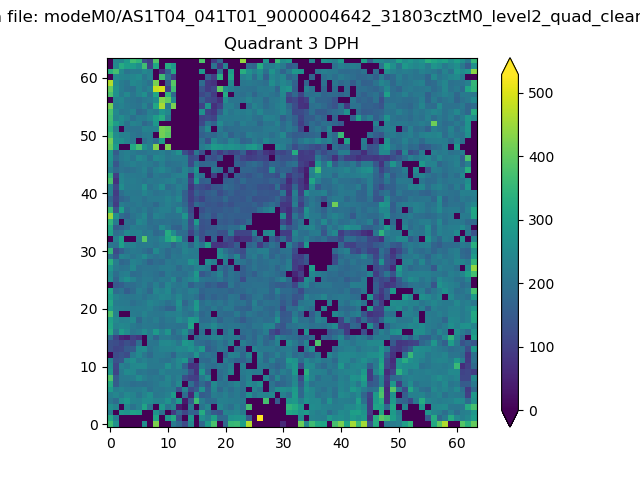 |
 |
Quadrant C |
| Plot type | Count rate plots | Images |
|---|---|---|
| Comparison with Poisson distribution Blue bars denote a histogram of data divided into 1 sec bins. Red curve is a Poisson curve with rate = median count rate of data. |
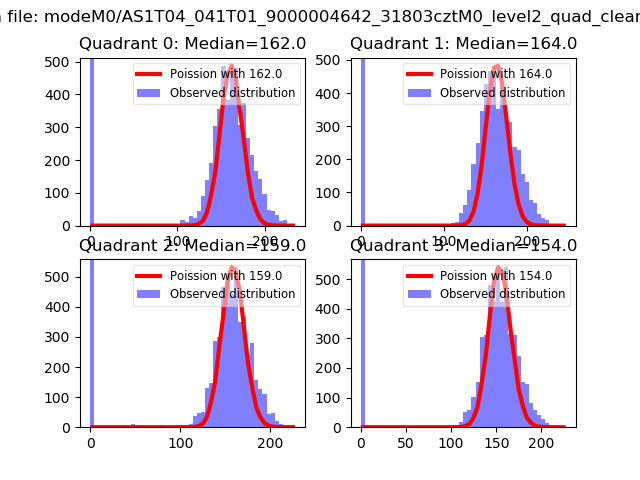 |
 |
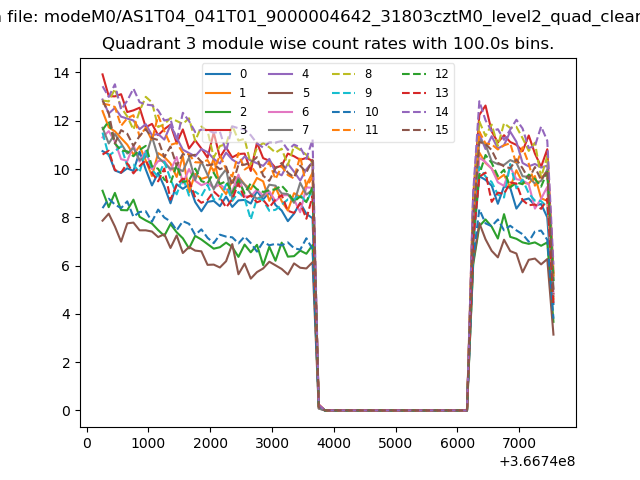
| Quadrant-wise count rates Data is divided into 100 sec bins |
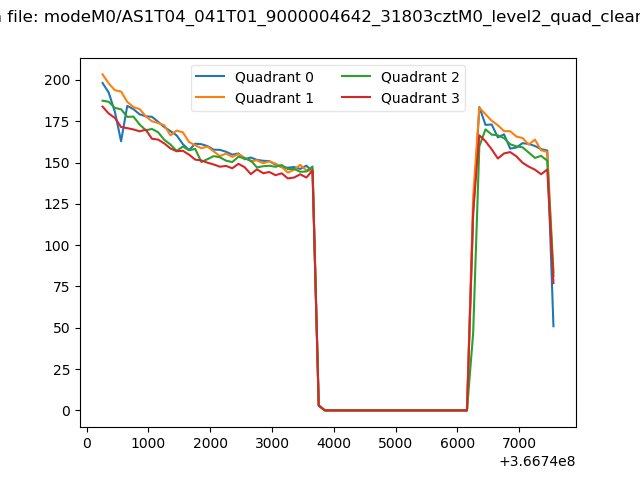 |
|
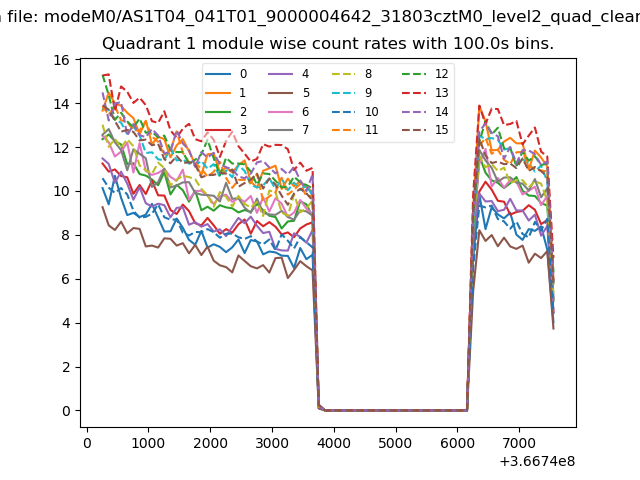
| Module-wise count rates for Quadrant A Data is divided into 100 sec bins |
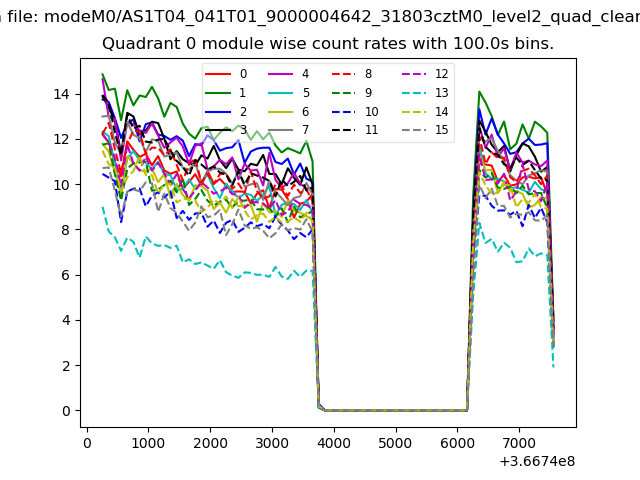 |
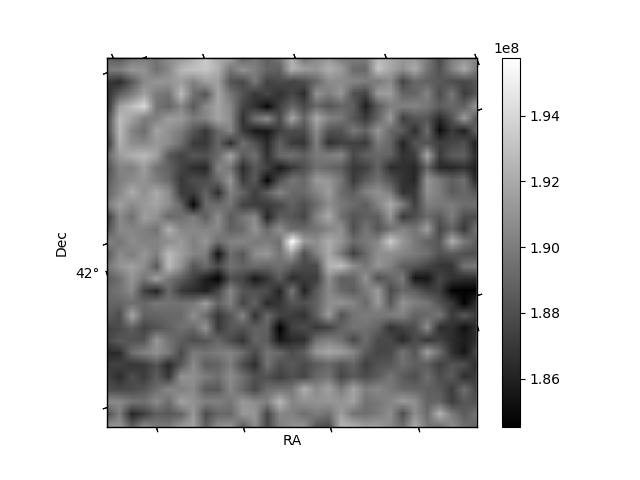 |
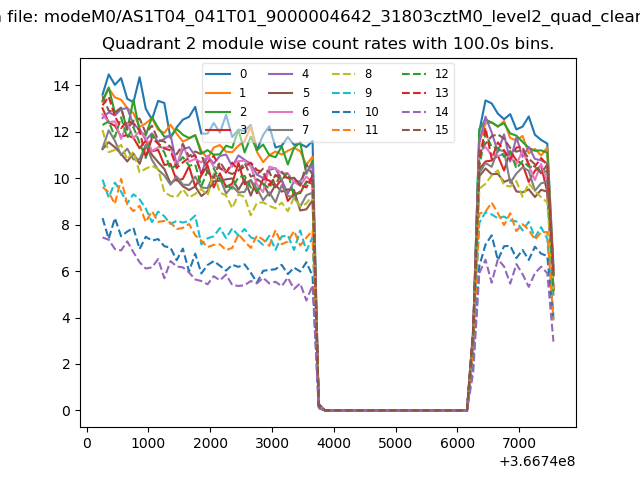
| Module-wise count rates for Quadrant B Data is divided into 100 sec bins |
 |
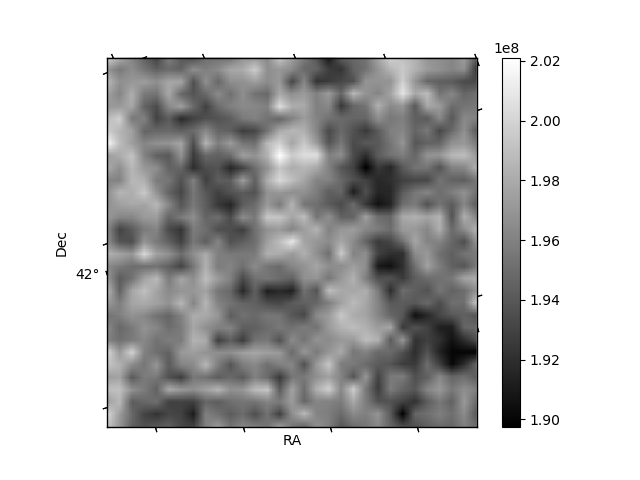 |
| Module-wise count rates for Quadrant C Data is divided into 100 sec bins |
 |
 |
| Module-wise count rates for Quadrant D Data is divided into 100 sec bins |
 |
 |
| Parameter | Plot |
|---|---|
| CZT HV Monitor | 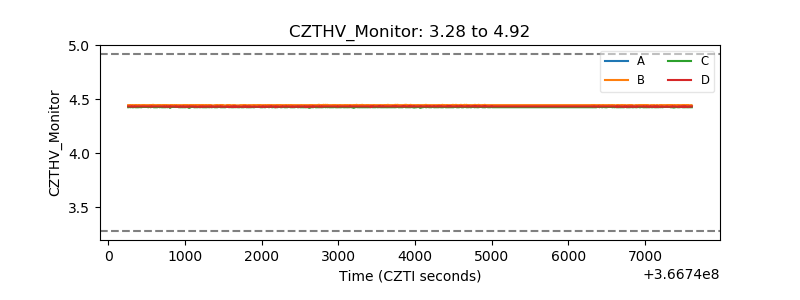 |
| D_VDD | 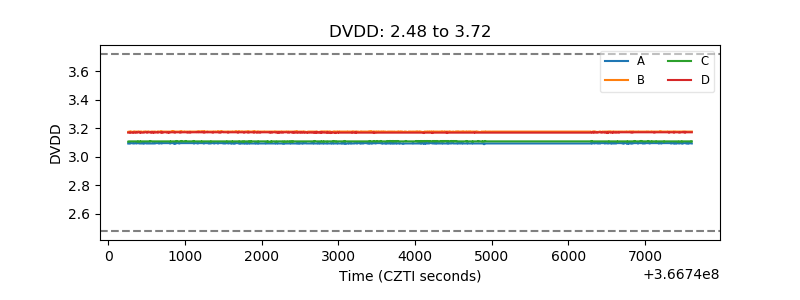 |
| Temperature 1 | 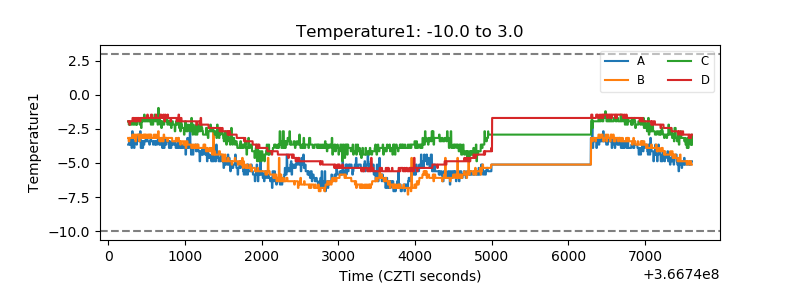 |
| Veto HV Monitor | 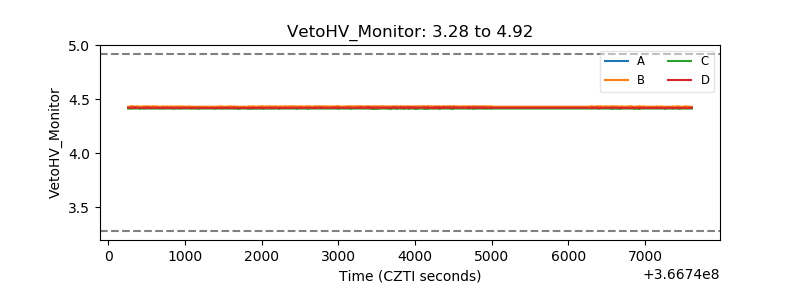 |
| Veto LLD | 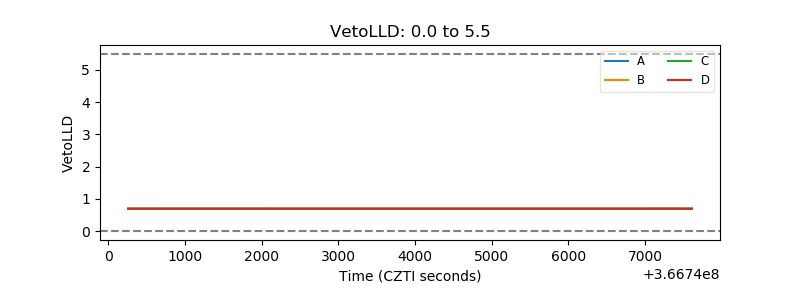 |
| Alpha Counter | 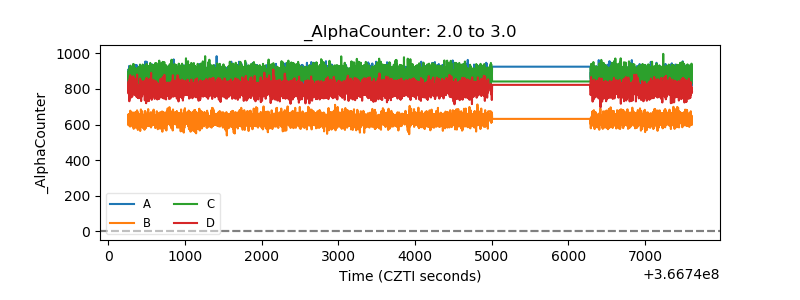 |
| _CPM_Rate | 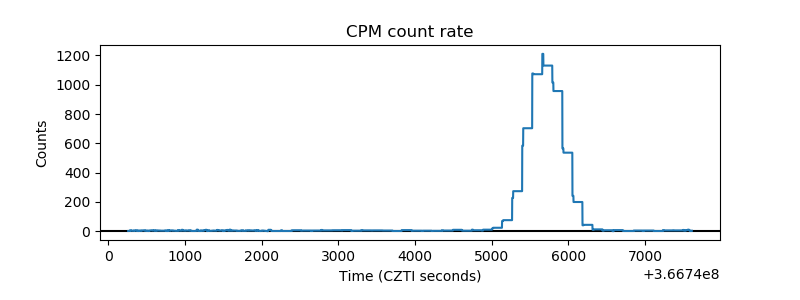 |
| CZT Counter | 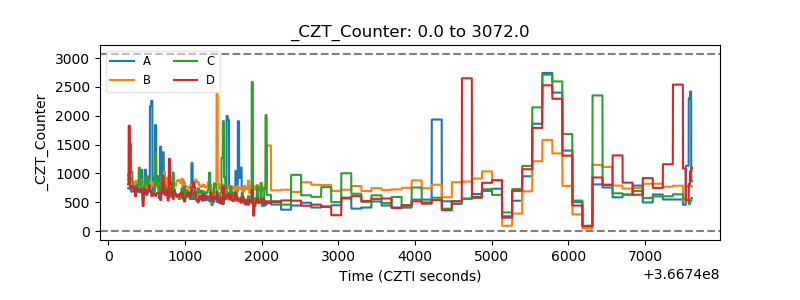 |
| +2.5 Volts monitor | 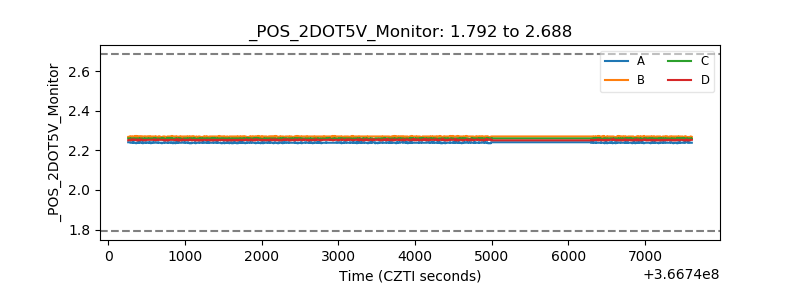 |
| +5 Volts monitor |  |
| _ROLL_ROT | 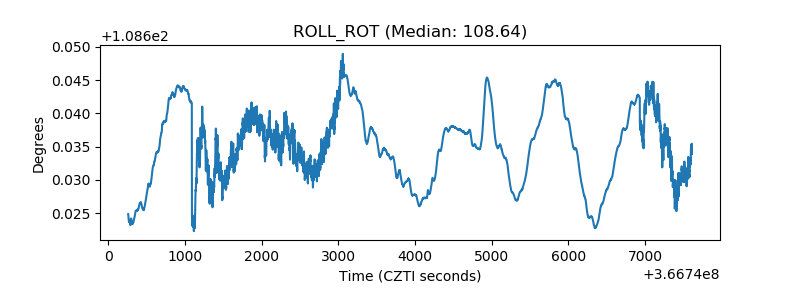 |
| _Roll_DEC | 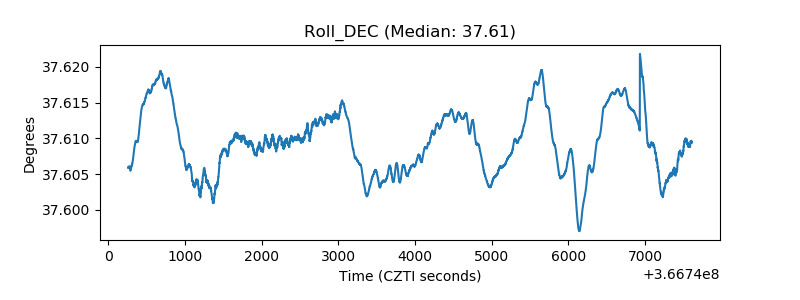 |
| _Roll_RA | 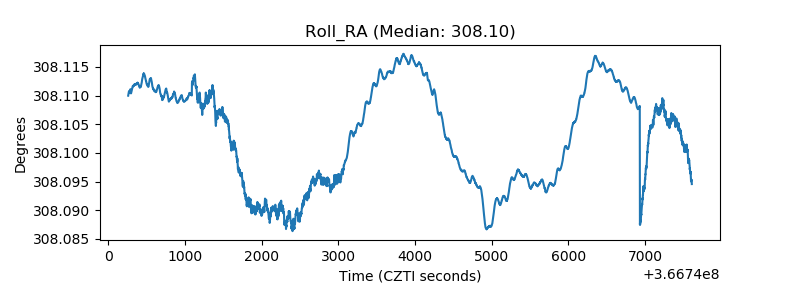 |
| Veto Counter | 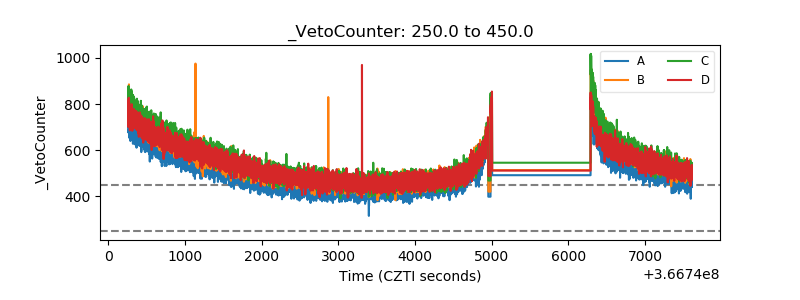 |