| Param | Original file | Final file |
|---|---|---|
| Filename | modeM0/AS1T04_041T01_9000004642_31805cztM0_level2.evt | modeM0/AS1T04_041T01_9000004642_31805cztM0_level2_quad_clean.evt |
| Size (bytes) | 696,597,120 | 102,196,800 |
| Size | 664.3 MB | 97.5 MB |
| Events in quadrant A | 6,400,716 | 644,320 |
| Events in quadrant B | 5,388,921 | 687,697 |
| Events in quadrant C | 4,406,036 | 627,116 |
| Events in quadrant D | 4,429,233 | 649,912 |
| Mode M9 | |||
|---|---|---|---|
| Quadrant | BADHDUFLAG | Total packets | Discarded packets |
| A | 0 | 6 | 0 |
| B | 0 | 7 | 0 |
| C | 0 | 7 | 0 |
| D | 0 | 7 | 0 |
| Mode M0 | |||
|---|---|---|---|
| Quadrant | BADHDUFLAG | Total packets | Discarded packets |
| A | 0 | 23726 | 8 |
| B | 0 | 21275 | 2 |
| C | 0 | 17672 | 2 |
| D | 0 | 17866 | 2 |
| Mode SS | |||
|---|---|---|---|
| Quadrant | BADHDUFLAG | Total packets | Discarded packets |
| A | 0 | 142 | 0 |
| B | 0 | 142 | 0 |
| C | 0 | 142 | 0 |
| D | 0 | 142 | 0 |
| Quadrant | Total seconds | Saturated seconds | Saturation percentage |
|---|---|---|---|
| A | 6966 | 1052 | 15.101924% |
| B | 6966 | 134 | 1.923629% |
| C | 6966 | 1264 | 18.145277% |
| D | 6966 | 71 | 1.019236% |
Noise dominated data is calculated using 1-second bins in cleaned event files. If a bin has >2000 counts, and if more than 50% of those come from <1% of pixels, then it is considered to be noise-dominated and hence unusable.
| Quadrant | # 1 sec bins | Bins with >0 counts | Bins with >2000 counts | High rate bins dominated by noise | Noise dominated (total time) | Noise dominated (detector-on time) | Marked lightcurve |
|---|---|---|---|---|---|---|---|
| A | 7621 | 6967 | 759 | 759 | 9.96% | 10.89% | 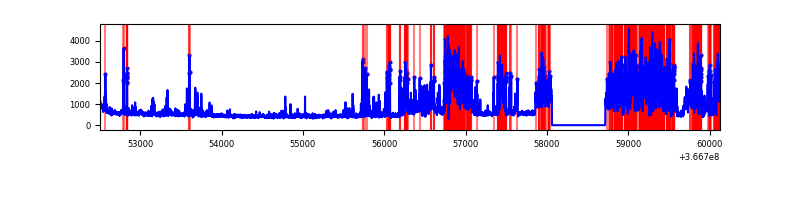 |
| B | 7621 | 6967 | 13 | 13 | 0.17% | 0.19% | 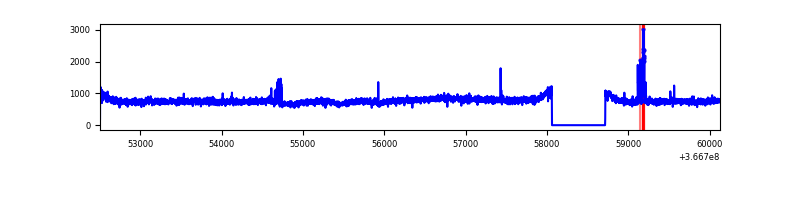 |
| C | 7621 | 6967 | 62 | 62 | 0.81% | 0.89% | 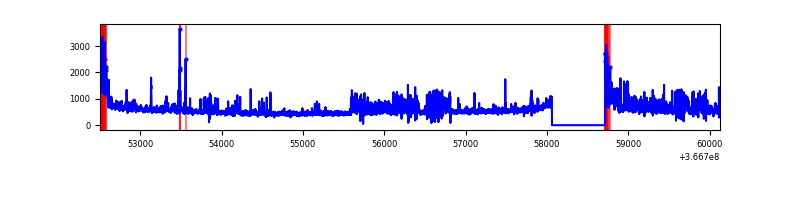 |
| D | 7621 | 6967 | 11 | 11 | 0.14% | 0.16% | 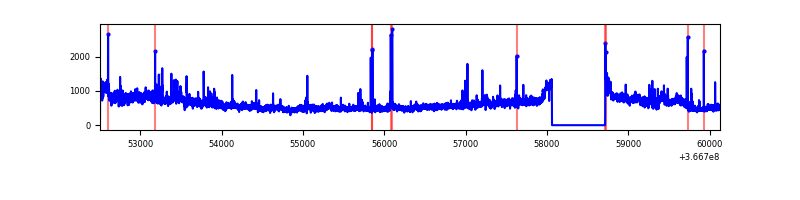 |
Top three noisy pixels from each quadrant. If the there are fewer than three noisy pixels in the level2.evt file, extra rows are filled as -1
| Pixel properties | Quadrant properties | ||||||
|---|---|---|---|---|---|---|---|
| Quadrant | DetID | PixID | Counts | Sigma | Mean | Median | Sigma |
| A | 0 | 13 | 3197657 | 19228.84 | 828 | 813 | 166.3 |
| A | 13 | 254 | 11248 | 62.77 | 828 | 813 | 166.3 |
| A | 13 | 6 | 8607 | 46.88 | 828 | 813 | 166.3 |
| B | 6 | 159 | 1877963 | 11234.26 | 869 | 849 | 167.1 |
| B | 10 | 245 | 61971 | 365.81 | 869 | 849 | 167.1 |
| B | 15 | 33 | 27396 | 158.88 | 869 | 849 | 167.1 |
| C | 0 | 10 | 448952 | 2445.58 | 778 | 784 | 183.3 |
| C | 14 | 238 | 404556 | 2203.31 | 778 | 784 | 183.3 |
| C | 14 | 254 | 400837 | 2183.02 | 778 | 784 | 183.3 |
| D | 8 | 195 | 1003049 | 4801.15 | 859 | 837 | 208.7 |
| D | 12 | 227 | 58152 | 274.57 | 859 | 837 | 208.7 |
| D | 12 | 233 | 54794 | 258.48 | 859 | 837 | 208.7 |
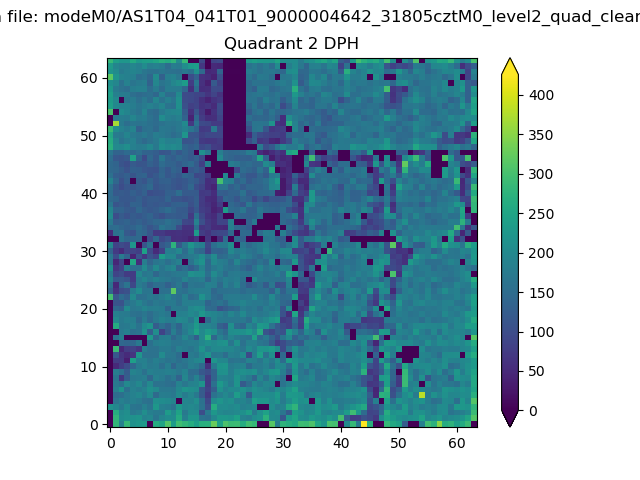
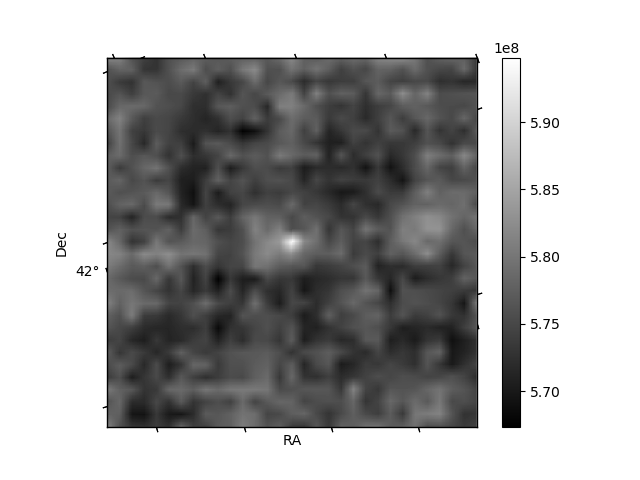
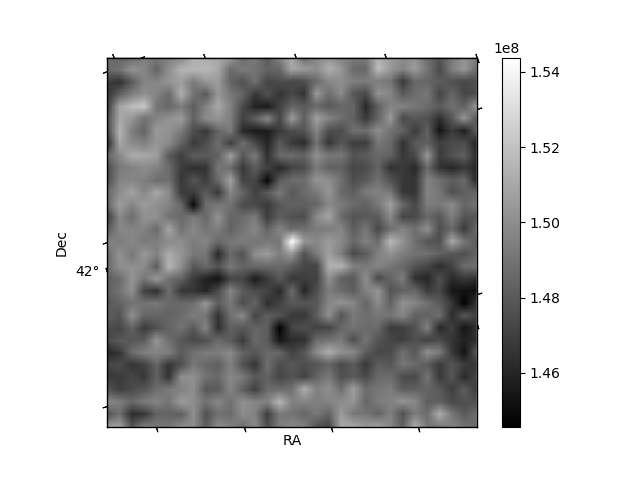
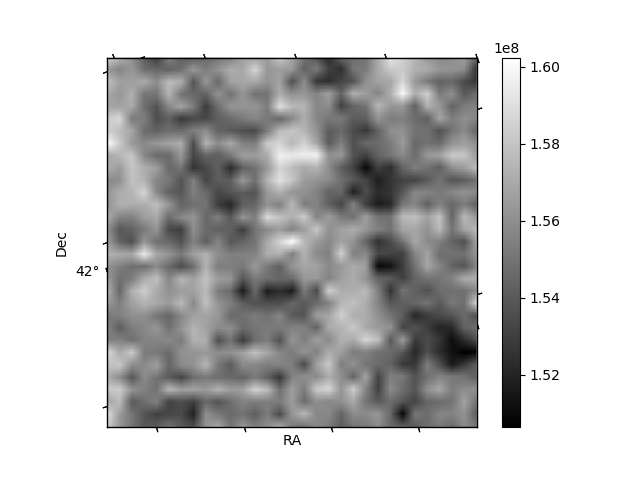
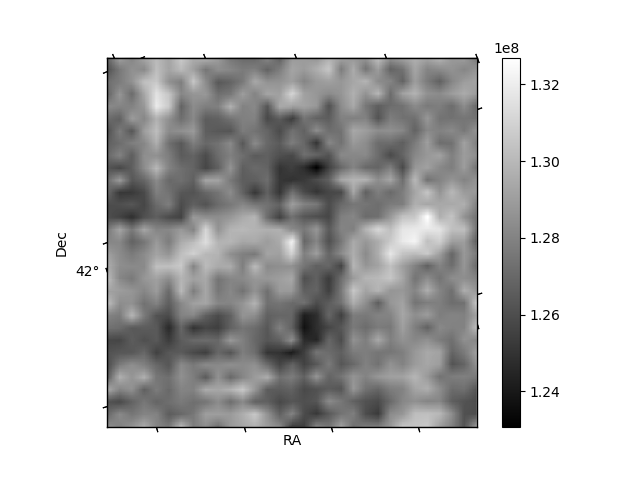
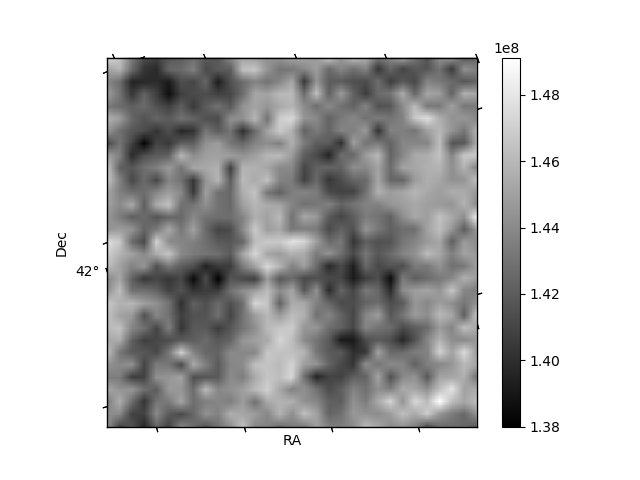
Histogram calculated using DETX and DETY for each event in the final _common_clean file
| Quadrant A | 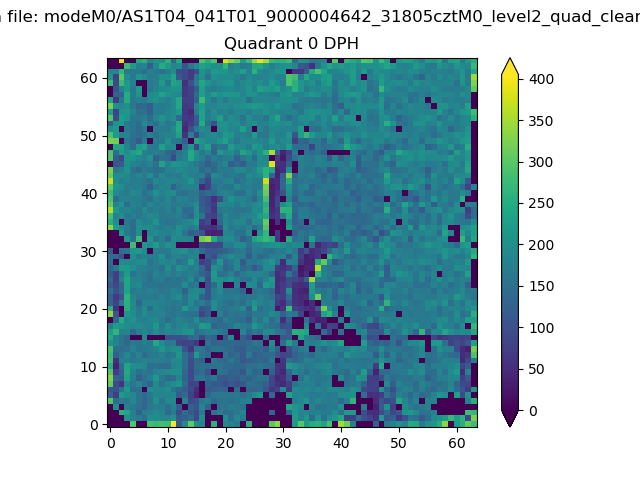 |
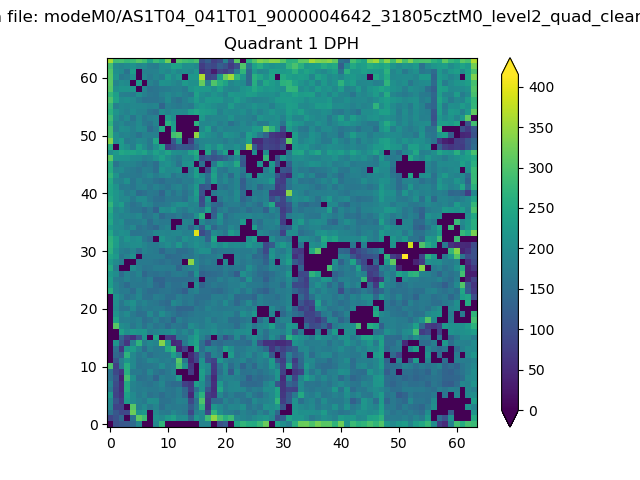 |
Quadrant B |
|---|---|---|---|
| Quadrant D | 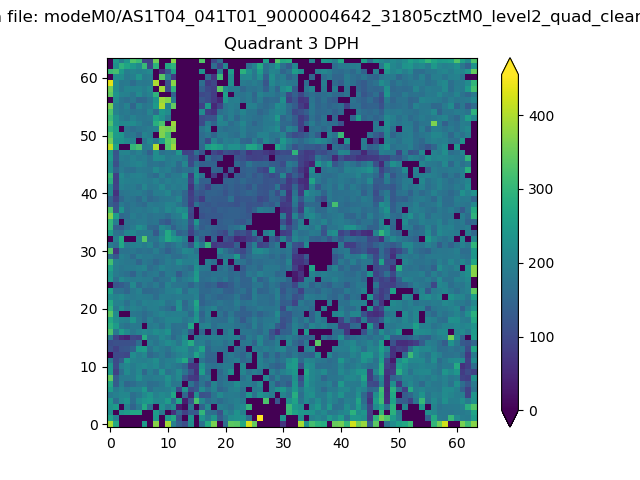 |
 |
Quadrant C |
| Plot type | Count rate plots | Images |
|---|---|---|
| Comparison with Poisson distribution Blue bars denote a histogram of data divided into 1 sec bins. Red curve is a Poisson curve with rate = median count rate of data. |
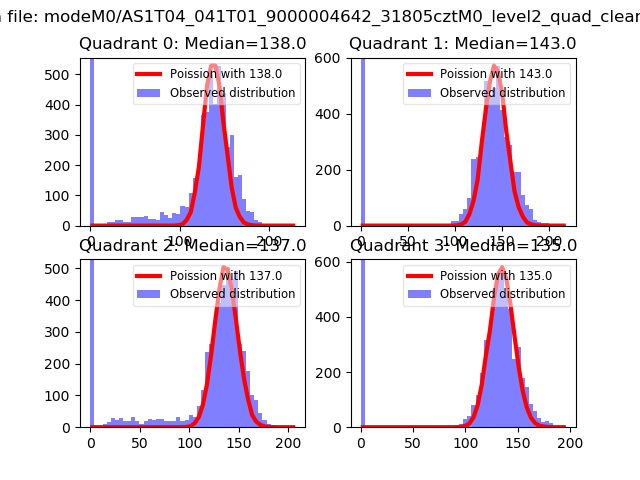 |
 |
| Quadrant-wise count rates Data is divided into 100 sec bins |
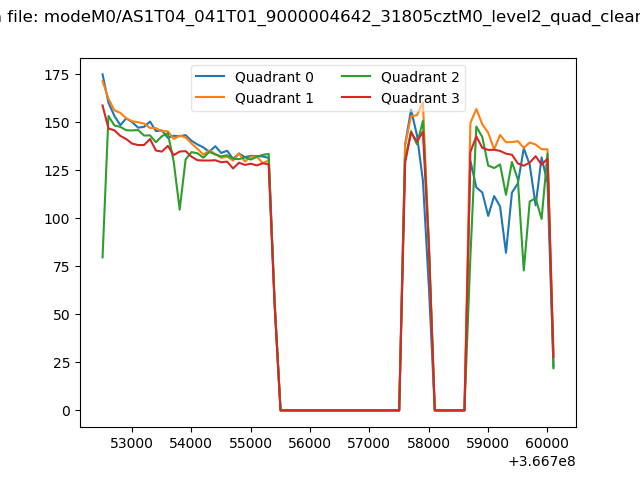 |
|
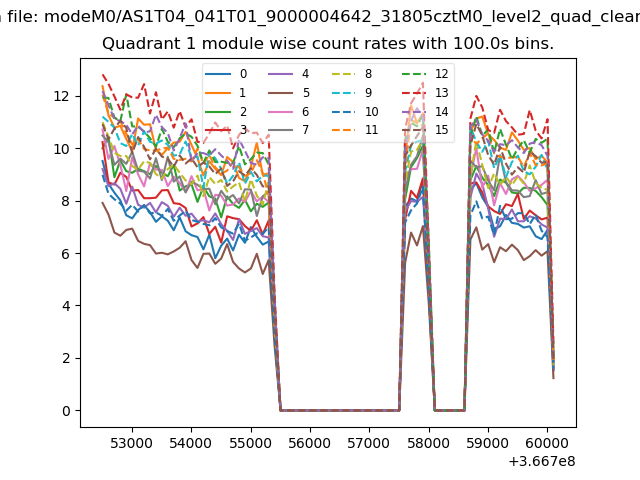
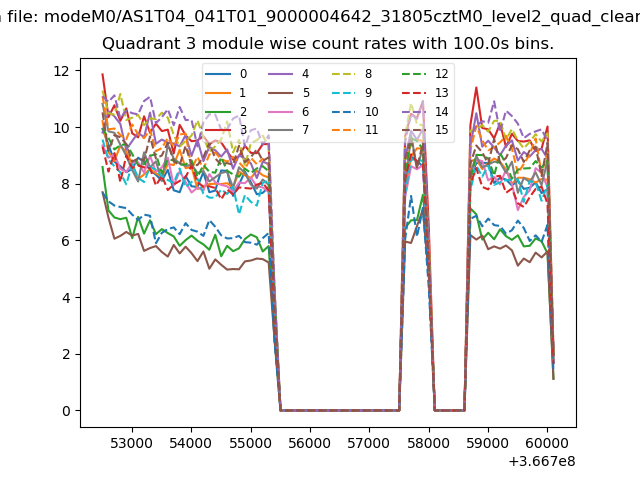
| Module-wise count rates for Quadrant A Data is divided into 100 sec bins |
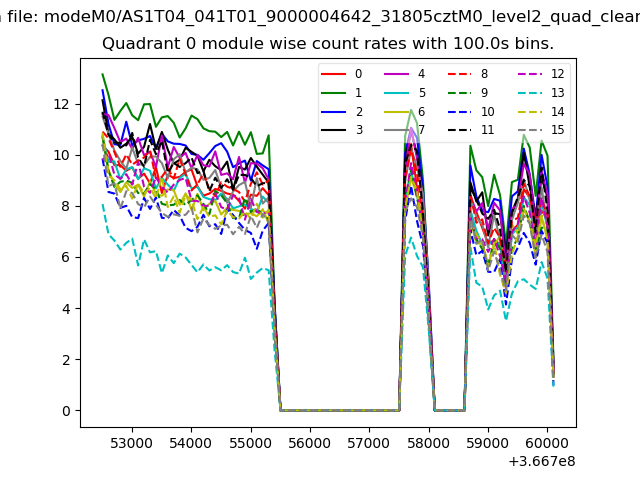 |
 |
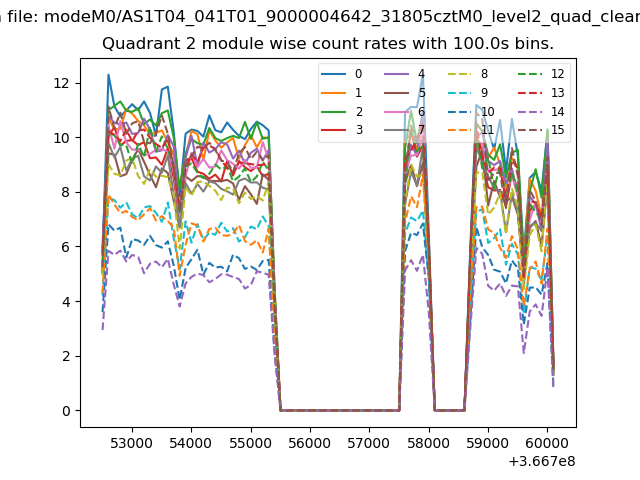
| Module-wise count rates for Quadrant B Data is divided into 100 sec bins |
 |
 |
| Module-wise count rates for Quadrant C Data is divided into 100 sec bins |
 |
 |
| Module-wise count rates for Quadrant D Data is divided into 100 sec bins |
 |
 |
| Parameter | Plot |
|---|---|
| CZT HV Monitor |  |
| D_VDD | 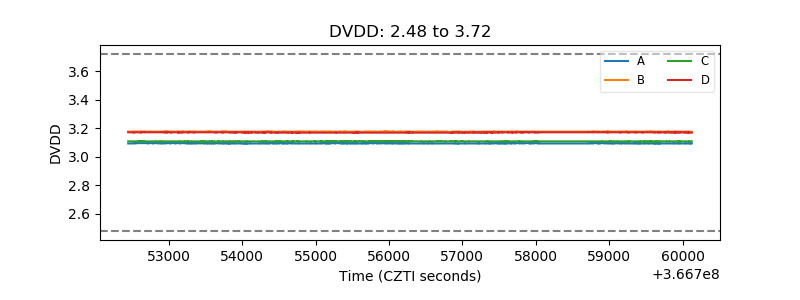 |
| Temperature 1 | 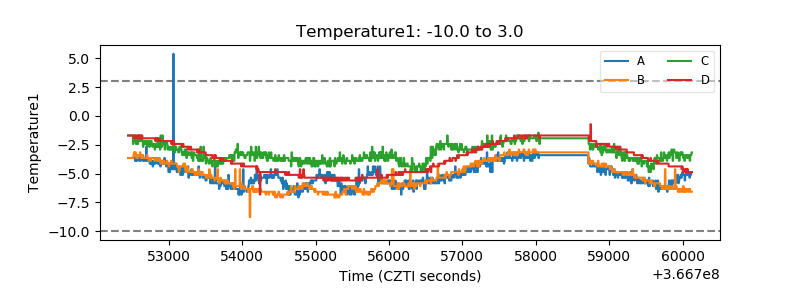 |
| Veto HV Monitor | 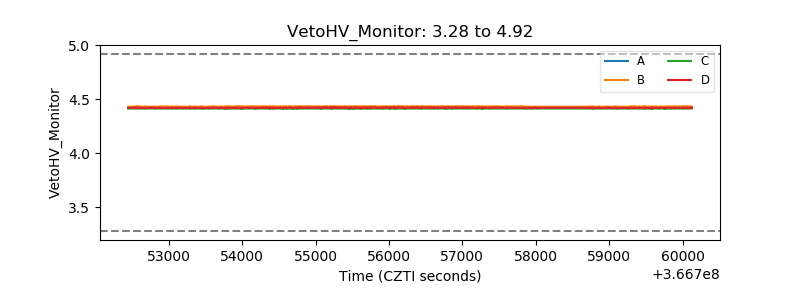 |
| Veto LLD | 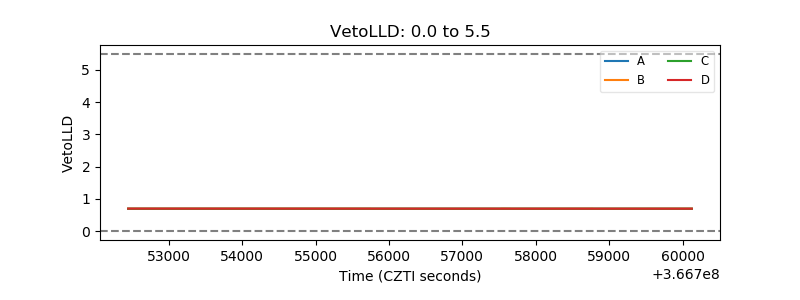 |
| Alpha Counter | 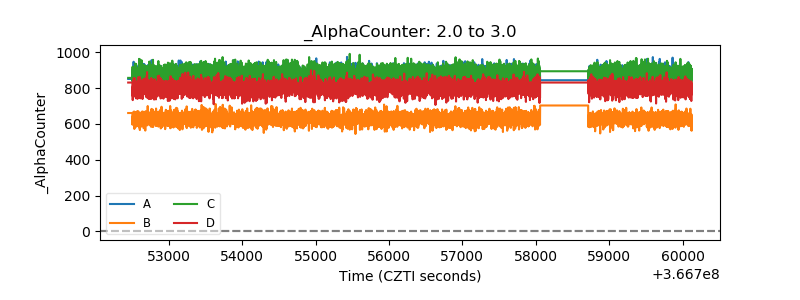 |
| _CPM_Rate | 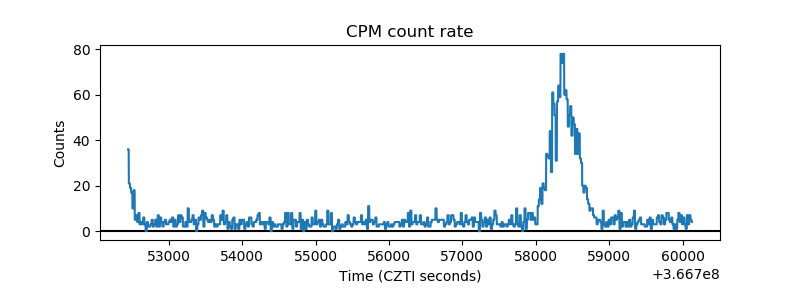 |
| CZT Counter | 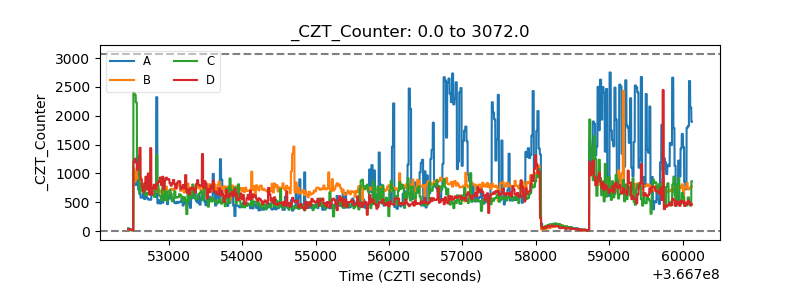 |
| +2.5 Volts monitor | 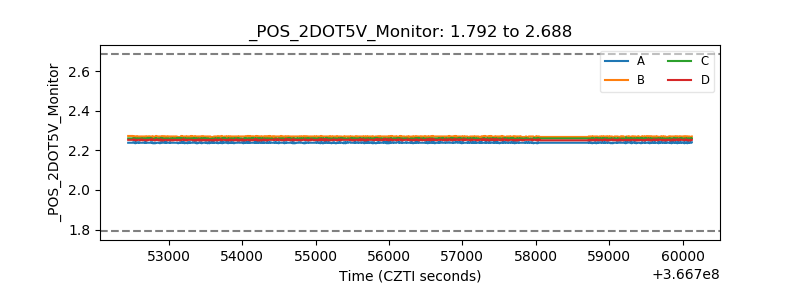 |
| +5 Volts monitor |  |
| _ROLL_ROT | 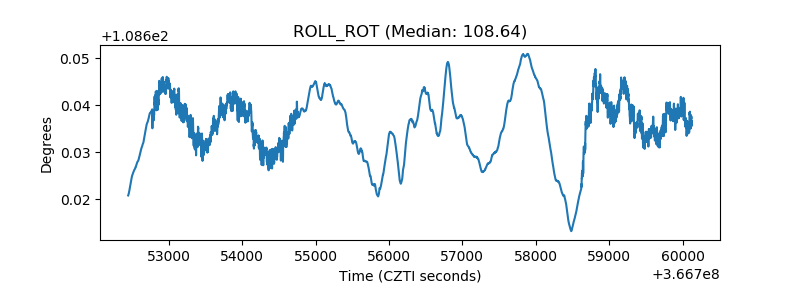 |
| _Roll_DEC | 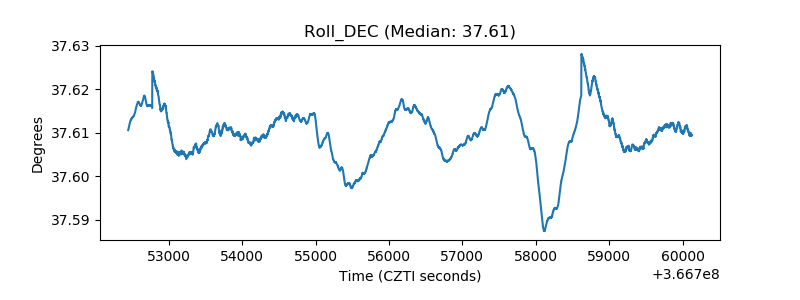 |
| _Roll_RA | 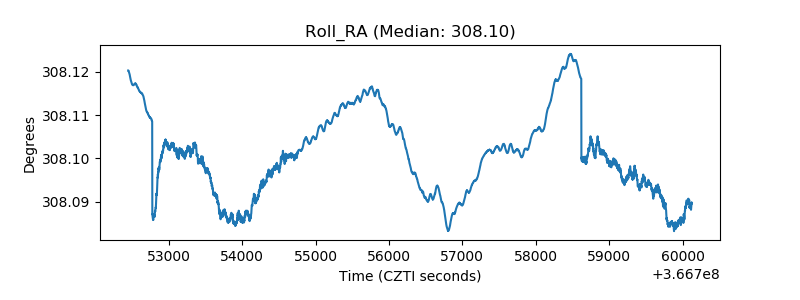 |
| Veto Counter | 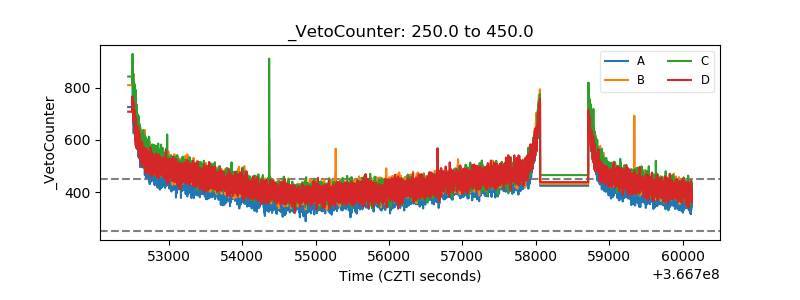 |