| Param | Original file | Final file |
|---|---|---|
| Filename | modeM0/AS1T04_041T01_9000004642_31806cztM0_level2.evt | modeM0/AS1T04_041T01_9000004642_31806cztM0_level2_quad_clean.evt |
| Size (bytes) | 770,123,520 | 99,869,760 |
| Size | 734.4 MB | 95.2 MB |
| Events in quadrant A | 7,989,948 | 615,547 |
| Events in quadrant B | 5,749,127 | 679,885 |
| Events in quadrant C | 4,432,101 | 599,972 |
| Events in quadrant D | 4,678,529 | 639,974 |
| Mode M9 | |||
|---|---|---|---|
| Quadrant | BADHDUFLAG | Total packets | Discarded packets |
| A | 0 | 5 | 0 |
| B | 0 | 6 | 0 |
| C | 0 | 6 | 0 |
| D | 0 | 6 | 0 |
| Mode M0 | |||
|---|---|---|---|
| Quadrant | BADHDUFLAG | Total packets | Discarded packets |
| A | 0 | 28524 | 2 |
| B | 0 | 22105 | 2 |
| C | 0 | 17810 | 2 |
| D | 0 | 18730 | 2 |
| Mode SS | |||
|---|---|---|---|
| Quadrant | BADHDUFLAG | Total packets | Discarded packets |
| A | 0 | 144 | 0 |
| B | 0 | 144 | 0 |
| C | 0 | 144 | 0 |
| D | 0 | 144 | 0 |
| Quadrant | Total seconds | Saturated seconds | Saturation percentage |
|---|---|---|---|
| A | 7001 | 1596 | 22.796743% |
| B | 7001 | 176 | 2.513927% |
| C | 7001 | 1520 | 21.711184% |
| D | 7001 | 92 | 1.314098% |
Noise dominated data is calculated using 1-second bins in cleaned event files. If a bin has >2000 counts, and if more than 50% of those come from <1% of pixels, then it is considered to be noise-dominated and hence unusable.
| Quadrant | # 1 sec bins | Bins with >0 counts | Bins with >2000 counts | High rate bins dominated by noise | Noise dominated (total time) | Noise dominated (detector-on time) | Marked lightcurve |
|---|---|---|---|---|---|---|---|
| A | 7251 | 7002 | 1133 | 1133 | 15.63% | 16.18% | 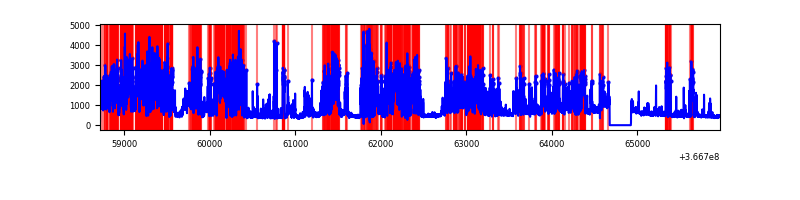 |
| B | 7251 | 7002 | 17 | 17 | 0.23% | 0.24% | 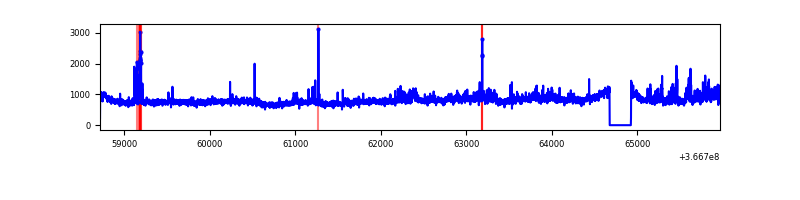 |
| C | 7251 | 7002 | 32 | 32 | 0.44% | 0.46% | 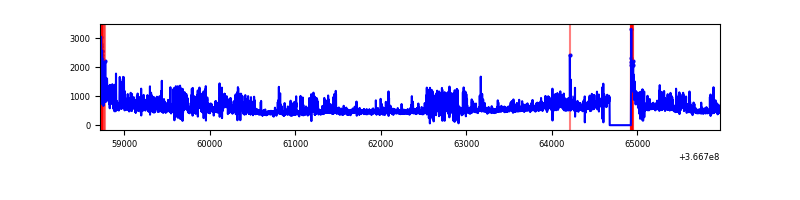 |
| D | 7251 | 7002 | 40 | 40 | 0.55% | 0.57% | 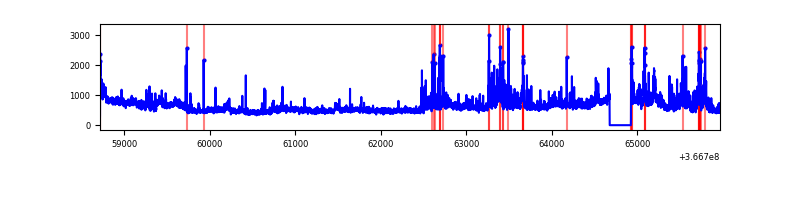 |
Top three noisy pixels from each quadrant. If the there are fewer than three noisy pixels in the level2.evt file, extra rows are filled as -1
| Pixel properties | Quadrant properties | ||||||
|---|---|---|---|---|---|---|---|
| Quadrant | DetID | PixID | Counts | Sigma | Mean | Median | Sigma |
| A | 0 | 13 | 4849578 | 29866.03 | 812 | 794 | 162.4 |
| A | 13 | 254 | 11974 | 68.86 | 812 | 794 | 162.4 |
| A | 3 | 137 | 8561 | 47.84 | 812 | 794 | 162.4 |
| B | 6 | 159 | 1902059 | 11206.52 | 869 | 846 | 169.7 |
| B | 4 | 80 | 263540 | 1548.42 | 869 | 846 | 169.7 |
| B | 10 | 245 | 152259 | 892.49 | 869 | 846 | 169.7 |
| C | 14 | 254 | 528337 | 2883.58 | 766 | 772 | 183.0 |
| C | 14 | 238 | 495516 | 2704.19 | 766 | 772 | 183.0 |
| C | 0 | 10 | 356789 | 1945.93 | 766 | 772 | 183.0 |
| D | 8 | 195 | 659779 | 3256.56 | 853 | 832 | 202.3 |
| D | 12 | 227 | 379537 | 1871.59 | 853 | 832 | 202.3 |
| D | 12 | 218 | 315987 | 1557.52 | 853 | 832 | 202.3 |
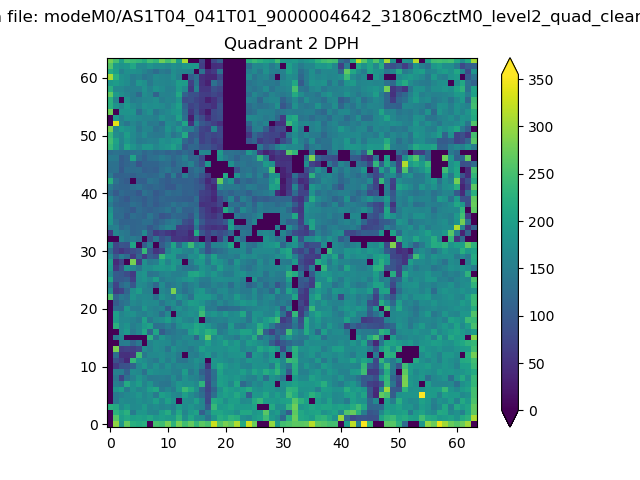
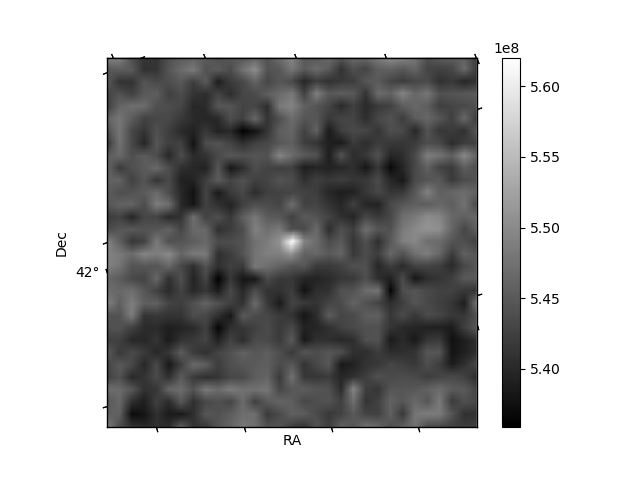
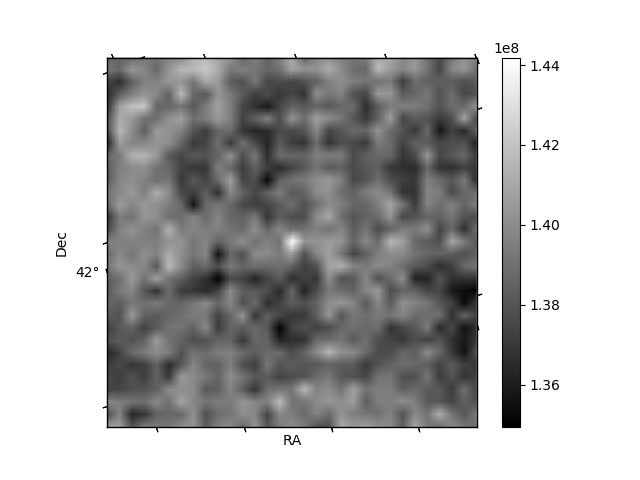
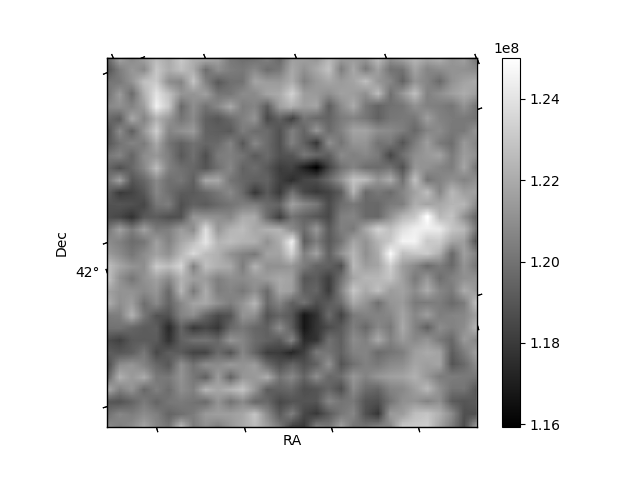
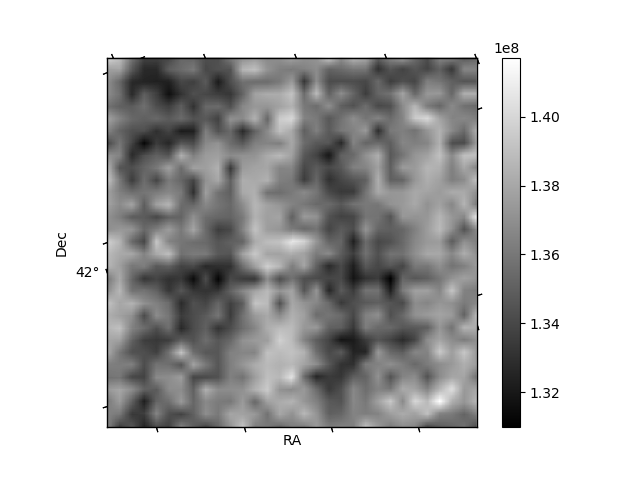
Histogram calculated using DETX and DETY for each event in the final _common_clean file
| Quadrant A | 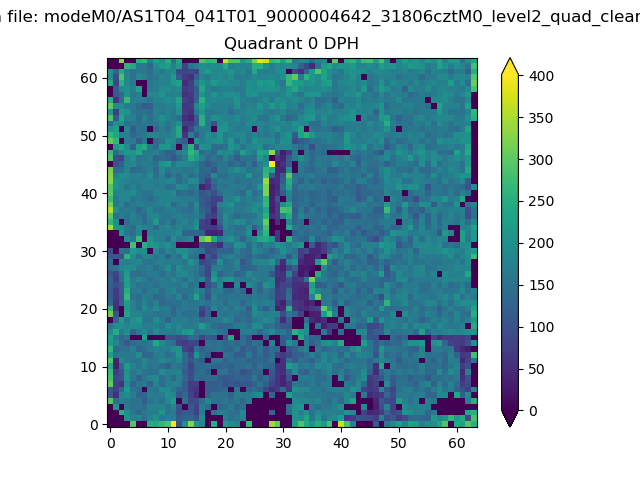 |
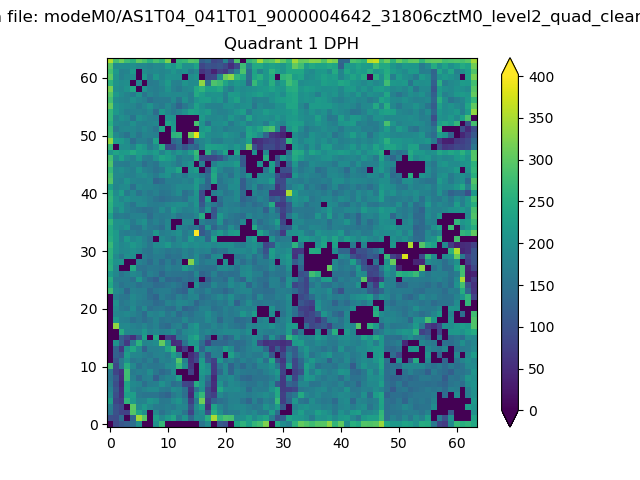 |
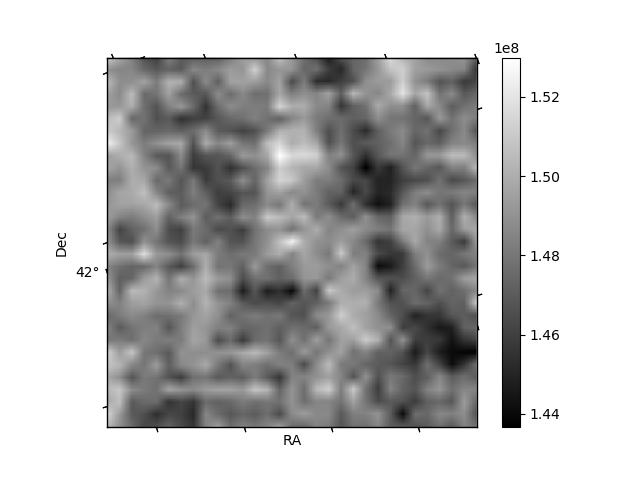
Quadrant B |
|---|---|---|---|
| Quadrant D | 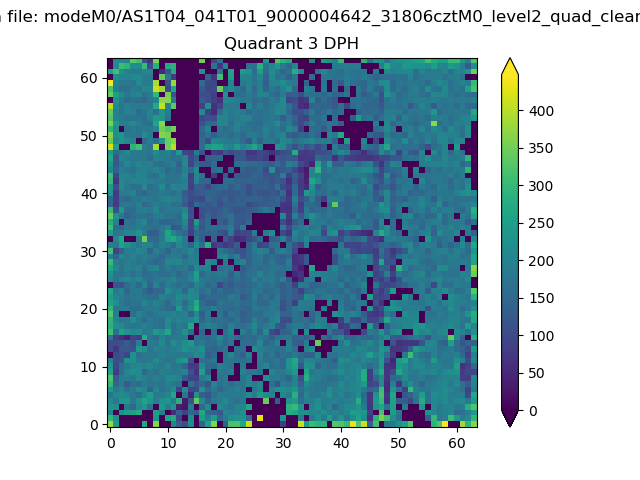 |
 |
Quadrant C |
| Plot type | Count rate plots | Images |
|---|---|---|
| Comparison with Poisson distribution Blue bars denote a histogram of data divided into 1 sec bins. Red curve is a Poisson curve with rate = median count rate of data. |
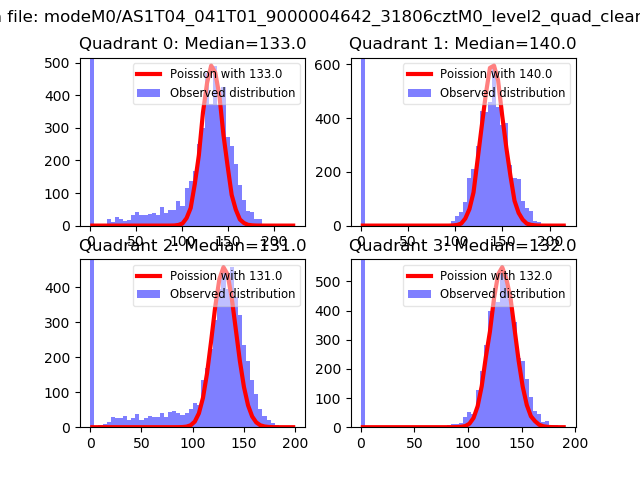 |
 |
| Quadrant-wise count rates Data is divided into 100 sec bins |
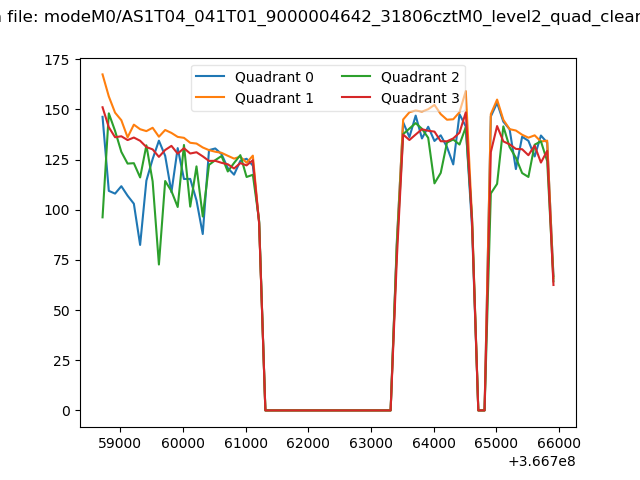 |
|
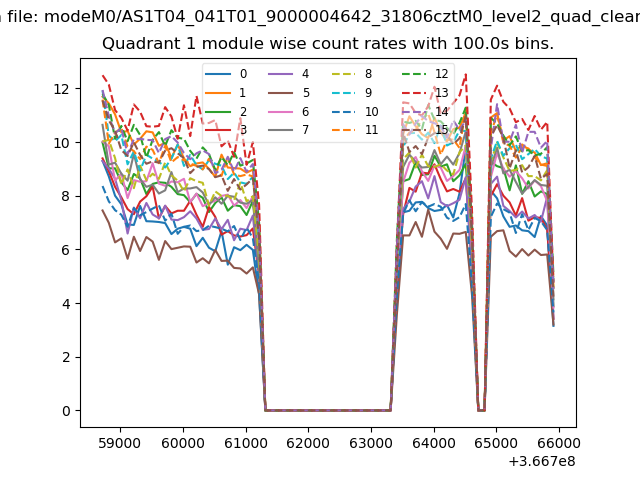
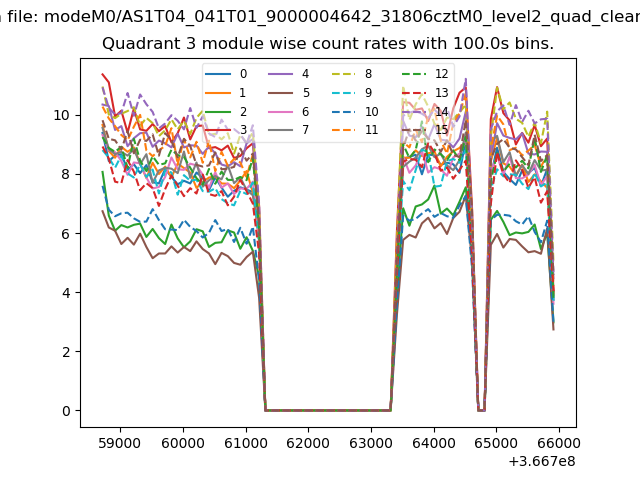
| Module-wise count rates for Quadrant A Data is divided into 100 sec bins |
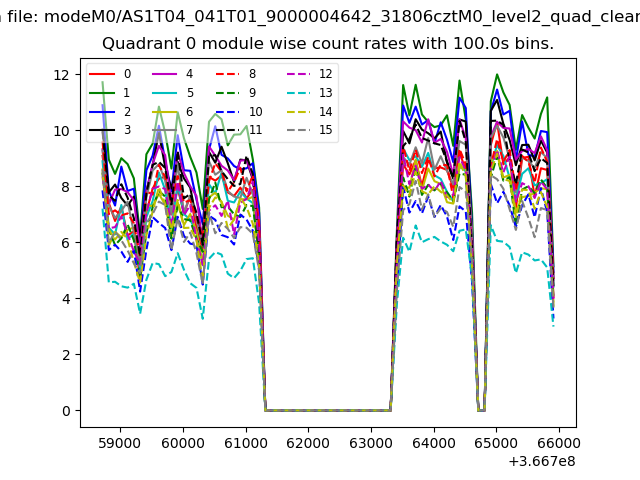 |
 |
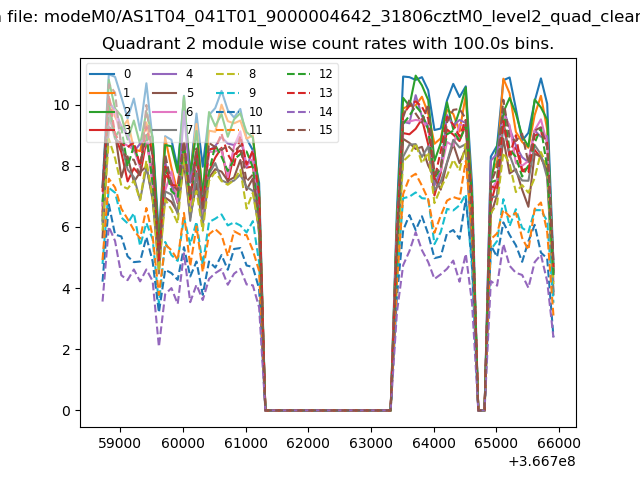
| Module-wise count rates for Quadrant B Data is divided into 100 sec bins |
 |
 |
| Module-wise count rates for Quadrant C Data is divided into 100 sec bins |
 |
 |
| Module-wise count rates for Quadrant D Data is divided into 100 sec bins |
 |
 |
| Parameter | Plot |
|---|---|
| CZT HV Monitor | 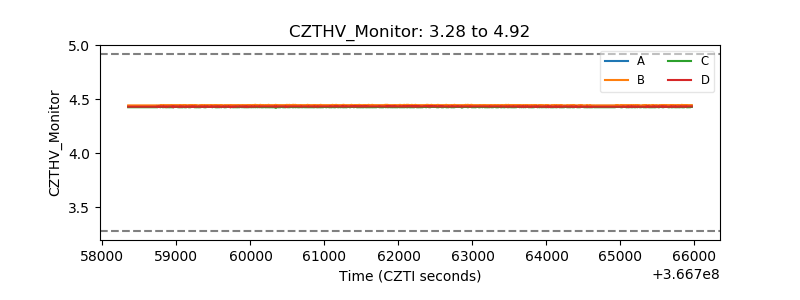 |
| D_VDD | 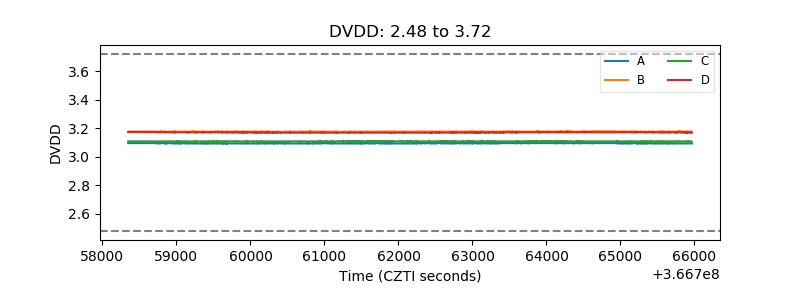 |
| Temperature 1 | 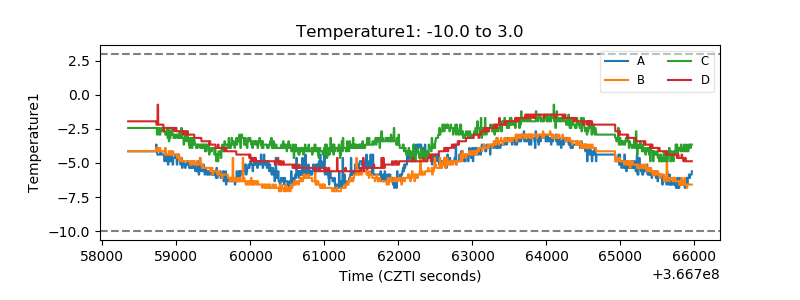 |
| Veto HV Monitor | 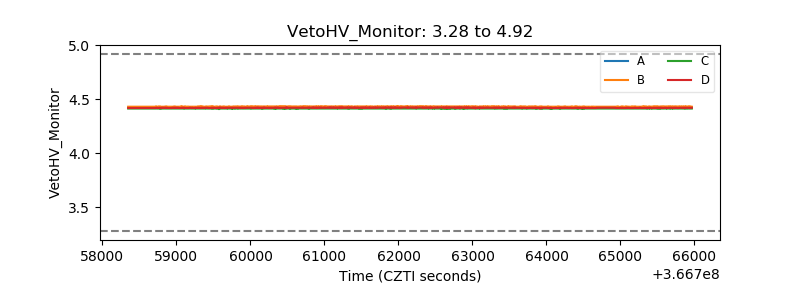 |
| Veto LLD | 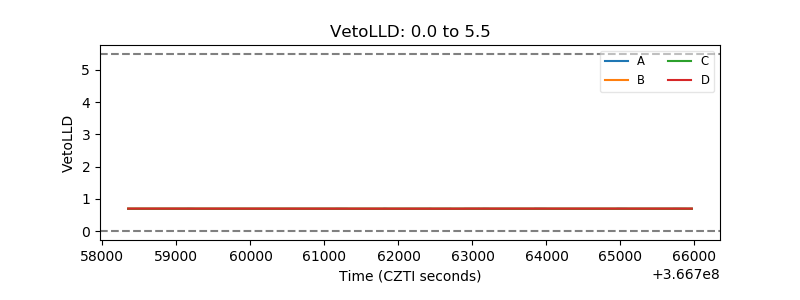 |
| Alpha Counter | 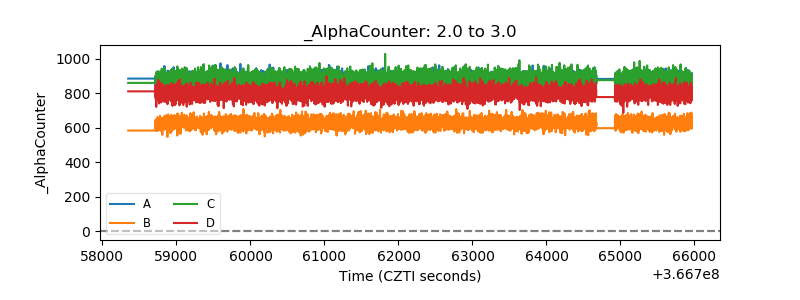 |
| _CPM_Rate | 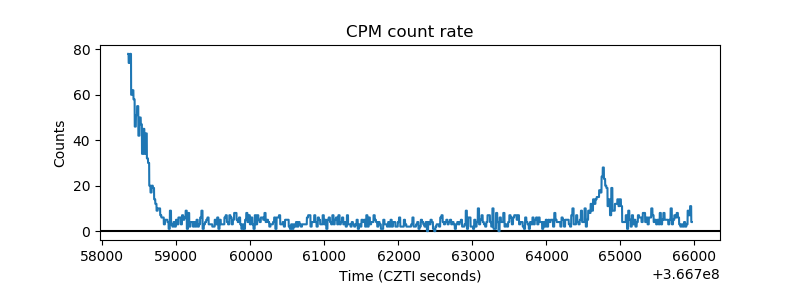 |
| CZT Counter | 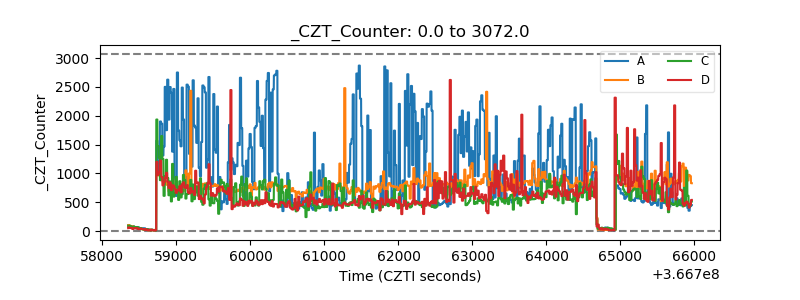 |
| +2.5 Volts monitor |  |
| +5 Volts monitor |  |
| _ROLL_ROT | 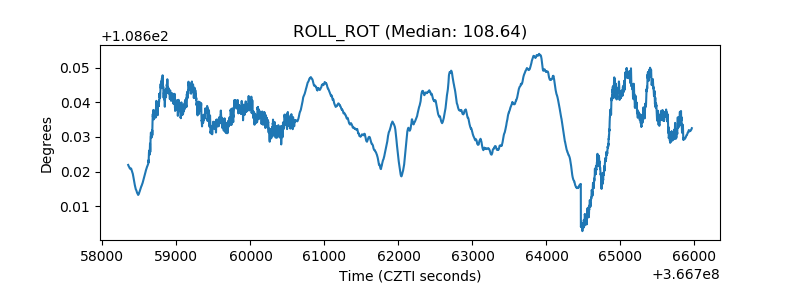 |
| _Roll_DEC | 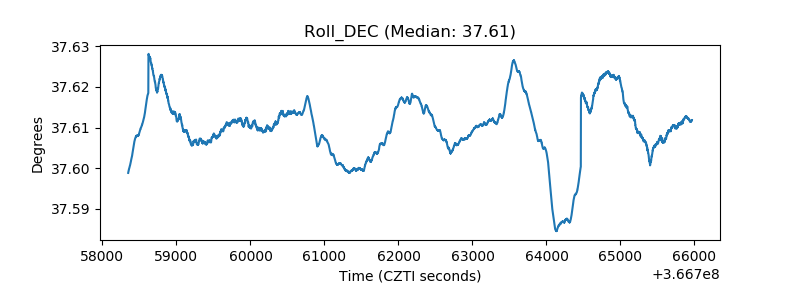 |
| _Roll_RA | 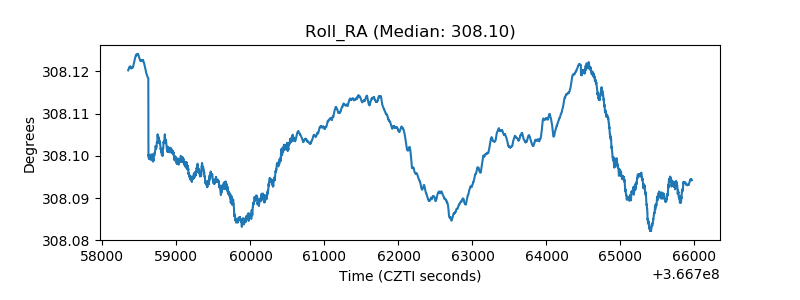 |
| Veto Counter | 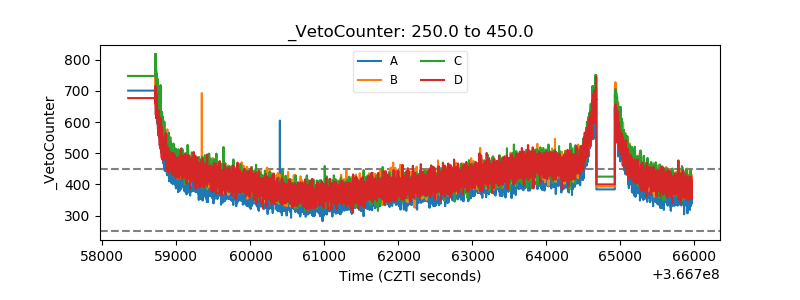 |