| Param | Original file | Final file |
|---|---|---|
| Filename | modeM0/AS1T04_037T01_9000004644_31810cztM0_level2.evt | modeM0/AS1T04_037T01_9000004644_31810cztM0_level2_quad_clean.evt |
| Size (bytes) | 1,709,478,720 | 205,283,520 |
| Size | 1.6 GB | 195.8 MB |
| Events in quadrant A | 13,880,242 | 1,259,113 |
| Events in quadrant B | 14,838,360 | 1,303,433 |
| Events in quadrant C | 9,437,658 | 1,274,002 |
| Events in quadrant D | 12,481,018 | 1,216,290 |
| Mode M9 | |||
|---|---|---|---|
| Quadrant | BADHDUFLAG | Total packets | Discarded packets |
| A | 0 | 13 | 0 |
| B | 0 | 13 | 0 |
| C | 0 | 13 | 0 |
| D | 0 | 13 | 0 |
| Mode M0 | |||
|---|---|---|---|
| Quadrant | BADHDUFLAG | Total packets | Discarded packets |
| A | 0 | 52190 | 3 |
| B | 0 | 56348 | 3 |
| C | 0 | 38422 | 3 |
| D | 0 | 48058 | 3 |
| Mode SS | |||
|---|---|---|---|
| Quadrant | BADHDUFLAG | Total packets | Discarded packets |
| A | 0 | 344 | 0 |
| B | 0 | 344 | 0 |
| C | 0 | 344 | 0 |
| D | 0 | 344 | 0 |
| Quadrant | Total seconds | Saturated seconds | Saturation percentage |
|---|---|---|---|
| A | 16868 | 2017 | 11.957553% |
| B | 16868 | 937 | 5.554897% |
| C | 16868 | 733 | 4.345506% |
| D | 16868 | 796 | 4.718995% |
Noise dominated data is calculated using 1-second bins in cleaned event files. If a bin has >2000 counts, and if more than 50% of those come from <1% of pixels, then it is considered to be noise-dominated and hence unusable.
| Quadrant | # 1 sec bins | Bins with >0 counts | Bins with >2000 counts | High rate bins dominated by noise | Noise dominated (total time) | Noise dominated (detector-on time) | Marked lightcurve |
|---|---|---|---|---|---|---|---|
| A | 18203 | 16871 | 1353 | 1353 | 7.43% | 8.02% | 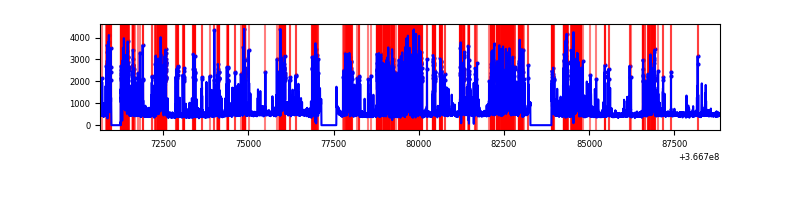 |
| B | 18203 | 16871 | 471 | 471 | 2.59% | 2.79% | 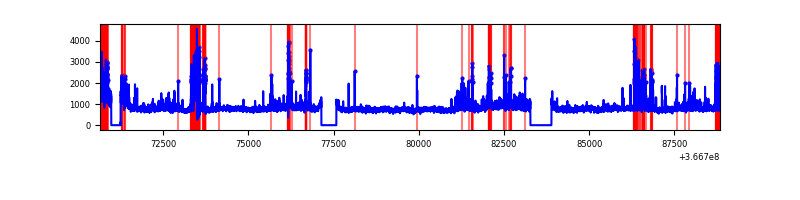 |
| C | 18203 | 16870 | 56 | 56 | 0.31% | 0.33% |  |
| D | 18203 | 16871 | 647 | 647 | 3.55% | 3.83% | 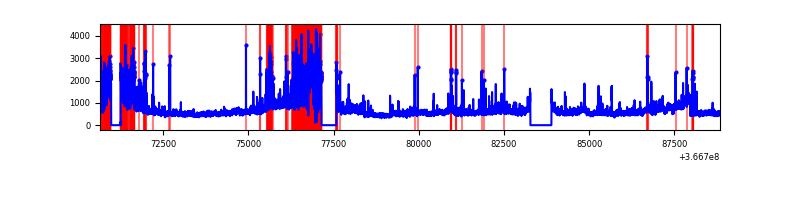 |
Top three noisy pixels from each quadrant. If the there are fewer than three noisy pixels in the level2.evt file, extra rows are filled as -1
| Pixel properties | Quadrant properties | ||||||
|---|---|---|---|---|---|---|---|
| Quadrant | DetID | PixID | Counts | Sigma | Mean | Median | Sigma |
| A | 0 | 13 | 6298549 | 15978.57 | 1960 | 1921 | 394.1 |
| A | 13 | 254 | 29990 | 71.23 | 1960 | 1921 | 394.1 |
| A | 13 | 6 | 21168 | 48.84 | 1960 | 1921 | 394.1 |
| B | 6 | 159 | 4567082 | 11768.18 | 2005 | 1954 | 387.9 |
| B | 10 | 245 | 1252619 | 3224.02 | 2005 | 1954 | 387.9 |
| B | 4 | 80 | 702869 | 1806.85 | 2005 | 1954 | 387.9 |
| C | 0 | 10 | 1012729 | 2207.86 | 1944 | 1959 | 457.8 |
| C | 14 | 238 | 471978 | 1026.68 | 1944 | 1959 | 457.8 |
| C | 14 | 254 | 221286 | 479.08 | 1944 | 1959 | 457.8 |
| D | 8 | 195 | 2657240 | 5645.12 | 1949 | 1897 | 470.4 |
| D | 12 | 218 | 1826412 | 3878.82 | 1949 | 1897 | 470.4 |
| D | 12 | 233 | 228555 | 481.86 | 1949 | 1897 | 470.4 |
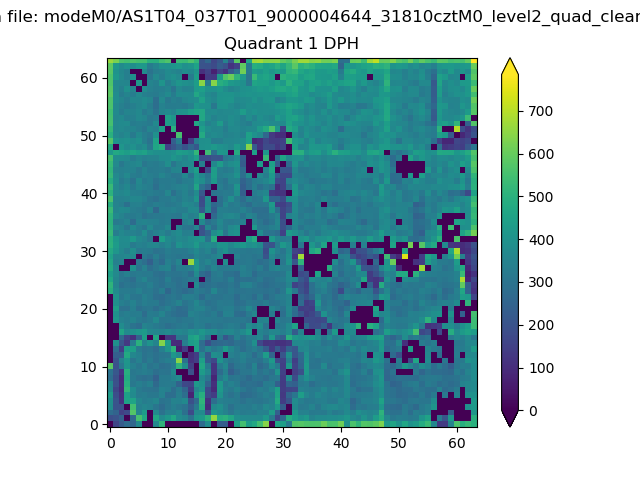
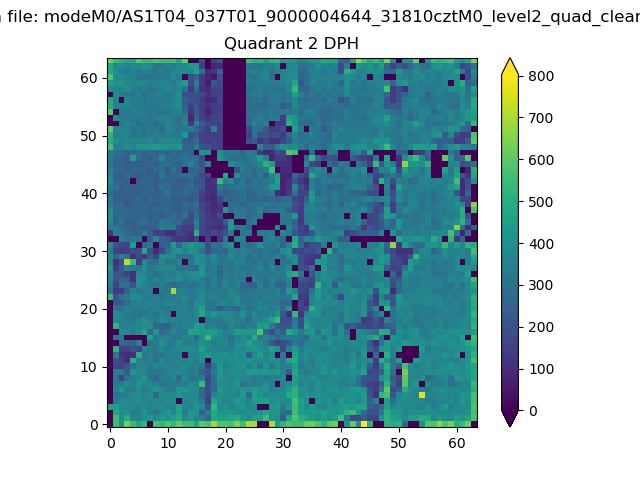
Histogram calculated using DETX and DETY for each event in the final _common_clean file
| Quadrant A | 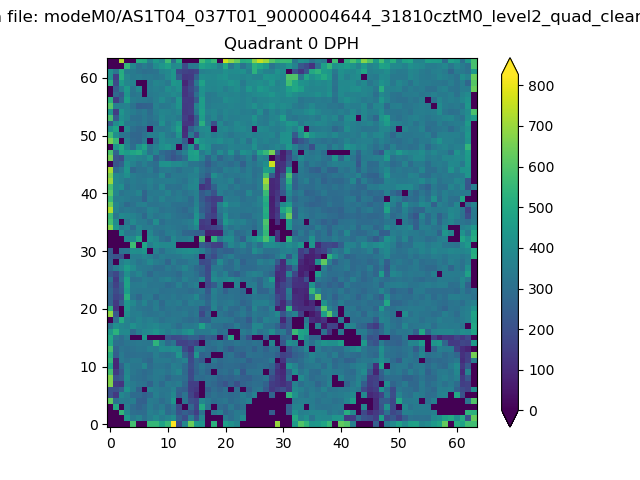 |
 |
Quadrant B |
|---|---|---|---|
| Quadrant D | 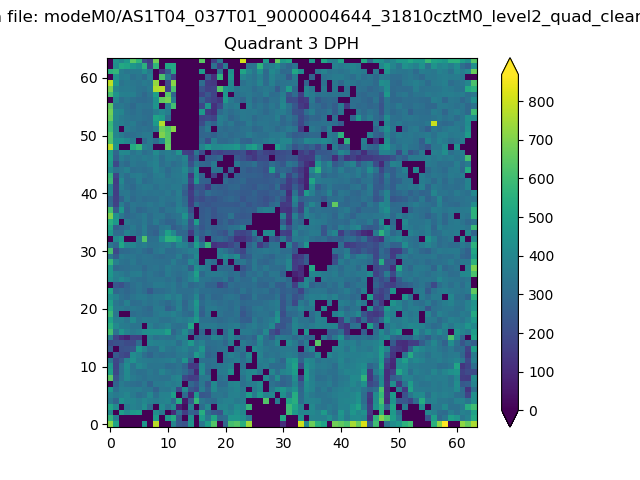 |
 |
Quadrant C |
| Plot type | Count rate plots | Images |
|---|---|---|
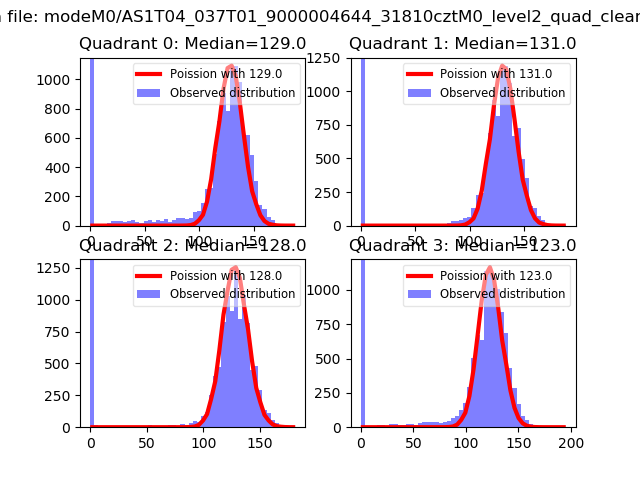
| Comparison with Poisson distribution Blue bars denote a histogram of data divided into 1 sec bins. Red curve is a Poisson curve with rate = median count rate of data. |
 |
 |
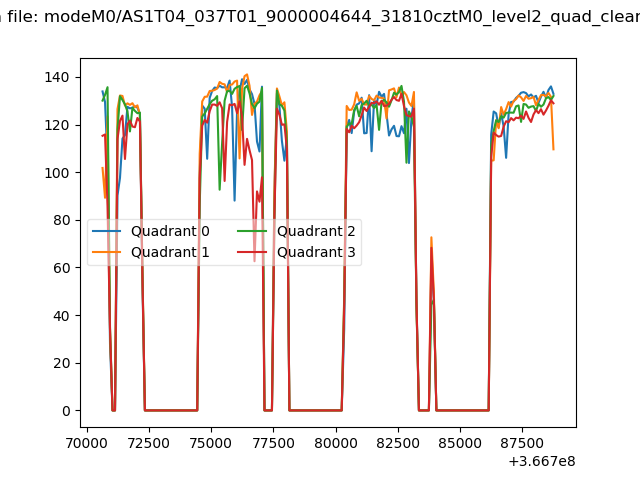
| Quadrant-wise count rates Data is divided into 100 sec bins |
 |
|
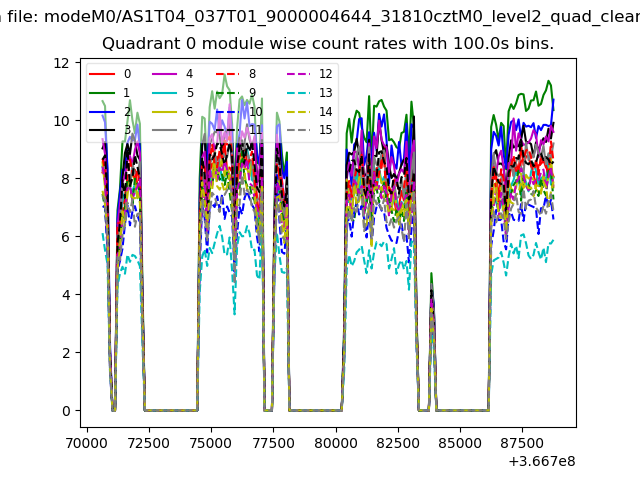
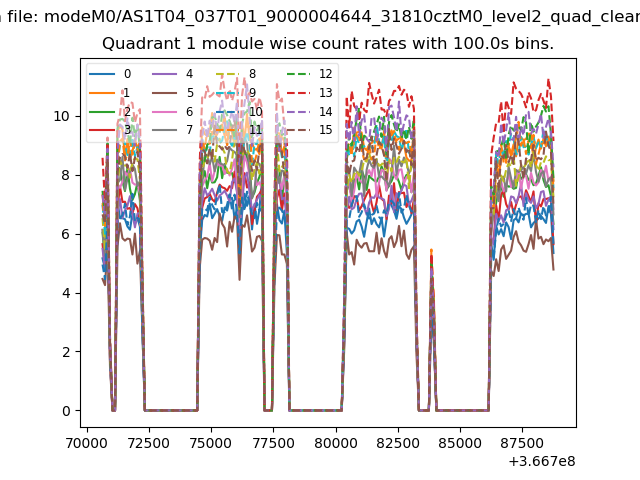
| Module-wise count rates for Quadrant A Data is divided into 100 sec bins |
 |
 |
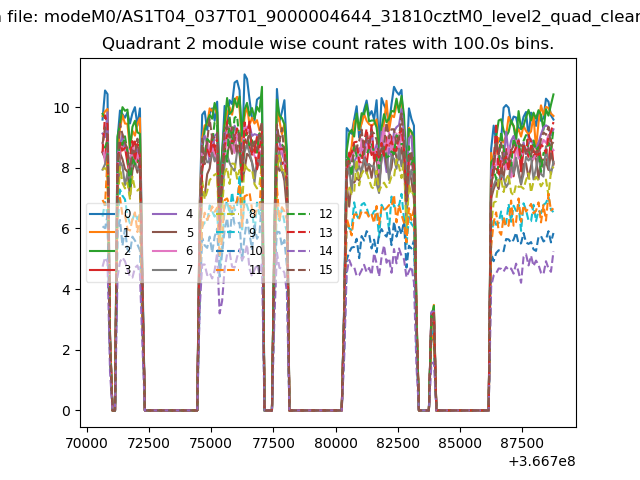
| Module-wise count rates for Quadrant B Data is divided into 100 sec bins |
 |
 |
| Module-wise count rates for Quadrant C Data is divided into 100 sec bins |
 |
 |
| Module-wise count rates for Quadrant D Data is divided into 100 sec bins |
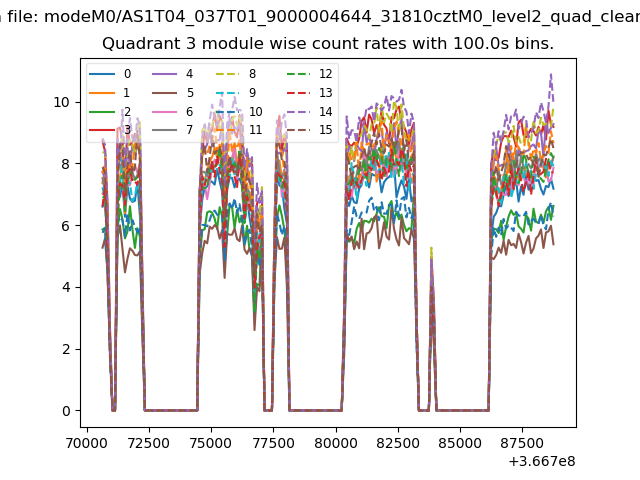 |
 |
| Parameter | Plot |
|---|---|
| CZT HV Monitor | 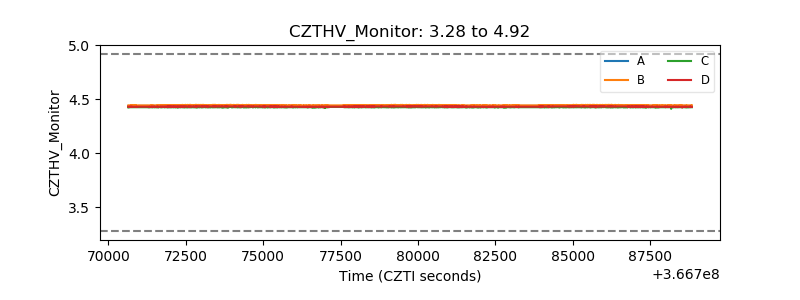 |
| D_VDD | 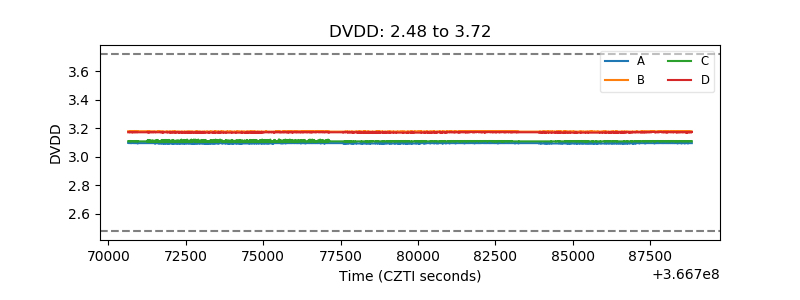 |
| Temperature 1 | 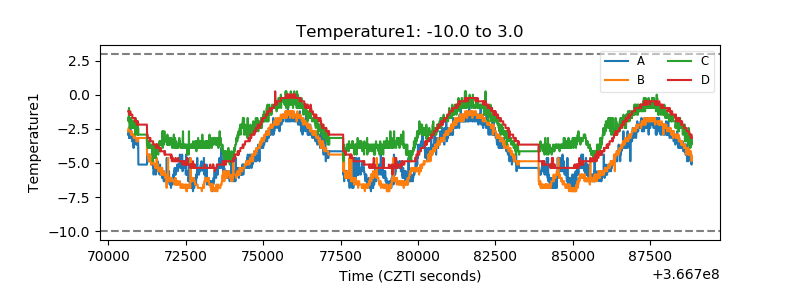 |
| Veto HV Monitor | 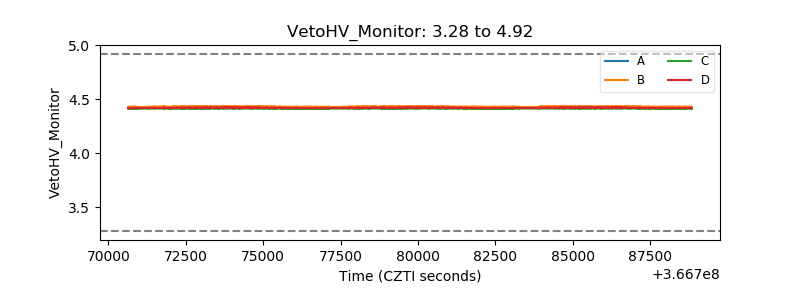 |
| Veto LLD | 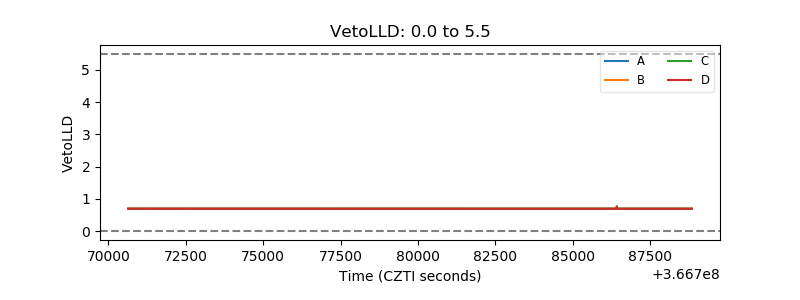 |
| Alpha Counter | 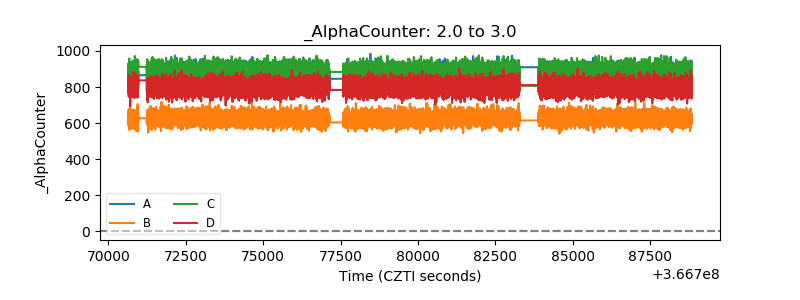 |
| _CPM_Rate | 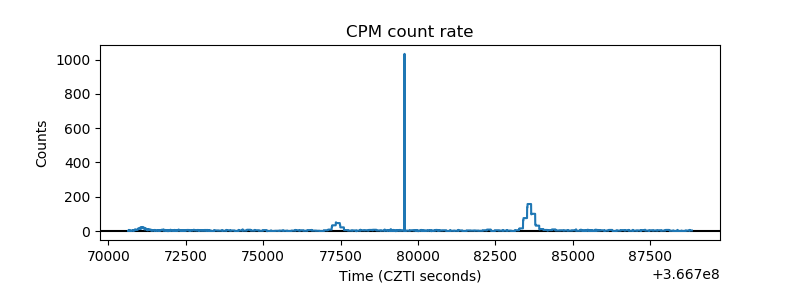 |
| CZT Counter | 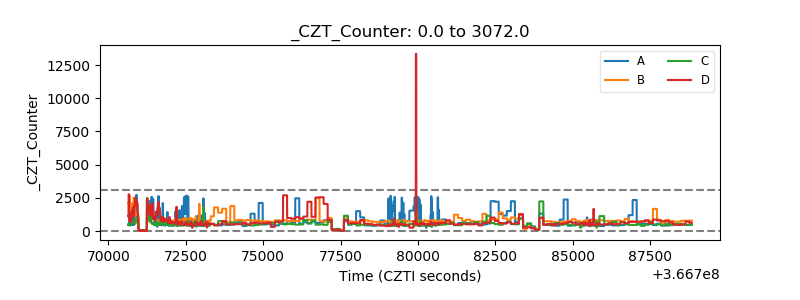 |
| +2.5 Volts monitor |  |
| +5 Volts monitor |  |
| _ROLL_ROT | 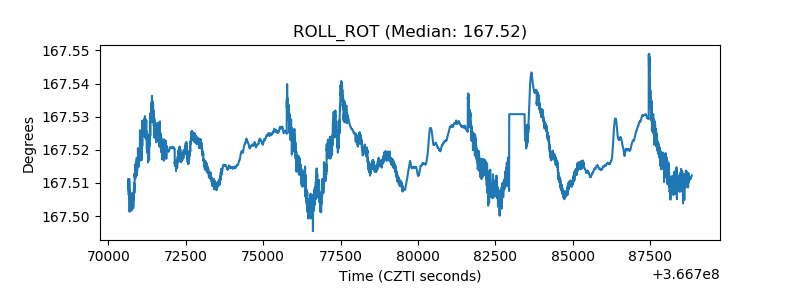 |
| _Roll_DEC | 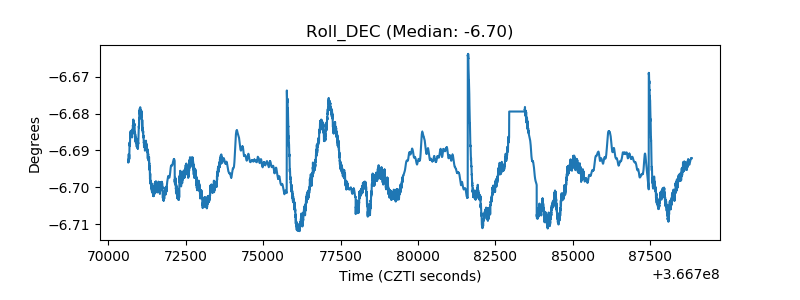 |
| _Roll_RA | 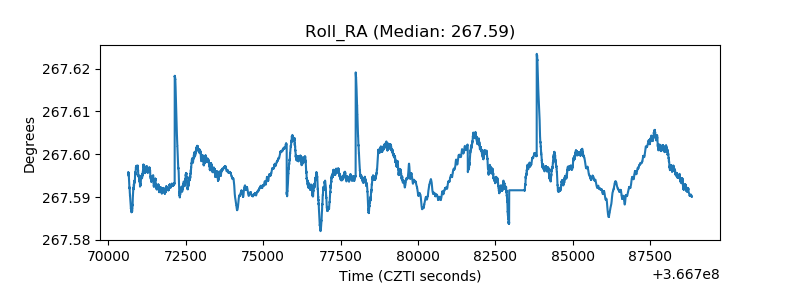 |
| Veto Counter |  |