| Param | Original file | Final file |
|---|---|---|
| Filename | modeM0/AS1A10_109T01_9000004646_31810cztM0_level2.evt | modeM0/AS1A10_109T01_9000004646_31810cztM0_level2_quad_clean.evt |
| Size (bytes) | 141,220,800 | 6,664,320 |
| Size | 134.7 MB | 6.4 MB |
| Events in quadrant A | 897,155 | 25,077 |
| Events in quadrant B | 1,199,165 | 25,736 |
| Events in quadrant C | 867,414 | 19,563 |
| Events in quadrant D | 1,213,750 | 24,266 |
| Mode SS | |||
|---|---|---|---|
| Quadrant | BADHDUFLAG | Total packets | Discarded packets |
| A | 0 | 28 | 0 |
| B | 0 | 28 | 0 |
| C | 0 | 28 | 0 |
| D | 0 | 28 | 0 |
| Mode M0 | |||
|---|---|---|---|
| Quadrant | BADHDUFLAG | Total packets | Discarded packets |
| A | 0 | 3543 | 1 |
| B | 0 | 4553 | 1 |
| C | 0 | 3426 | 1 |
| D | 0 | 4669 | 1 |
| Mode M9 | |||
|---|---|---|---|
| Quadrant | BADHDUFLAG | Total packets | Discarded packets |
| A | 0 | 6 | 0 |
| B | 0 | 6 | 0 |
| C | 0 | 6 | 0 |
| D | 0 | 6 | 0 |
| Quadrant | Total seconds | Saturated seconds | Saturation percentage |
|---|---|---|---|
| A | 1430 | 44 | 3.076923% |
| B | 1429 | 41 | 2.869139% |
| C | 1429 | 101 | 7.067880% |
| D | 1429 | 39 | 2.729181% |
Noise dominated data is calculated using 1-second bins in cleaned event files. If a bin has >2000 counts, and if more than 50% of those come from <1% of pixels, then it is considered to be noise-dominated and hence unusable.
| Quadrant | # 1 sec bins | Bins with >0 counts | Bins with >2000 counts | High rate bins dominated by noise | Noise dominated (total time) | Noise dominated (detector-on time) | Marked lightcurve |
|---|---|---|---|---|---|---|---|
| A | 1430 | 1430 | 27 | 27 | 1.89% | 1.89% | 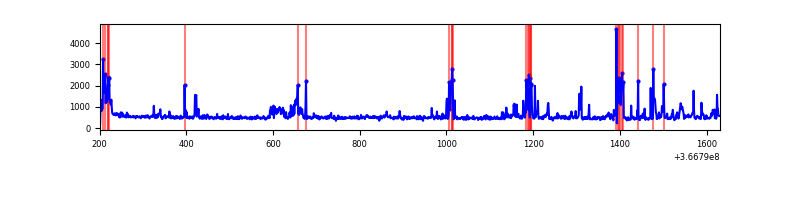 |
| B | 1429 | 1429 | 10 | 10 | 0.70% | 0.70% | 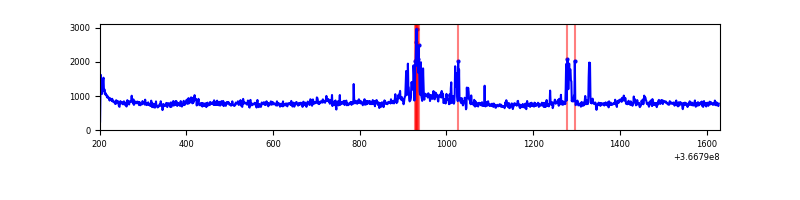 |
| C | 1429 | 1429 | 39 | 39 | 2.73% | 2.73% | 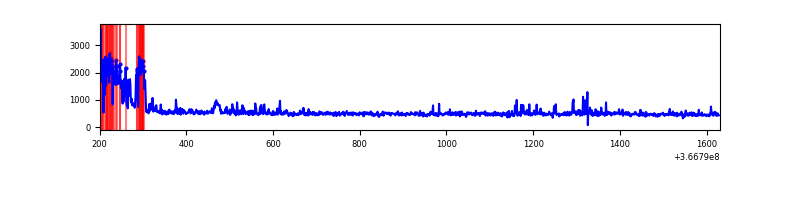 |
| D | 1429 | 1429 | 34 | 34 | 2.38% | 2.38% | 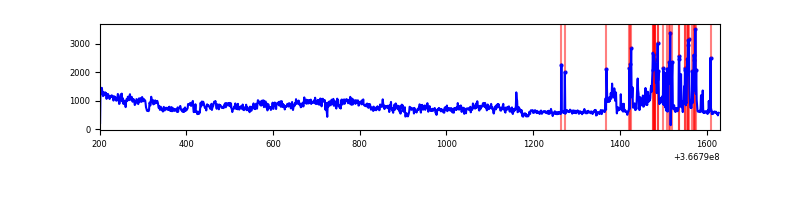 |
Top three noisy pixels from each quadrant. If the there are fewer than three noisy pixels in the level2.evt file, extra rows are filled as -1
| Pixel properties | Quadrant properties | ||||||
|---|---|---|---|---|---|---|---|
| Quadrant | DetID | PixID | Counts | Sigma | Mean | Median | Sigma |
| A | 0 | 13 | 206219 | 5426.11 | 178 | 175 | 38.0 |
| A | 13 | 254 | 2599 | 63.84 | 178 | 175 | 38.0 |
| A | 13 | 6 | 2089 | 50.4 | 178 | 175 | 38.0 |
| B | 6 | 159 | 387748 | 10522.37 | 179 | 175 | 36.8 |
| B | 10 | 245 | 96487 | 2614.81 | 179 | 175 | 36.8 |
| B | 12 | 111 | 4566 | 119.21 | 179 | 175 | 36.8 |
| C | 0 | 10 | 161103 | 3953.94 | 165 | 165 | 40.7 |
| C | 14 | 238 | 36511 | 892.95 | 165 | 165 | 40.7 |
| C | 14 | 254 | 13225 | 320.86 | 165 | 165 | 40.7 |
| D | 8 | 195 | 438439 | 10332.27 | 168 | 162 | 42.4 |
| D | 12 | 218 | 119197 | 2806.22 | 168 | 162 | 42.4 |
| D | 12 | 250 | 8520 | 197.04 | 168 | 162 | 42.4 |
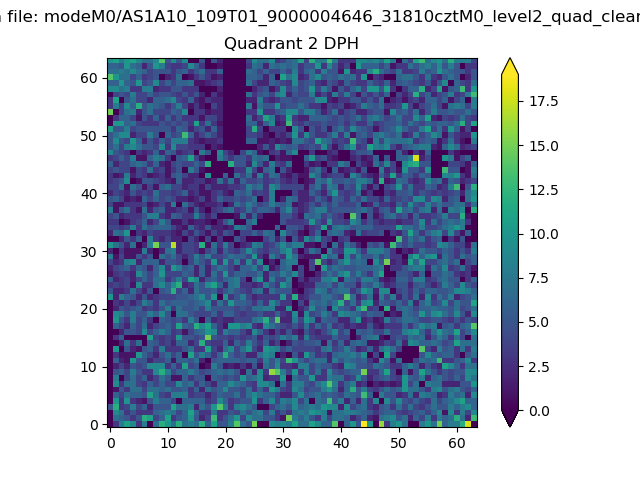
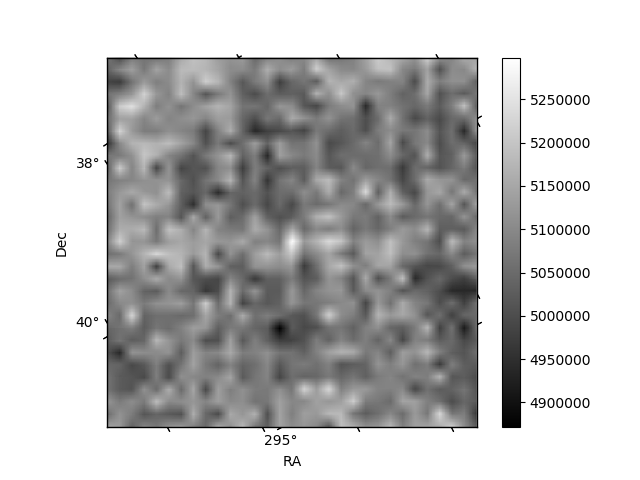
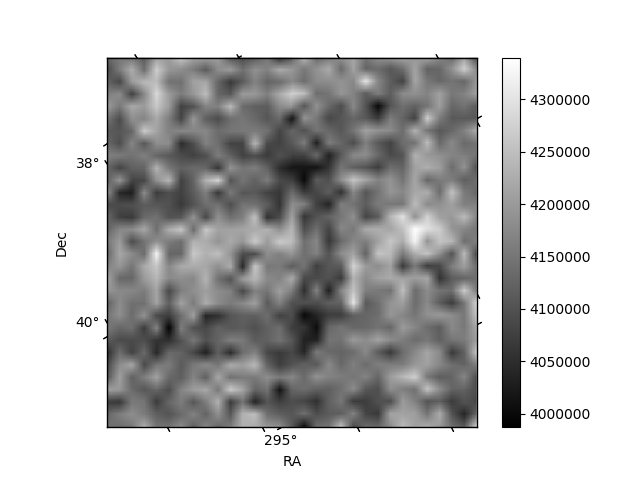
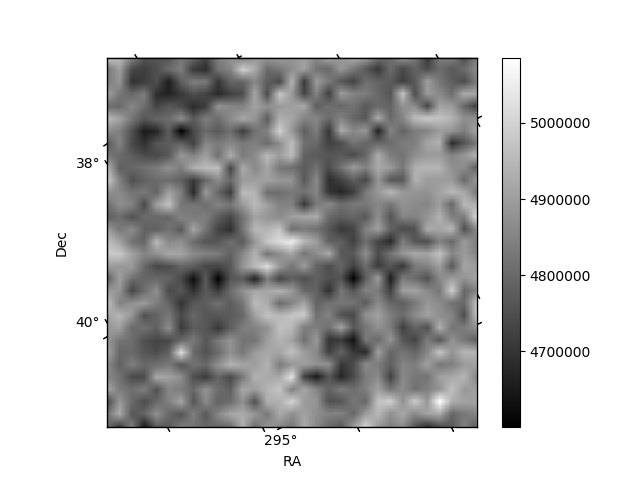
Histogram calculated using DETX and DETY for each event in the final _common_clean file
| Quadrant A | 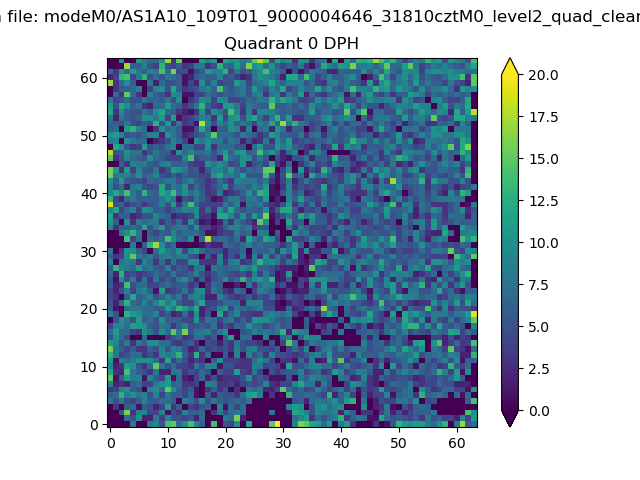 |
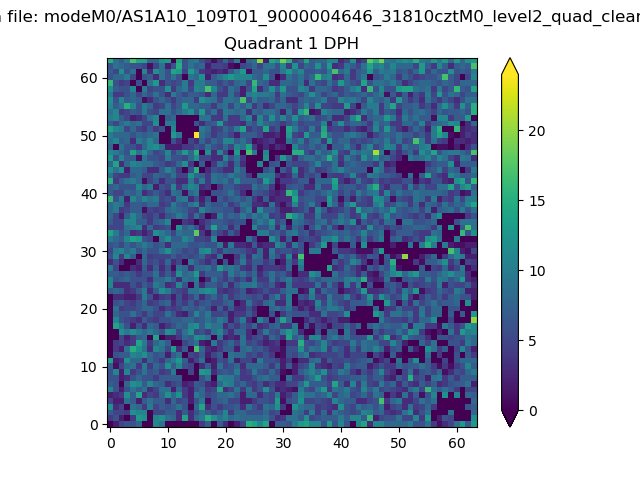 |
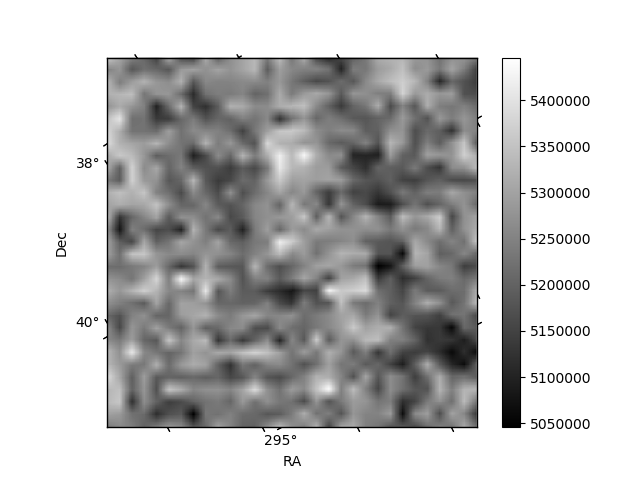
Quadrant B |
|---|---|---|---|
| Quadrant D | 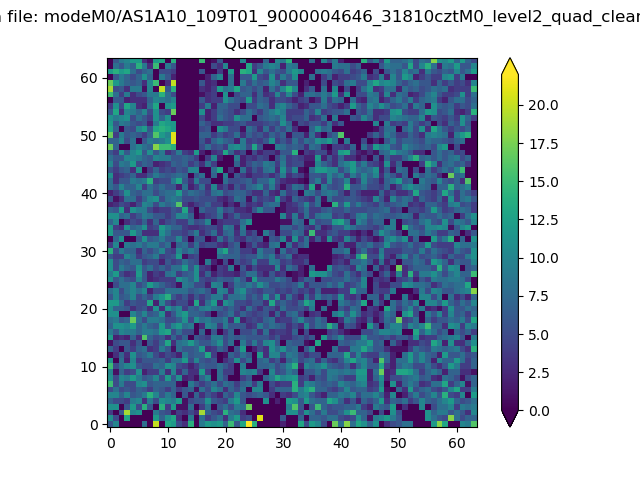 |
 |
Quadrant C |
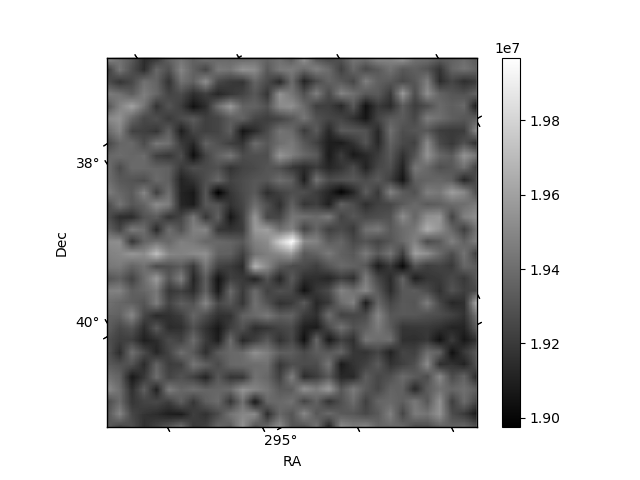
| Plot type | Count rate plots | Images |
|---|---|---|
| Comparison with Poisson distribution Blue bars denote a histogram of data divided into 1 sec bins. Red curve is a Poisson curve with rate = median count rate of data. |
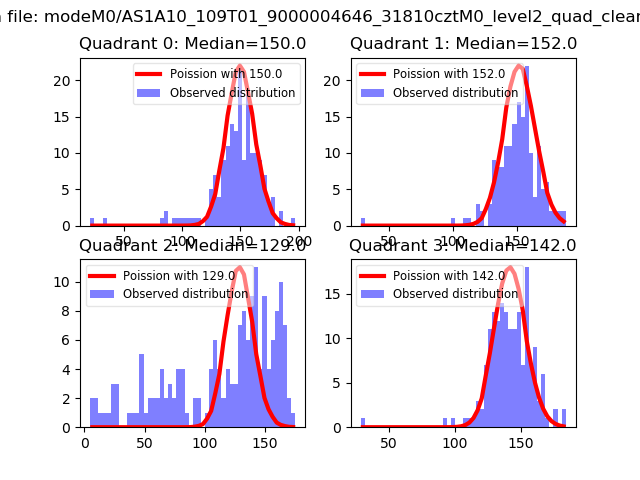 |
 |
| Quadrant-wise count rates Data is divided into 100 sec bins |
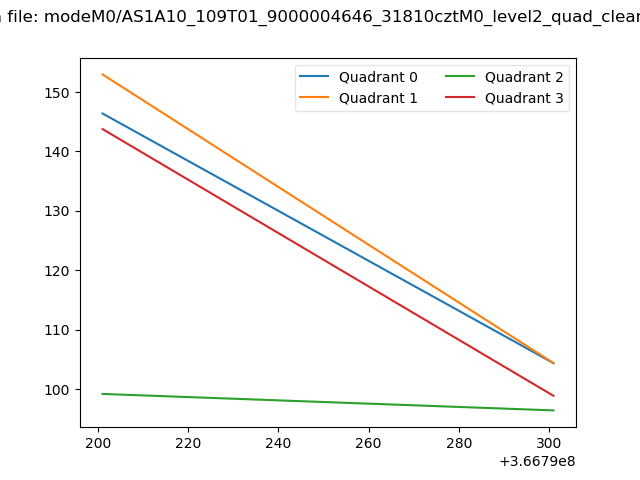 |
|
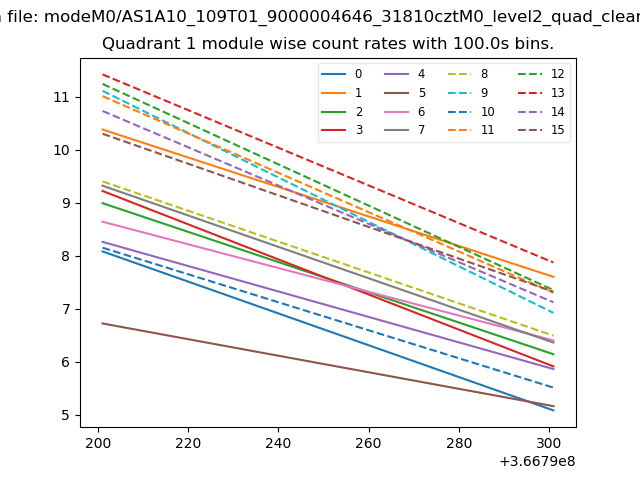
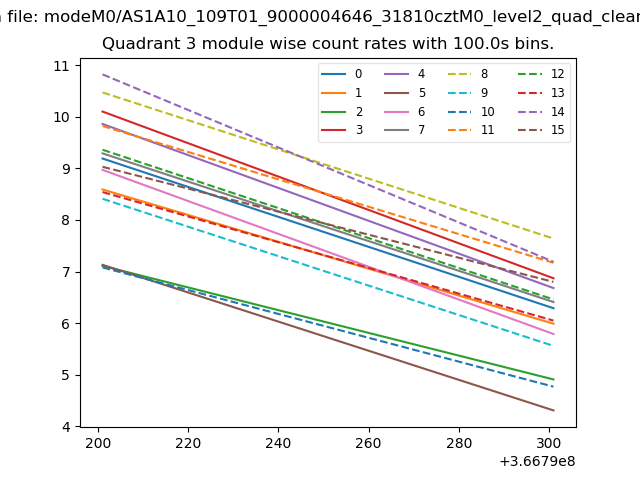
| Module-wise count rates for Quadrant A Data is divided into 100 sec bins |
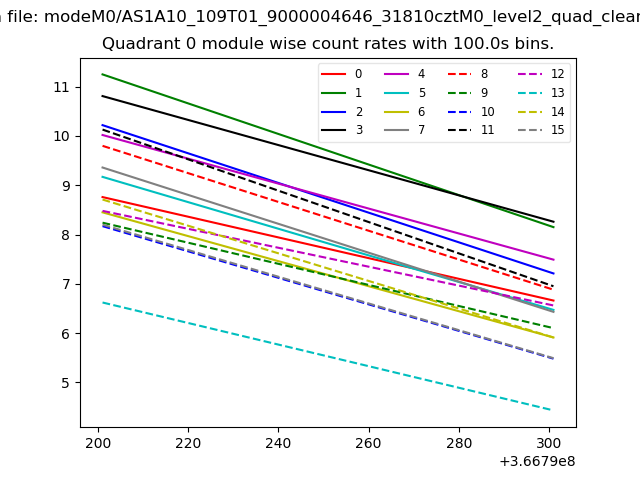 |
 |
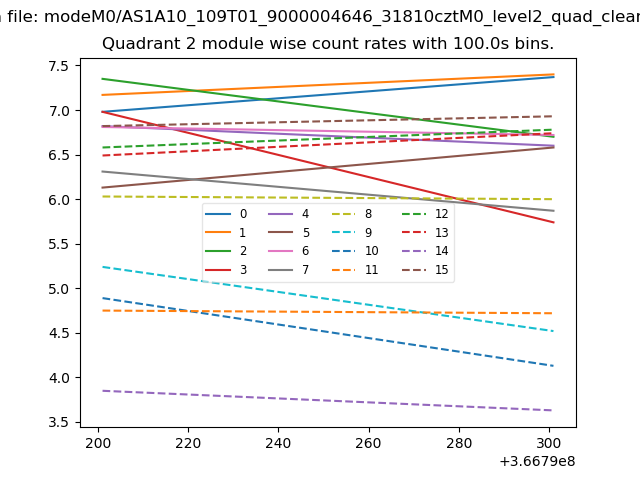
| Module-wise count rates for Quadrant B Data is divided into 100 sec bins |
 |
 |
| Module-wise count rates for Quadrant C Data is divided into 100 sec bins |
 |
 |
| Module-wise count rates for Quadrant D Data is divided into 100 sec bins |
 |
 |
| Parameter | Plot |
|---|---|
| CZT HV Monitor | 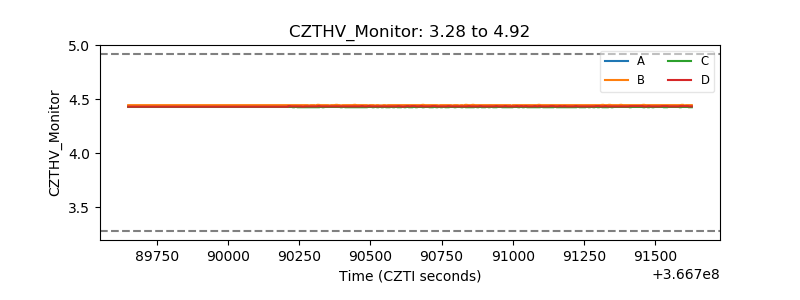 |
| D_VDD | 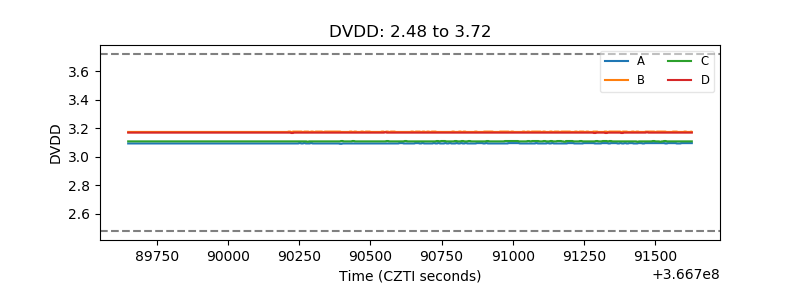 |
| Temperature 1 | 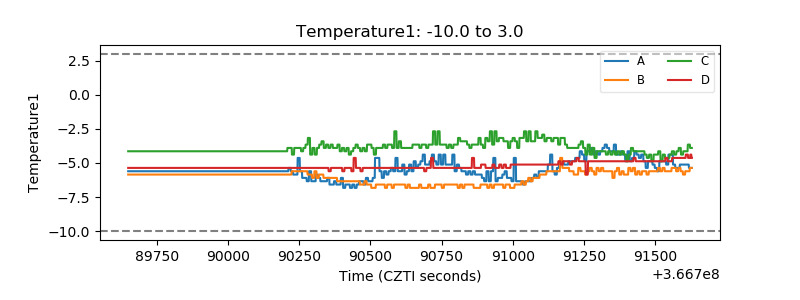 |
| Veto HV Monitor | 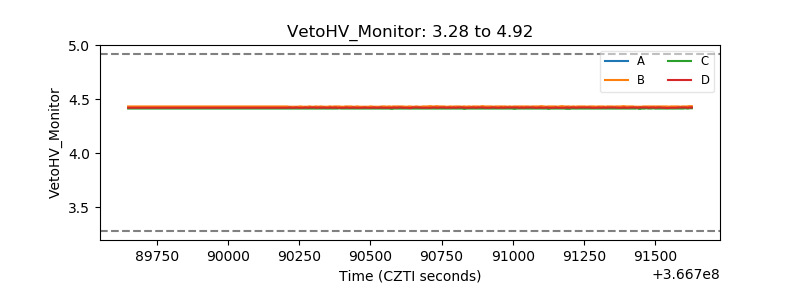 |
| Veto LLD | 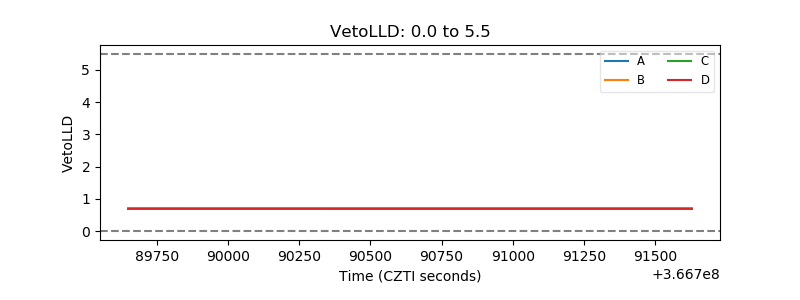 |
| Alpha Counter | 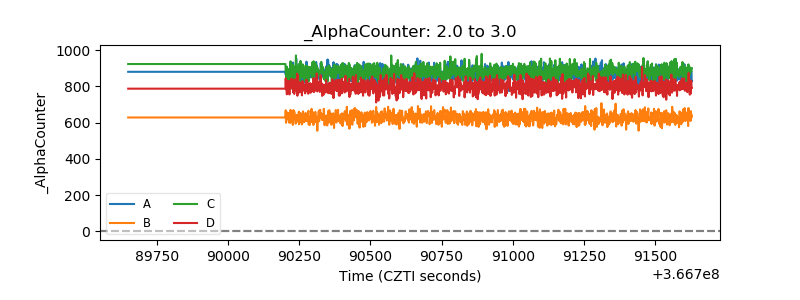 |
| _CPM_Rate | 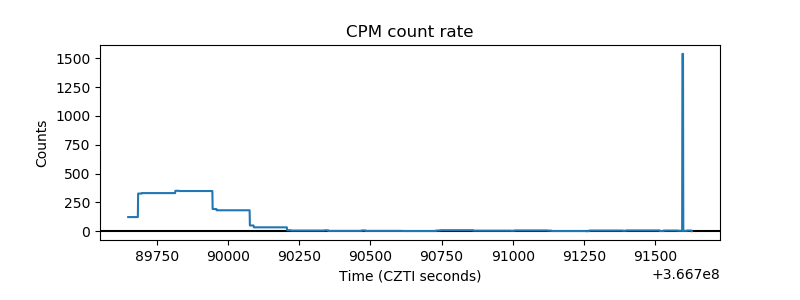 |
| CZT Counter | 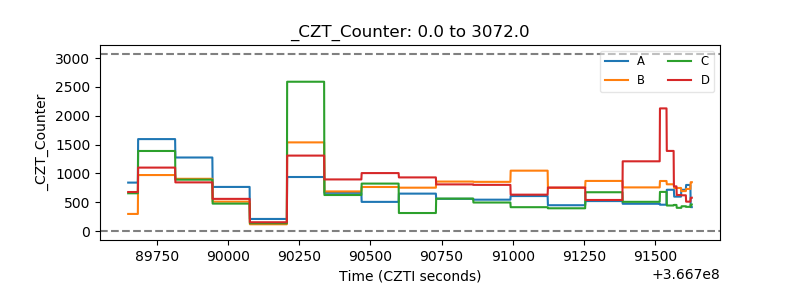 |
| +2.5 Volts monitor | 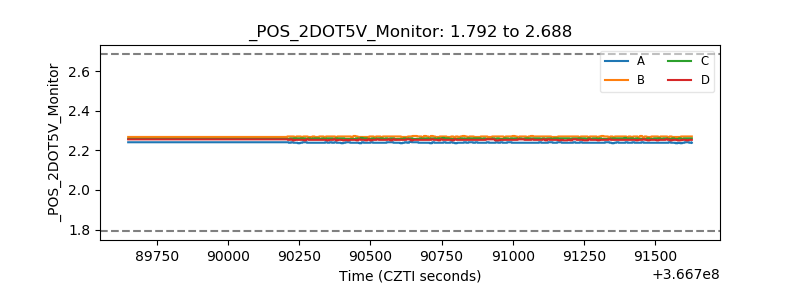 |
| +5 Volts monitor | 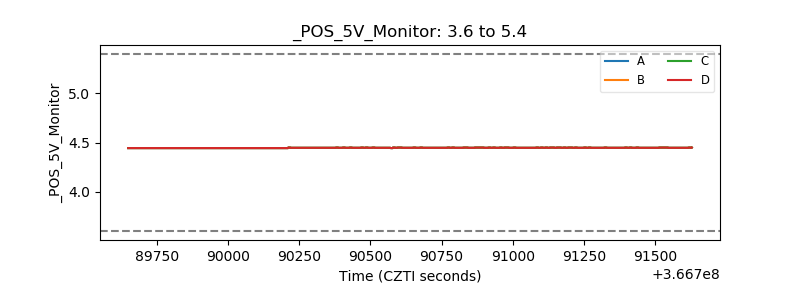 |
| _ROLL_ROT | 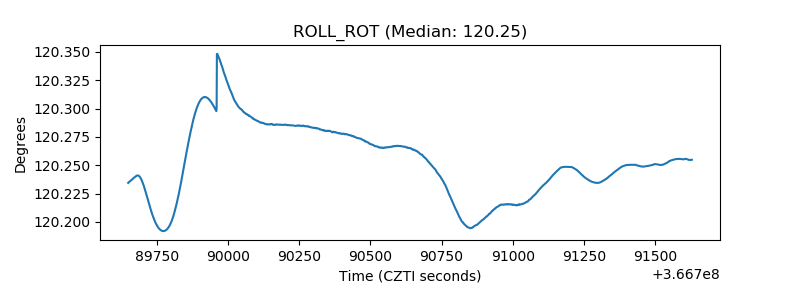 |
| _Roll_DEC | 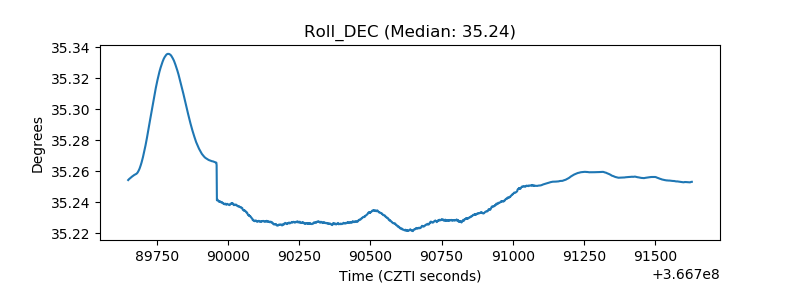 |
| _Roll_RA | 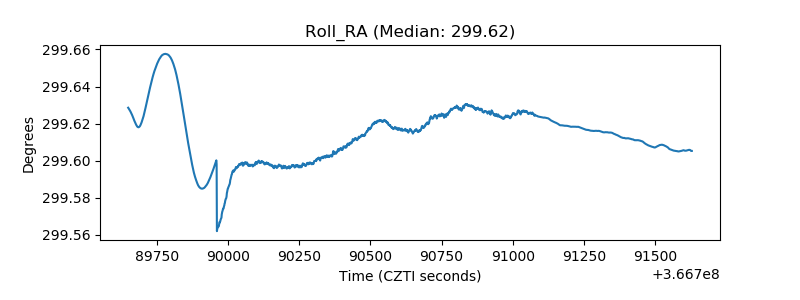 |
| Veto Counter | 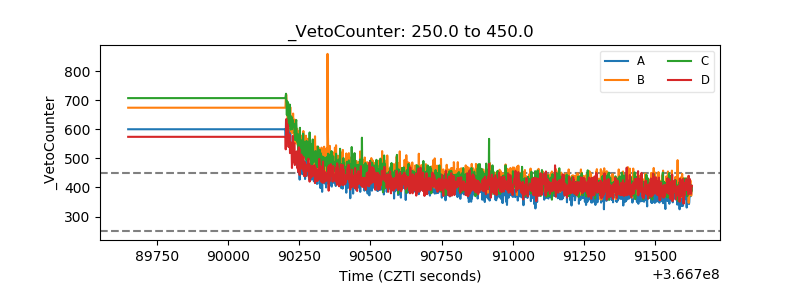 |