| Param | Original file | Final file |
|---|---|---|
| Filename | modeM0/AS1A10_109T01_9000004646_31813cztM0_level2.evt | modeM0/AS1A10_109T01_9000004646_31813cztM0_level2_quad_clean.evt |
| Size (bytes) | 714,003,840 | 75,352,320 |
| Size | 680.9 MB | 71.9 MB |
| Events in quadrant A | 7,237,092 | 409,793 |
| Events in quadrant B | 5,807,987 | 485,321 |
| Events in quadrant C | 4,057,162 | 468,509 |
| Events in quadrant D | 4,078,962 | 460,700 |
| Mode SS | |||
|---|---|---|---|
| Quadrant | BADHDUFLAG | Total packets | Discarded packets |
| A | 0 | 134 | 0 |
| B | 0 | 134 | 0 |
| C | 0 | 134 | 0 |
| D | 0 | 134 | 0 |
| Mode M0 | |||
|---|---|---|---|
| Quadrant | BADHDUFLAG | Total packets | Discarded packets |
| A | 0 | 25744 | 2 |
| B | 0 | 21961 | 2 |
| C | 0 | 16137 | 2 |
| D | 0 | 16436 | 2 |
| Mode M9 | |||
|---|---|---|---|
| Quadrant | BADHDUFLAG | Total packets | Discarded packets |
| A | 0 | 20 | 0 |
| B | 0 | 20 | 0 |
| C | 0 | 20 | 0 |
| D | 0 | 20 | 0 |
| Quadrant | Total seconds | Saturated seconds | Saturation percentage |
|---|---|---|---|
| A | 6554 | 1585 | 24.183705% |
| B | 6555 | 329 | 5.019069% |
| C | 6555 | 348 | 5.308924% |
| D | 6555 | 110 | 1.678108% |
Noise dominated data is calculated using 1-second bins in cleaned event files. If a bin has >2000 counts, and if more than 50% of those come from <1% of pixels, then it is considered to be noise-dominated and hence unusable.
| Quadrant | # 1 sec bins | Bins with >0 counts | Bins with >2000 counts | High rate bins dominated by noise | Noise dominated (total time) | Noise dominated (detector-on time) | Marked lightcurve |
|---|---|---|---|---|---|---|---|
| A | 8544 | 6556 | 1067 | 1067 | 12.49% | 16.28% | 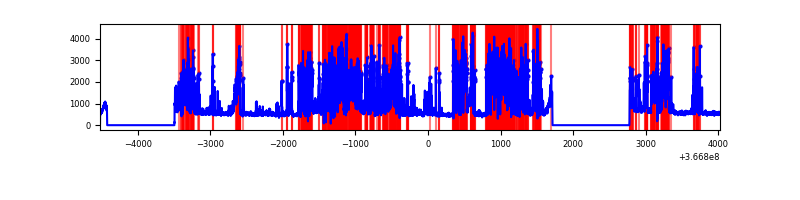 |
| B | 8545 | 6557 | 54 | 54 | 0.63% | 0.82% | 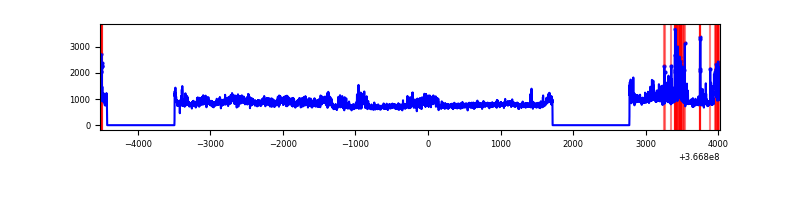 |
| C | 8545 | 6557 | 93 | 93 | 1.09% | 1.42% | 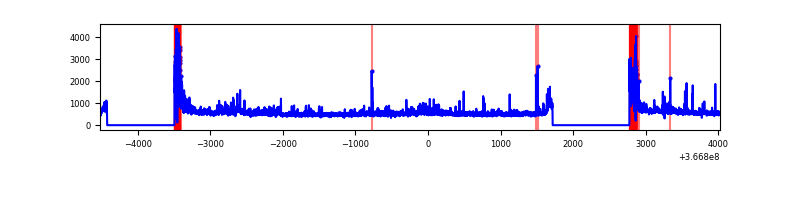 |
| D | 8545 | 6557 | 19 | 19 | 0.22% | 0.29% | 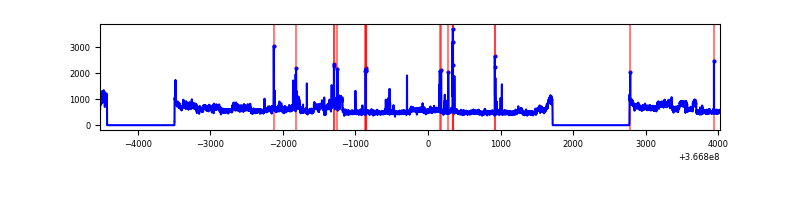 |
Top three noisy pixels from each quadrant. If the there are fewer than three noisy pixels in the level2.evt file, extra rows are filled as -1
| Pixel properties | Quadrant properties | ||||||
|---|---|---|---|---|---|---|---|
| Quadrant | DetID | PixID | Counts | Sigma | Mean | Median | Sigma |
| A | 0 | 13 | 4147983 | 26017.8 | 797 | 781 | 159.4 |
| A | 13 | 6 | 12055 | 70.73 | 797 | 781 | 159.4 |
| A | 13 | 254 | 10953 | 63.81 | 797 | 781 | 159.4 |
| B | 6 | 159 | 1719559 | 10508.73 | 858 | 838 | 163.6 |
| B | 4 | 80 | 390291 | 2381.22 | 858 | 838 | 163.6 |
| B | 10 | 245 | 320831 | 1956.53 | 858 | 838 | 163.6 |
| C | 0 | 10 | 585803 | 3042.28 | 817 | 820 | 192.3 |
| C | 14 | 238 | 146246 | 756.31 | 817 | 820 | 192.3 |
| C | 3 | 233 | 80100 | 412.31 | 817 | 820 | 192.3 |
| D | 8 | 195 | 790394 | 3926.63 | 844 | 825 | 201.1 |
| D | 2 | 250 | 40354 | 196.58 | 844 | 825 | 201.1 |
| D | 5 | 243 | 38487 | 187.3 | 844 | 825 | 201.1 |
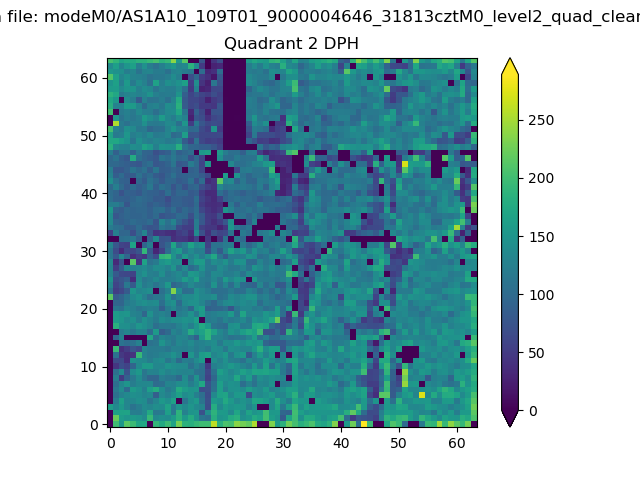
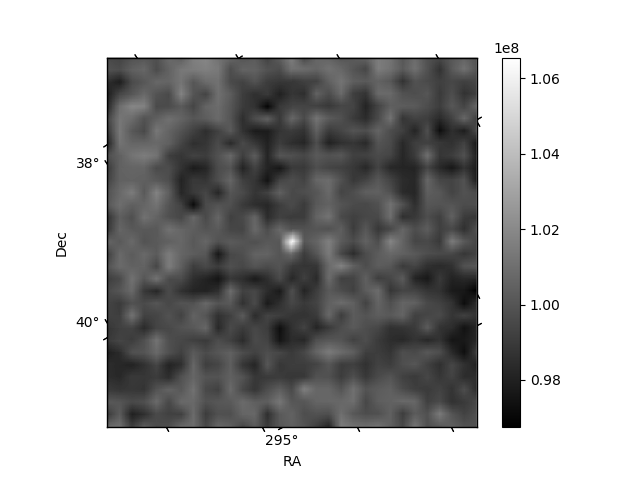
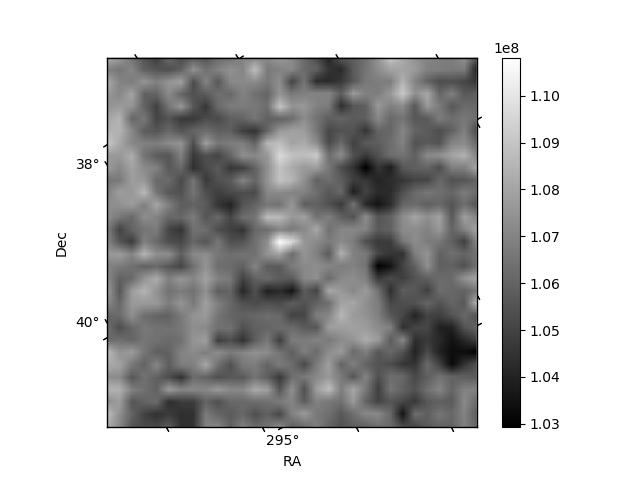
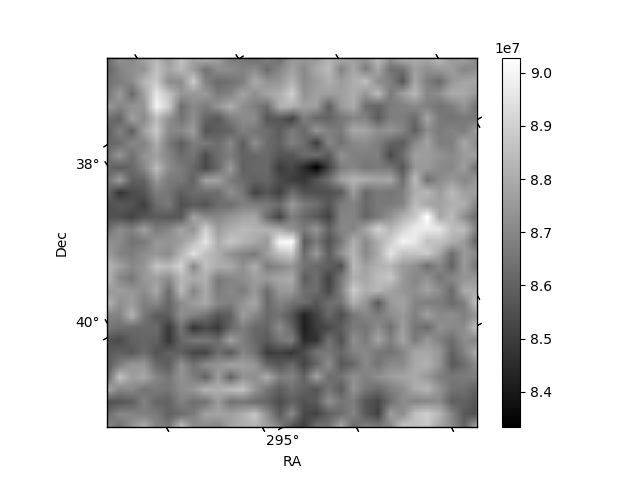
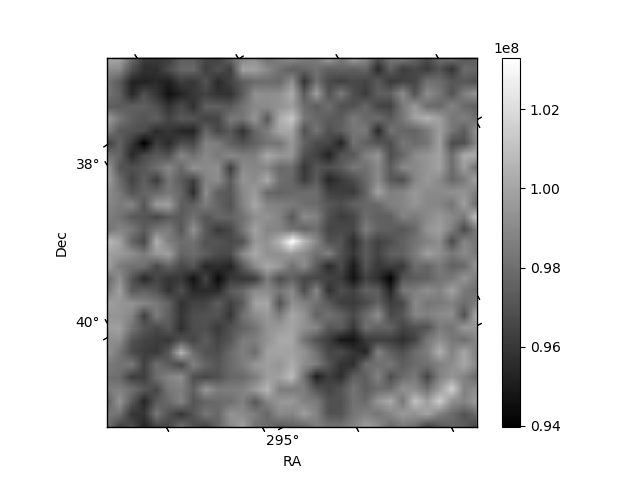
Histogram calculated using DETX and DETY for each event in the final _common_clean file
| Quadrant A | 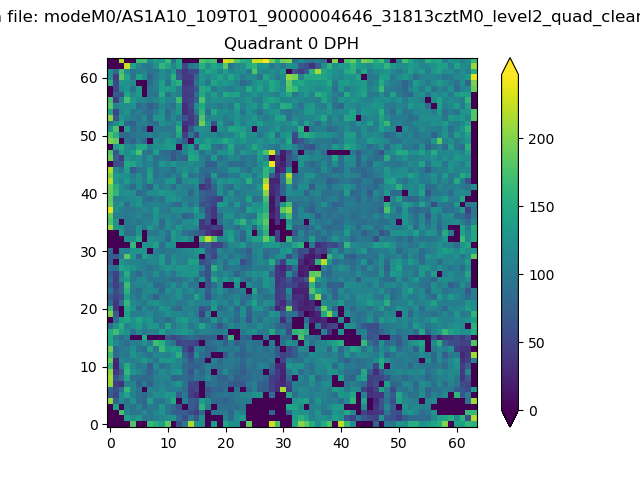 |
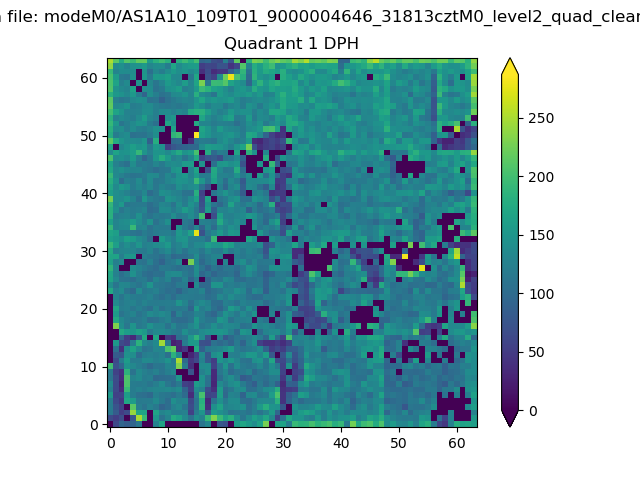 |
Quadrant B |
|---|---|---|---|
| Quadrant D | 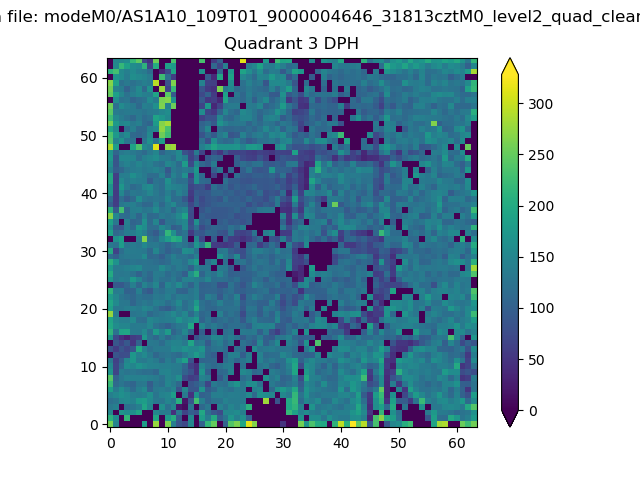 |
 |
Quadrant C |
| Plot type | Count rate plots | Images |
|---|---|---|
| Comparison with Poisson distribution Blue bars denote a histogram of data divided into 1 sec bins. Red curve is a Poisson curve with rate = median count rate of data. |
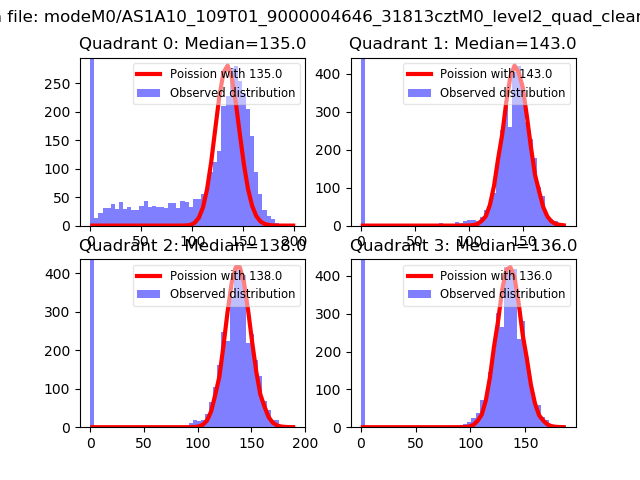 |
 |
| Quadrant-wise count rates Data is divided into 100 sec bins |
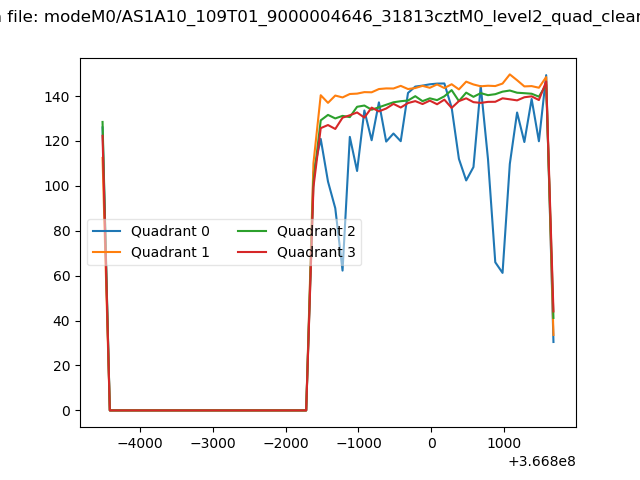 |
|
| Module-wise count rates for Quadrant A Data is divided into 100 sec bins |
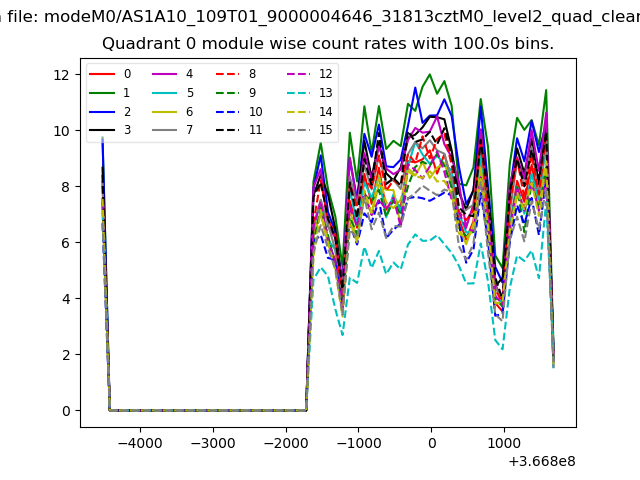 |
 |
| Module-wise count rates for Quadrant B Data is divided into 100 sec bins |
 |
 |
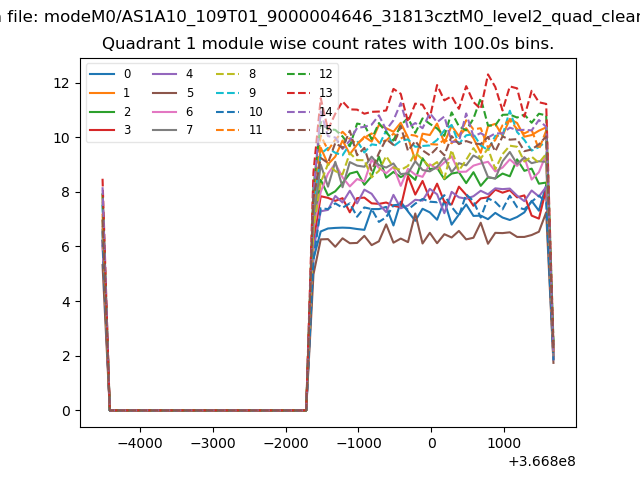
| Module-wise count rates for Quadrant C Data is divided into 100 sec bins |
 |
 |
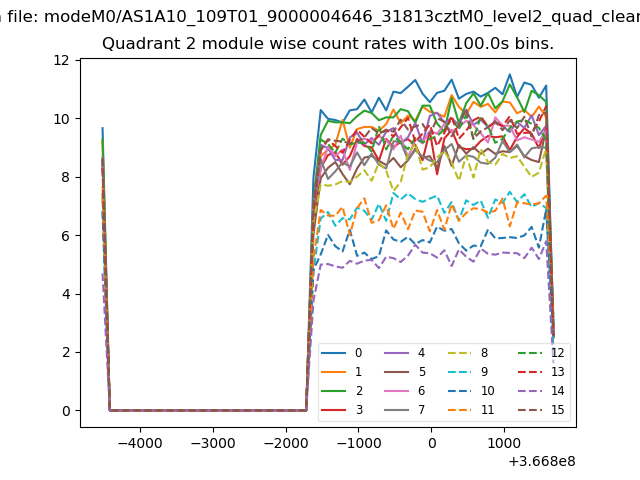
| Module-wise count rates for Quadrant D Data is divided into 100 sec bins |
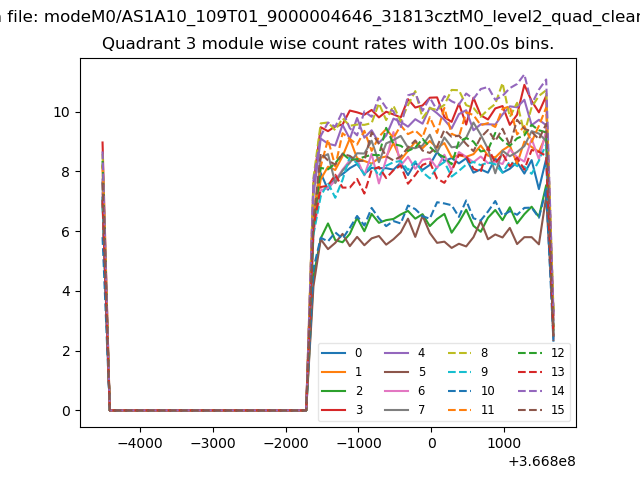 |
 |
| Parameter | Plot |
|---|---|
| CZT HV Monitor | 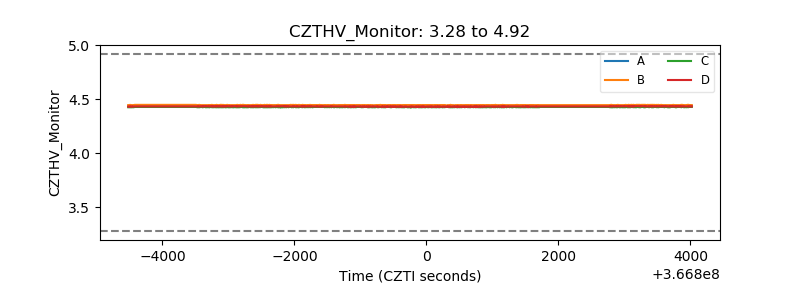 |
| D_VDD | 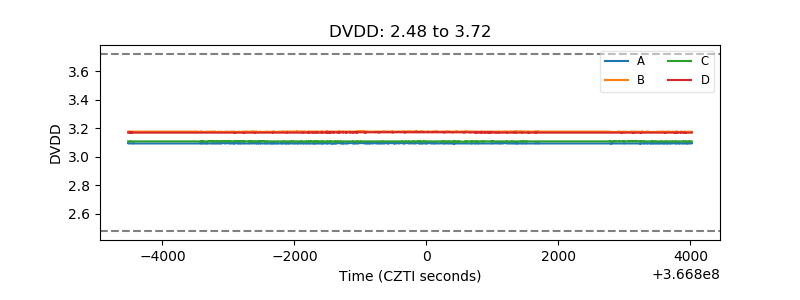 |
| Temperature 1 | 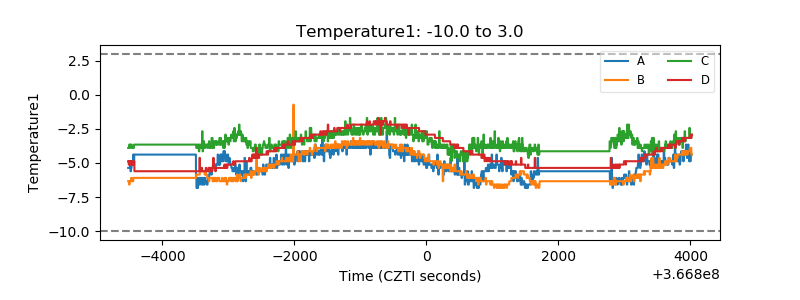 |
| Veto HV Monitor |  |
| Veto LLD | 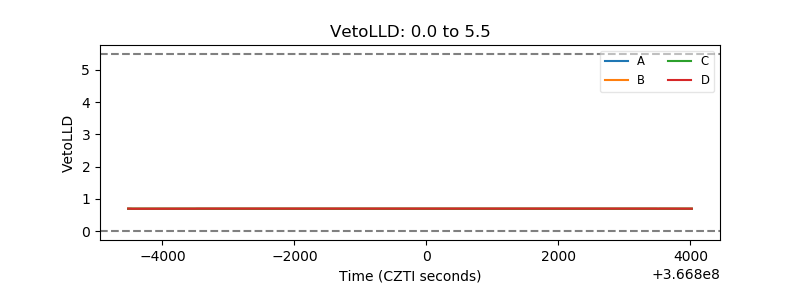 |
| Alpha Counter |  |
| _CPM_Rate |  |
| CZT Counter | 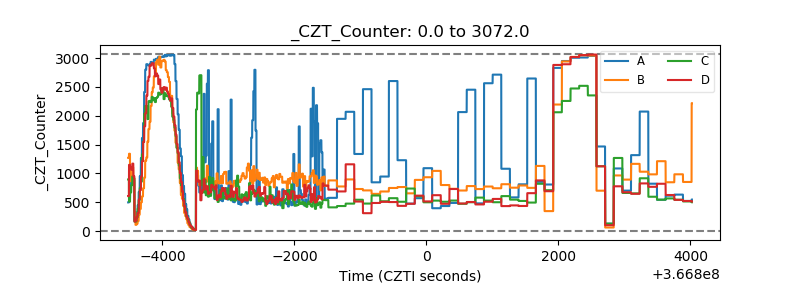 |
| +2.5 Volts monitor |  |
| +5 Volts monitor |  |
| _ROLL_ROT | 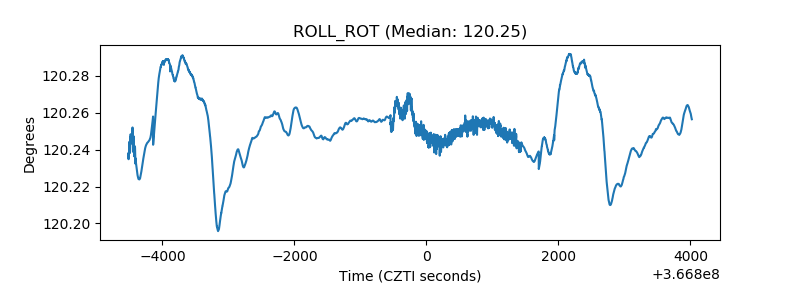 |
| _Roll_DEC | 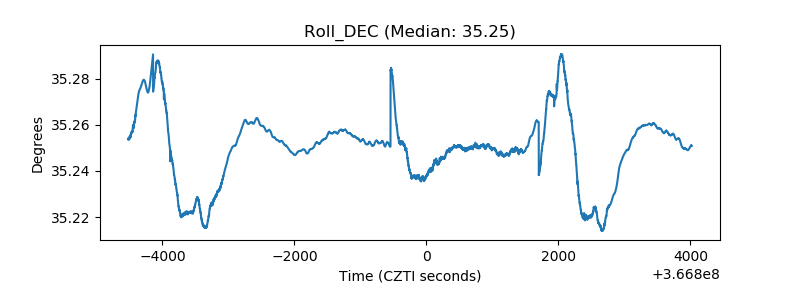 |
| _Roll_RA | 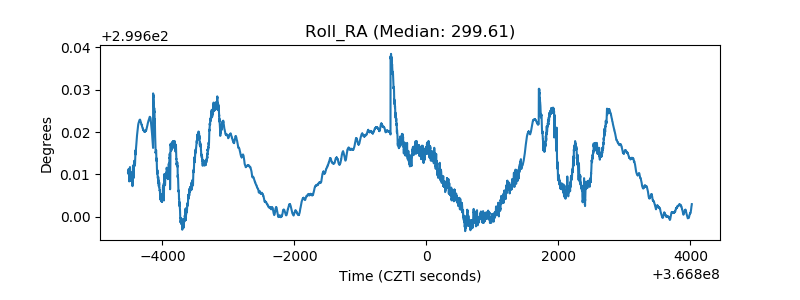 |
| Veto Counter | 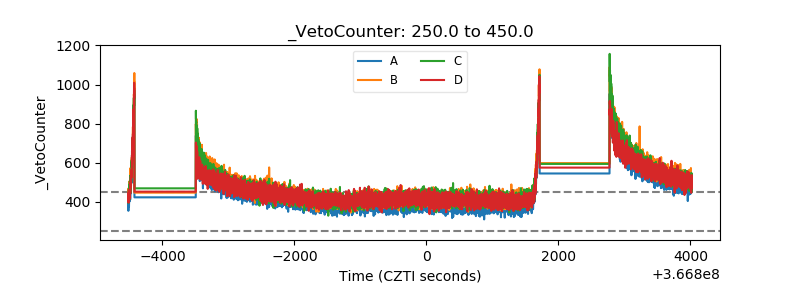 |