| Param | Original file | Final file |
|---|---|---|
| Filename | modeM0/AS1A10_109T01_9000004646_31814cztM0_level2.evt | modeM0/AS1A10_109T01_9000004646_31814cztM0_level2_quad_clean.evt |
| Size (bytes) | 654,600,960 | 92,280,960 |
| Size | 624.3 MB | 88.0 MB |
| Events in quadrant A | 5,144,050 | 595,170 |
| Events in quadrant B | 5,572,454 | 605,317 |
| Events in quadrant C | 4,116,454 | 578,905 |
| Events in quadrant D | 4,554,218 | 563,532 |
| Mode SS | |||
|---|---|---|---|
| Quadrant | BADHDUFLAG | Total packets | Discarded packets |
| A | 0 | 130 | 0 |
| B | 0 | 130 | 0 |
| C | 0 | 130 | 0 |
| D | 0 | 130 | 0 |
| Mode M0 | |||
|---|---|---|---|
| Quadrant | BADHDUFLAG | Total packets | Discarded packets |
| A | 0 | 19297 | 2 |
| B | 0 | 21169 | 2 |
| C | 0 | 16408 | 2 |
| D | 0 | 17682 | 2 |
| Mode M9 | |||
|---|---|---|---|
| Quadrant | BADHDUFLAG | Total packets | Discarded packets |
| A | 0 | 20 | 0 |
| B | 0 | 21 | 0 |
| C | 0 | 21 | 0 |
| D | 0 | 21 | 0 |
| Quadrant | Total seconds | Saturated seconds | Saturation percentage |
|---|---|---|---|
| A | 6480 | 726 | 11.203704% |
| B | 6480 | 288 | 4.444444% |
| C | 6480 | 368 | 5.679012% |
| D | 6480 | 158 | 2.438272% |
Noise dominated data is calculated using 1-second bins in cleaned event files. If a bin has >2000 counts, and if more than 50% of those come from <1% of pixels, then it is considered to be noise-dominated and hence unusable.
| Quadrant | # 1 sec bins | Bins with >0 counts | Bins with >2000 counts | High rate bins dominated by noise | Noise dominated (total time) | Noise dominated (detector-on time) | Marked lightcurve |
|---|---|---|---|---|---|---|---|
| A | 7665 | 6481 | 412 | 412 | 5.38% | 6.36% | 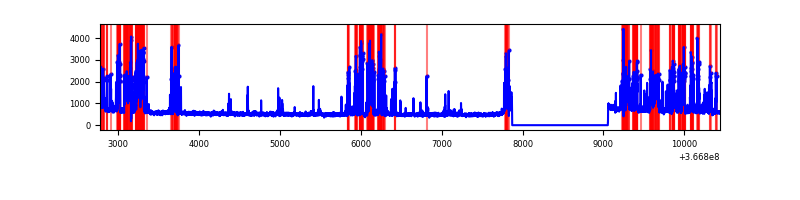 |
| B | 7665 | 6481 | 48 | 48 | 0.63% | 0.74% | 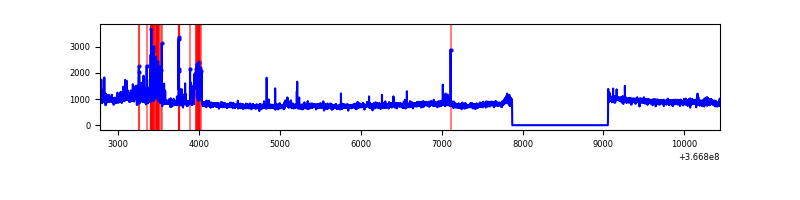 |
| C | 7665 | 6481 | 119 | 119 | 1.55% | 1.84% | 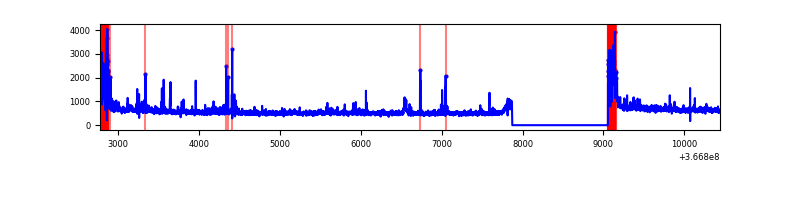 |
| D | 7665 | 6481 | 86 | 86 | 1.12% | 1.33% | 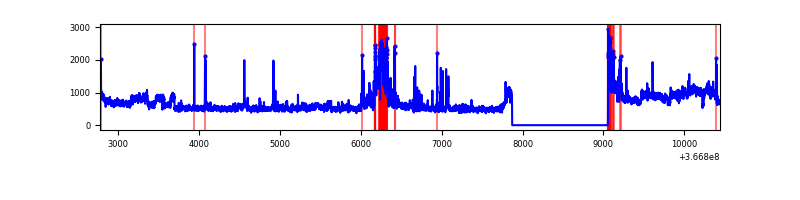 |
Top three noisy pixels from each quadrant. If the there are fewer than three noisy pixels in the level2.evt file, extra rows are filled as -1
| Pixel properties | Quadrant properties | ||||||
|---|---|---|---|---|---|---|---|
| Quadrant | DetID | PixID | Counts | Sigma | Mean | Median | Sigma |
| A | 0 | 13 | 1729392 | 9916.87 | 883 | 869 | 174.3 |
| A | 13 | 254 | 11174 | 59.12 | 883 | 869 | 174.3 |
| A | 13 | 6 | 10708 | 56.45 | 883 | 869 | 174.3 |
| B | 6 | 159 | 1691982 | 10089.72 | 891 | 872 | 167.6 |
| B | 10 | 245 | 375582 | 2235.64 | 891 | 872 | 167.6 |
| B | 12 | 111 | 20310 | 115.97 | 891 | 872 | 167.6 |
| C | 0 | 10 | 565715 | 2899.75 | 843 | 852 | 194.8 |
| C | 14 | 238 | 156346 | 798.23 | 843 | 852 | 194.8 |
| C | 3 | 233 | 25432 | 126.18 | 843 | 852 | 194.8 |
| D | 8 | 195 | 759162 | 3678.5 | 875 | 857 | 206.1 |
| D | 12 | 227 | 338090 | 1635.9 | 875 | 857 | 206.1 |
| D | 12 | 218 | 79067 | 379.39 | 875 | 857 | 206.1 |
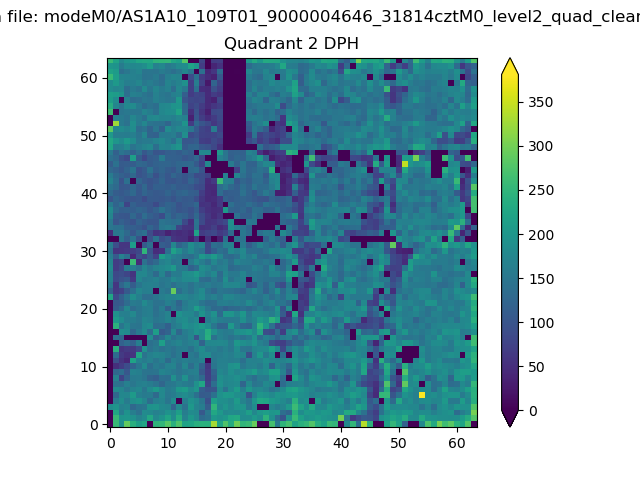
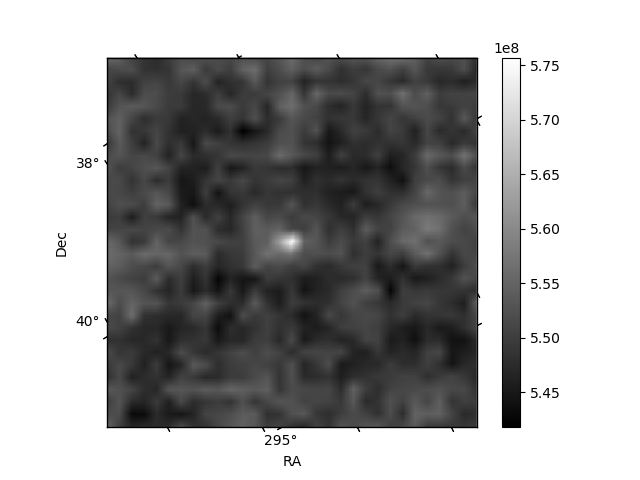
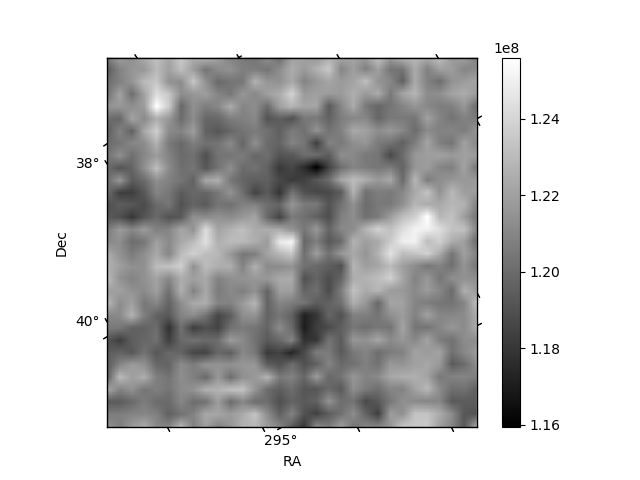
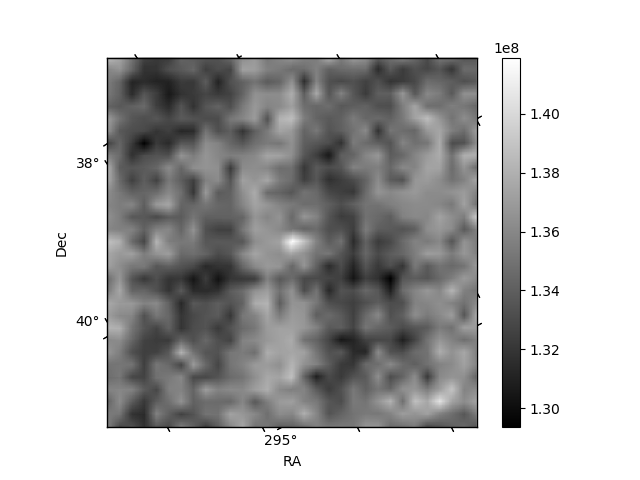
Histogram calculated using DETX and DETY for each event in the final _common_clean file
| Quadrant A | 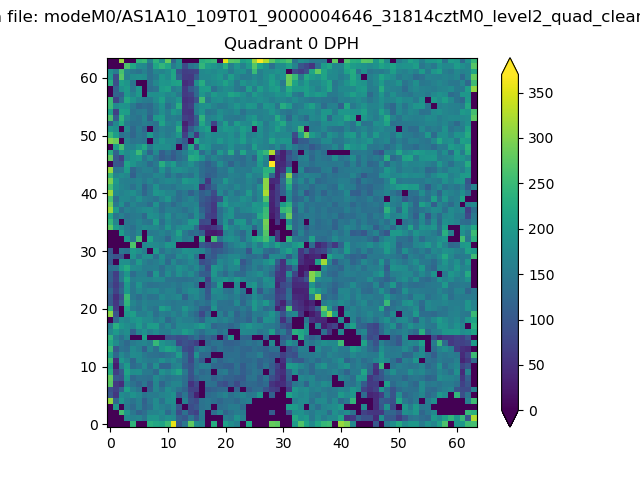 |
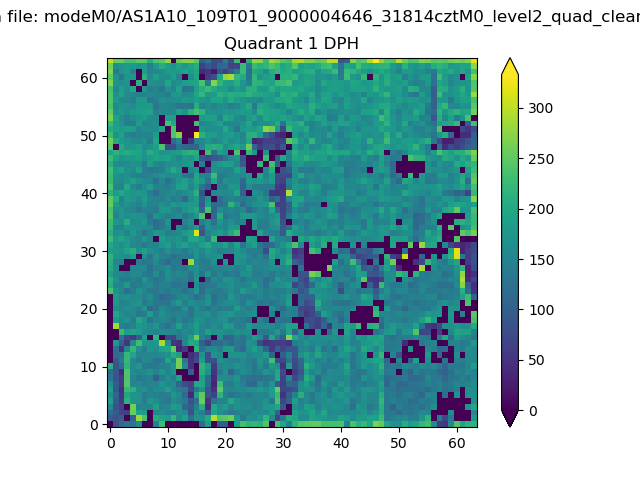 |
Quadrant B |
|---|---|---|---|
| Quadrant D | 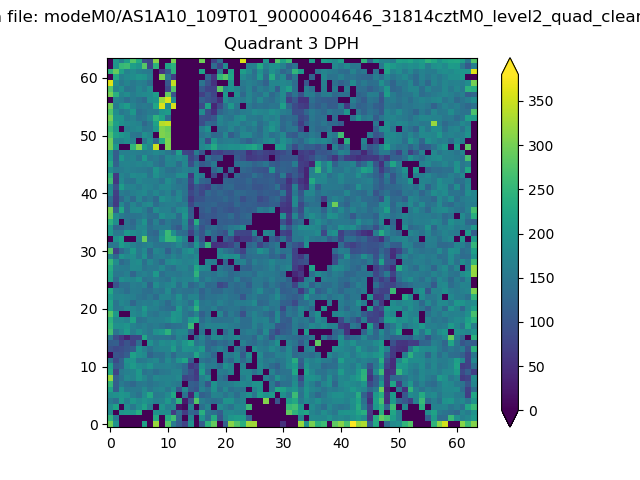 |
 |
Quadrant C |
| Plot type | Count rate plots | Images |
|---|---|---|
| Comparison with Poisson distribution Blue bars denote a histogram of data divided into 1 sec bins. Red curve is a Poisson curve with rate = median count rate of data. |
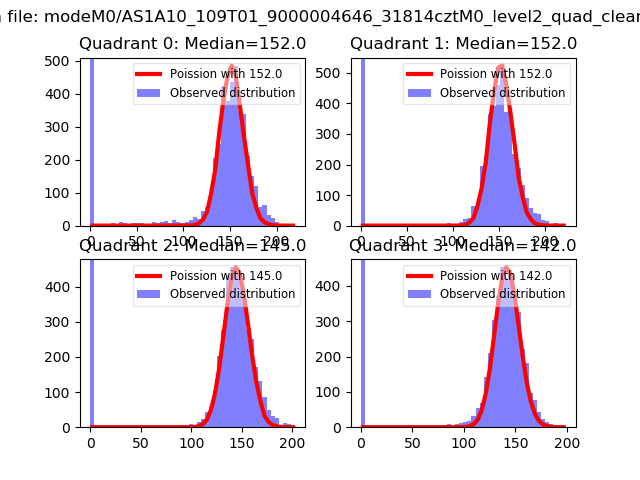 |
 |
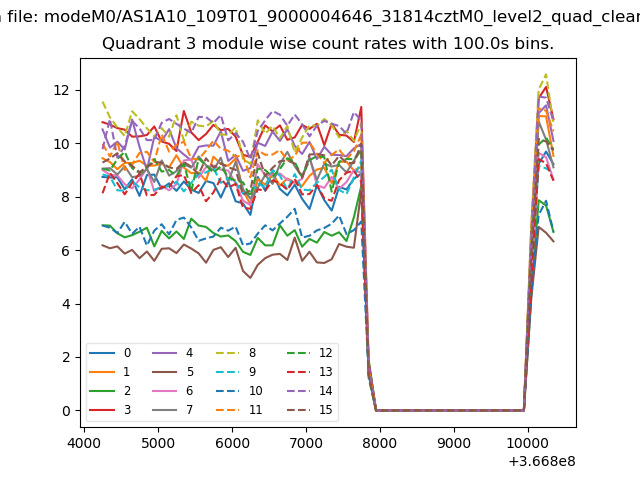
| Quadrant-wise count rates Data is divided into 100 sec bins |
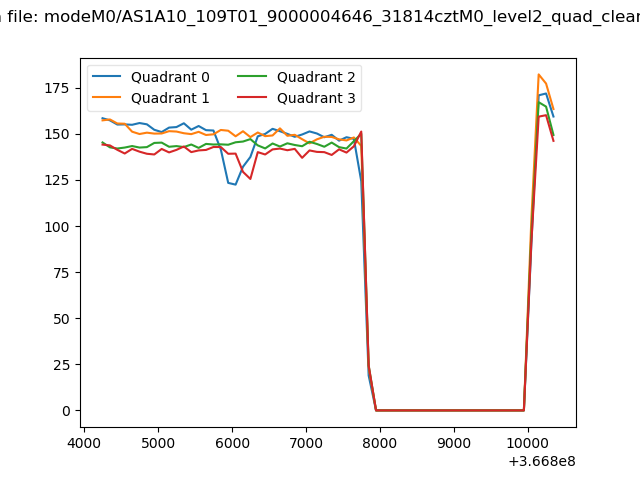 |
|
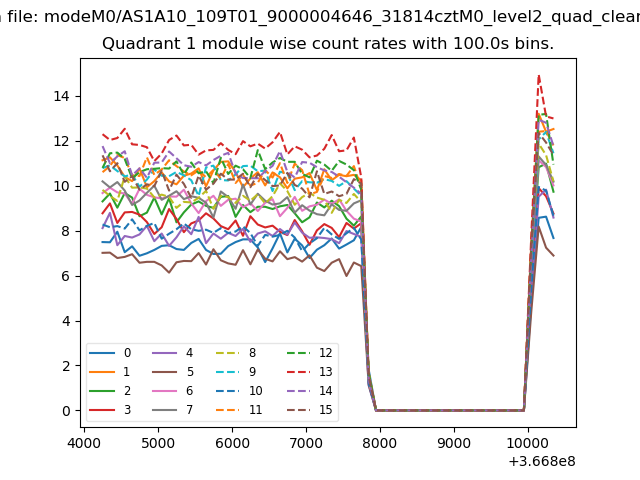
| Module-wise count rates for Quadrant A Data is divided into 100 sec bins |
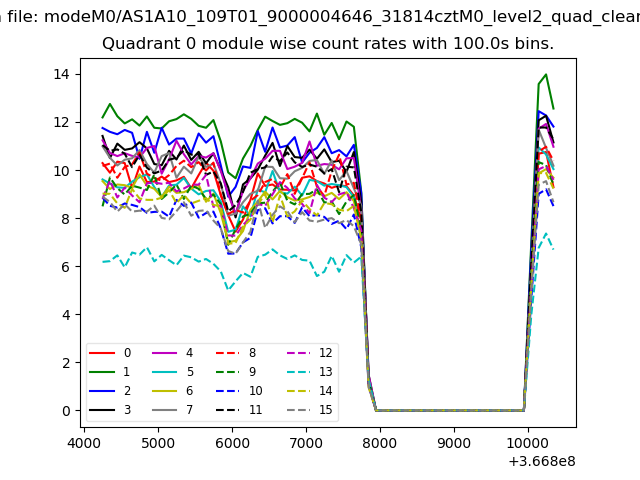 |
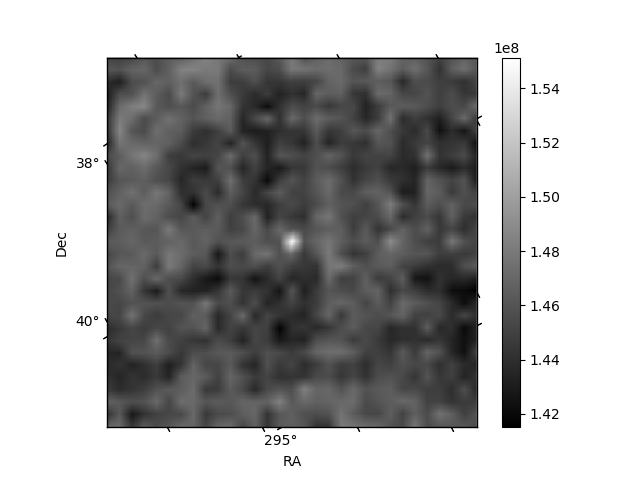 |
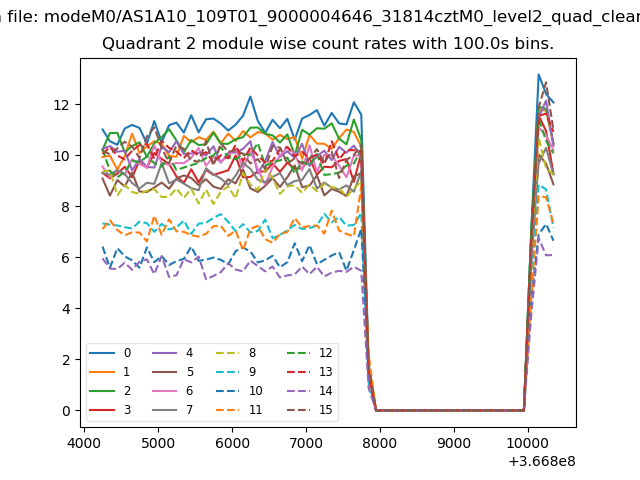
| Module-wise count rates for Quadrant B Data is divided into 100 sec bins |
 |
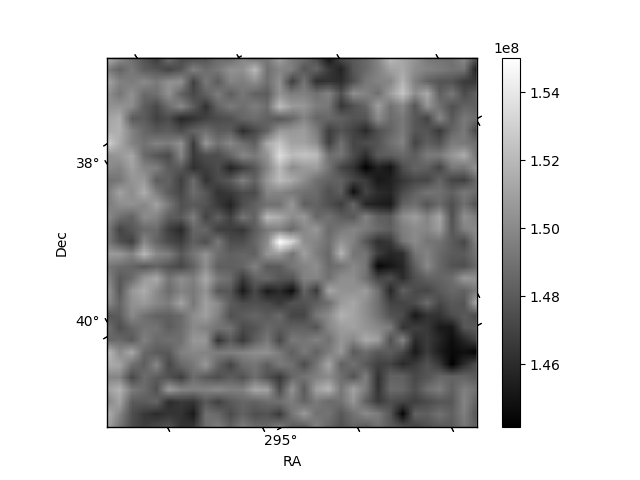 |
| Module-wise count rates for Quadrant C Data is divided into 100 sec bins |
 |
 |
| Module-wise count rates for Quadrant D Data is divided into 100 sec bins |
 |
 |
| Parameter | Plot |
|---|---|
| CZT HV Monitor | 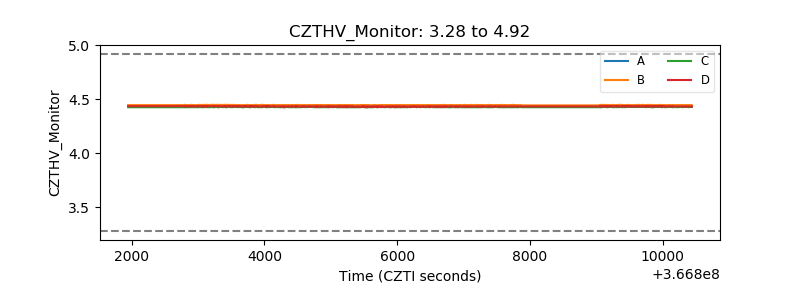 |
| D_VDD | 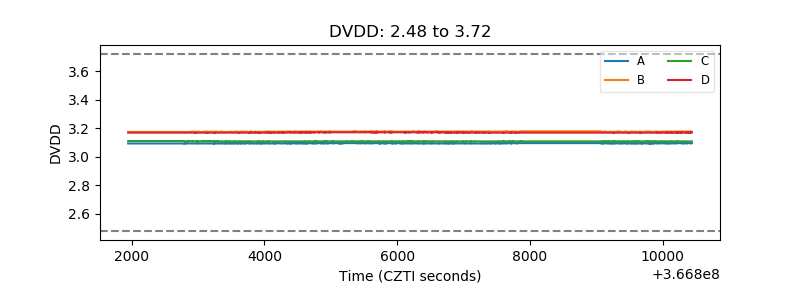 |
| Temperature 1 | 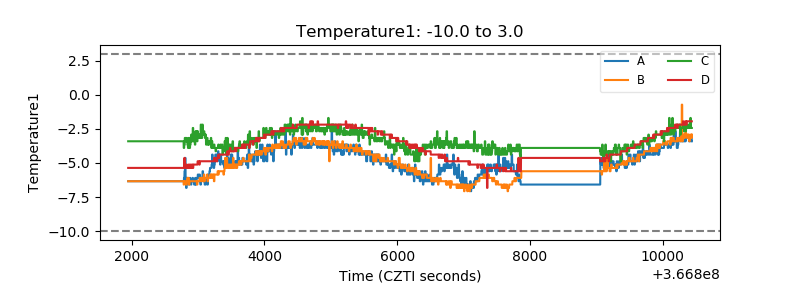 |
| Veto HV Monitor | 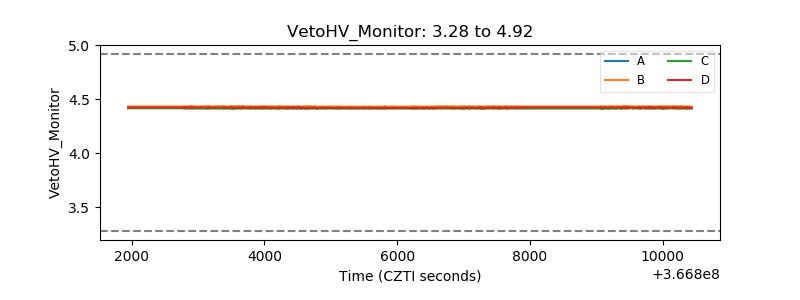 |
| Veto LLD | 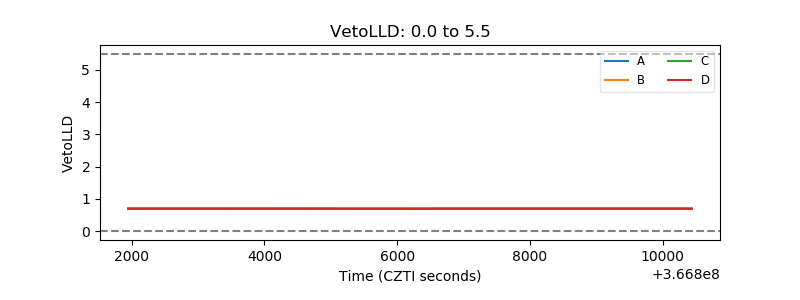 |
| Alpha Counter | 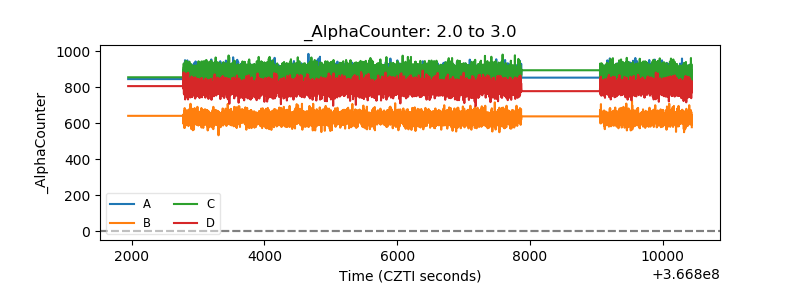 |
| _CPM_Rate | 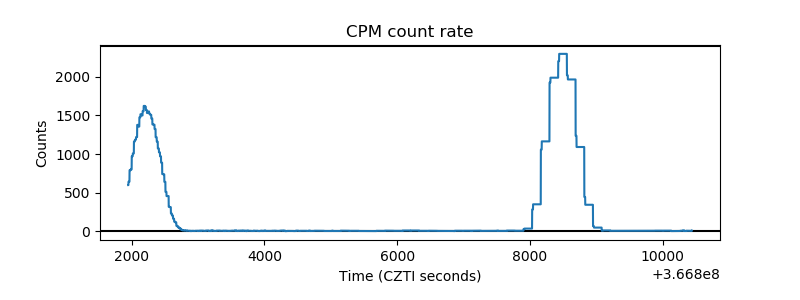 |
| CZT Counter | 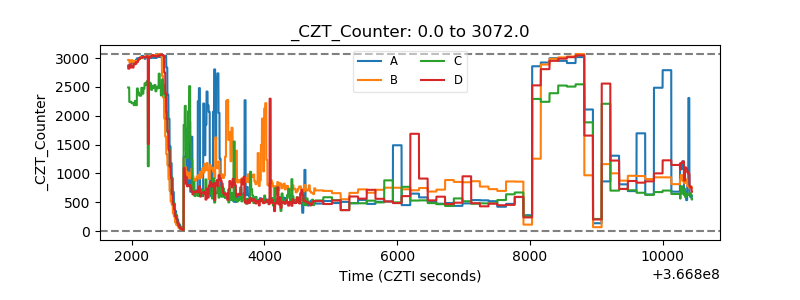 |
| +2.5 Volts monitor |  |
| +5 Volts monitor | 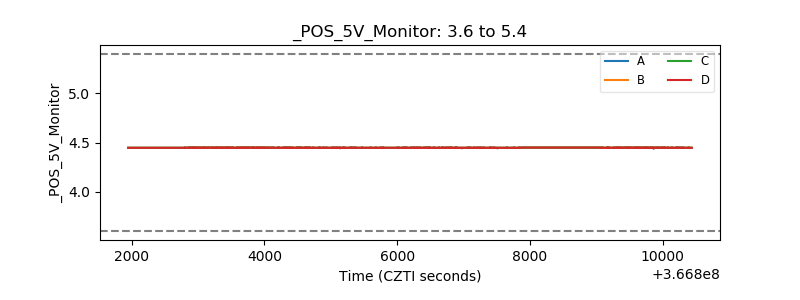 |
| _ROLL_ROT | 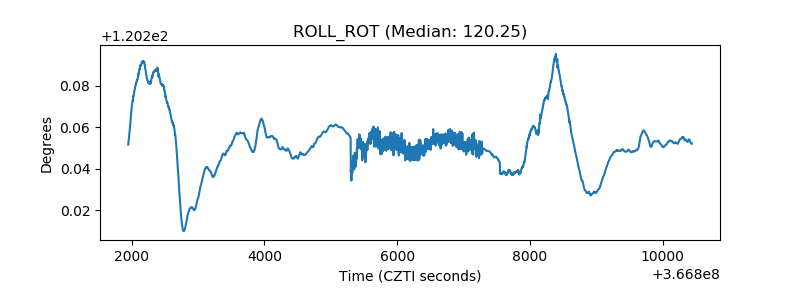 |
| _Roll_DEC | 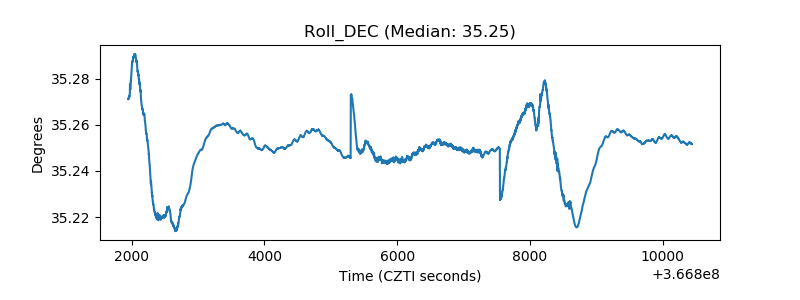 |
| _Roll_RA | 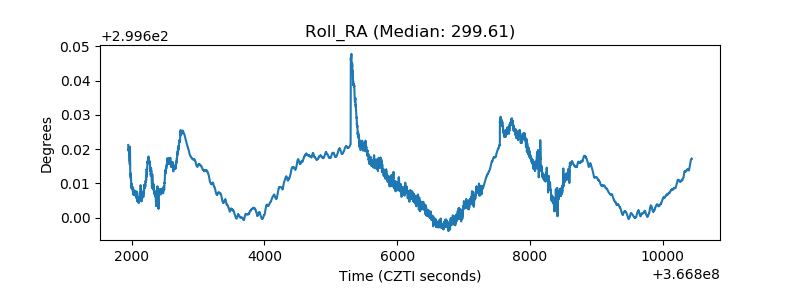 |
| Veto Counter | 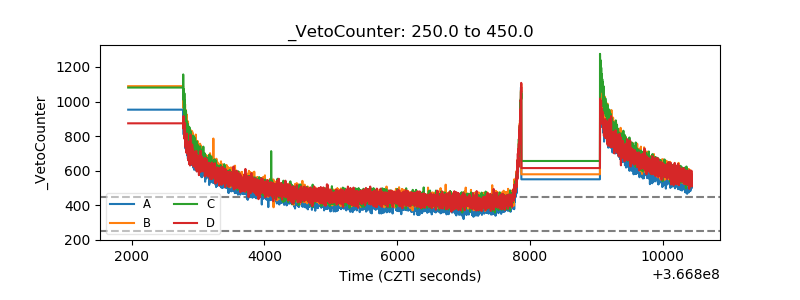 |