| Param | Original file | Final file |
|---|---|---|
| Filename | modeM0/AS1A10_109T01_9000004646_31815cztM0_level2.evt | modeM0/AS1A10_109T01_9000004646_31815cztM0_level2_quad_clean.evt |
| Size (bytes) | 749,381,760 | 107,415,360 |
| Size | 714.7 MB | 102.4 MB |
| Events in quadrant A | 6,688,587 | 688,817 |
| Events in quadrant B | 5,908,740 | 729,005 |
| Events in quadrant C | 4,183,069 | 709,486 |
| Events in quadrant D | 5,493,004 | 688,182 |
| Mode SS | |||
|---|---|---|---|
| Quadrant | BADHDUFLAG | Total packets | Discarded packets |
| A | 0 | 128 | 0 |
| B | 0 | 128 | 0 |
| C | 0 | 128 | 0 |
| D | 0 | 128 | 0 |
| Mode M0 | |||
|---|---|---|---|
| Quadrant | BADHDUFLAG | Total packets | Discarded packets |
| A | 0 | 24099 | 1 |
| B | 0 | 21592 | 1 |
| C | 0 | 16938 | 1 |
| D | 0 | 21001 | 1 |
| Mode M9 | |||
|---|---|---|---|
| Quadrant | BADHDUFLAG | Total packets | Discarded packets |
| A | 0 | 13 | 0 |
| B | 0 | 13 | 0 |
| C | 0 | 13 | 0 |
| D | 0 | 13 | 0 |
| Quadrant | Total seconds | Saturated seconds | Saturation percentage |
|---|---|---|---|
| A | 6263 | 1196 | 19.096280% |
| B | 6263 | 451 | 7.201022% |
| C | 6263 | 295 | 4.710203% |
| D | 6262 | 80 | 1.277547% |
Noise dominated data is calculated using 1-second bins in cleaned event files. If a bin has >2000 counts, and if more than 50% of those come from <1% of pixels, then it is considered to be noise-dominated and hence unusable.
| Quadrant | # 1 sec bins | Bins with >0 counts | Bins with >2000 counts | High rate bins dominated by noise | Noise dominated (total time) | Noise dominated (detector-on time) | Marked lightcurve |
|---|---|---|---|---|---|---|---|
| A | 7553 | 6264 | 887 | 887 | 11.74% | 14.16% | 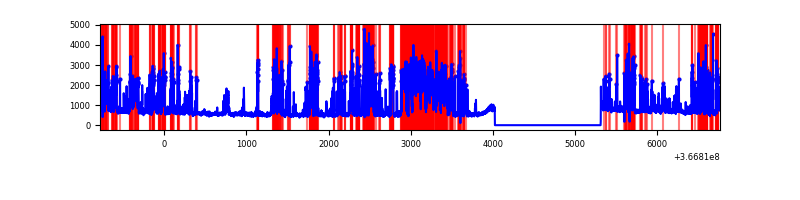 |
| B | 7553 | 6264 | 238 | 238 | 3.15% | 3.80% | 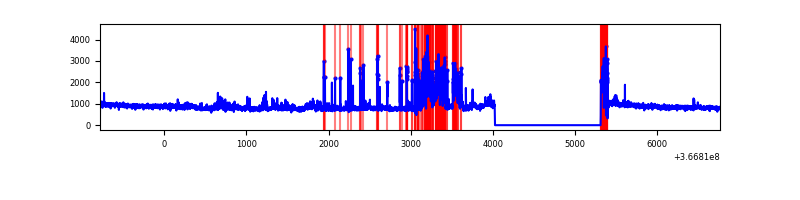 |
| C | 7553 | 6264 | 57 | 57 | 0.75% | 0.91% | 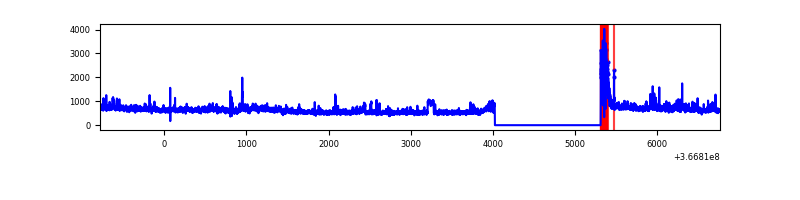 |
| D | 7552 | 6263 | 8 | 8 | 0.11% | 0.13% | 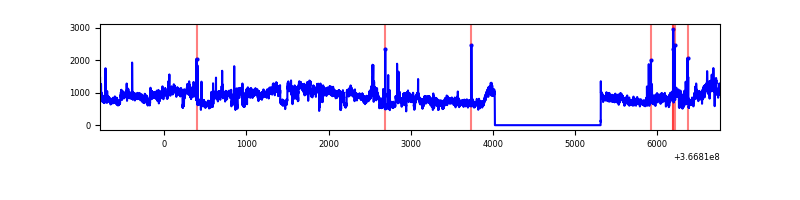 |
Top three noisy pixels from each quadrant. If the there are fewer than three noisy pixels in the level2.evt file, extra rows are filled as -1
| Pixel properties | Quadrant properties | ||||||
|---|---|---|---|---|---|---|---|
| Quadrant | DetID | PixID | Counts | Sigma | Mean | Median | Sigma |
| A | 0 | 13 | 3356641 | 19818.62 | 862 | 849 | 169.3 |
| A | 13 | 254 | 10837 | 58.99 | 862 | 849 | 169.3 |
| A | 3 | 137 | 7858 | 41.39 | 862 | 849 | 169.3 |
| B | 6 | 159 | 1555150 | 9370.52 | 878 | 860 | 165.9 |
| B | 10 | 245 | 895587 | 5394.14 | 878 | 860 | 165.9 |
| B | 12 | 111 | 19192 | 110.52 | 878 | 860 | 165.9 |
| C | 0 | 10 | 508070 | 2556.93 | 857 | 867 | 198.4 |
| C | 14 | 238 | 167022 | 837.63 | 857 | 867 | 198.4 |
| C | 3 | 233 | 109133 | 545.79 | 857 | 867 | 198.4 |
| D | 8 | 195 | 2050360 | 9922.12 | 885 | 867 | 206.6 |
| D | 2 | 250 | 78920 | 377.87 | 885 | 867 | 206.6 |
| D | 2 | 234 | 27859 | 130.68 | 885 | 867 | 206.6 |
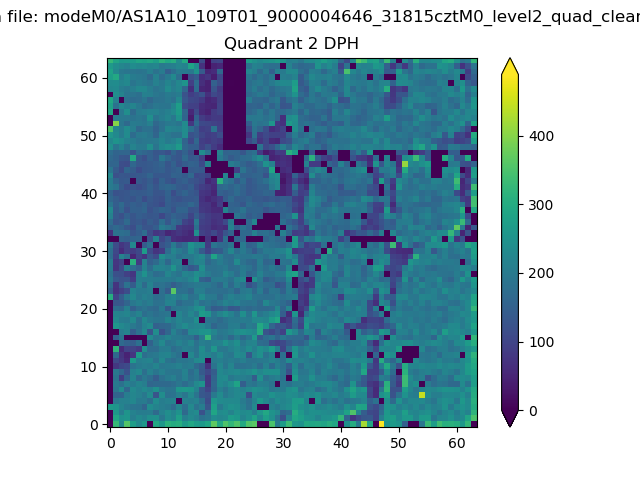
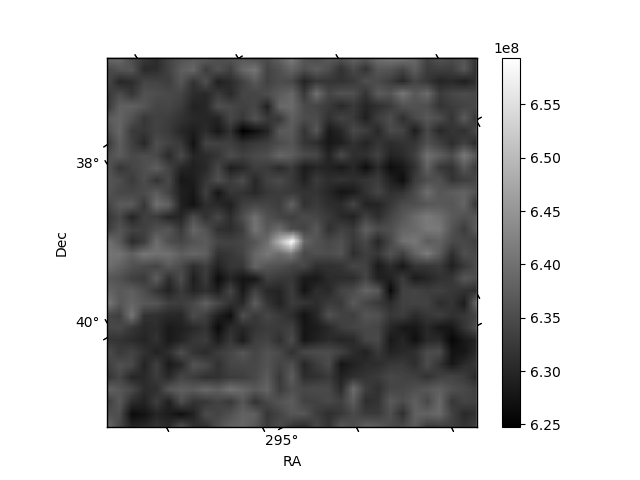
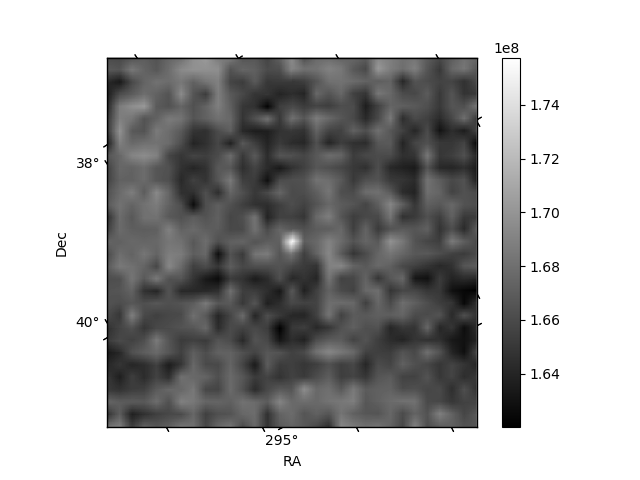
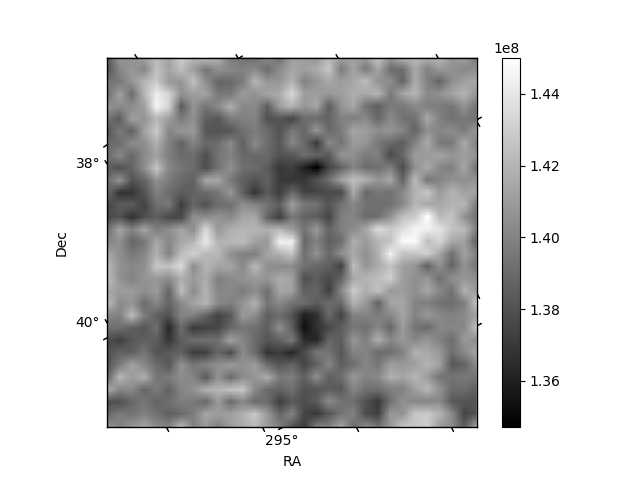
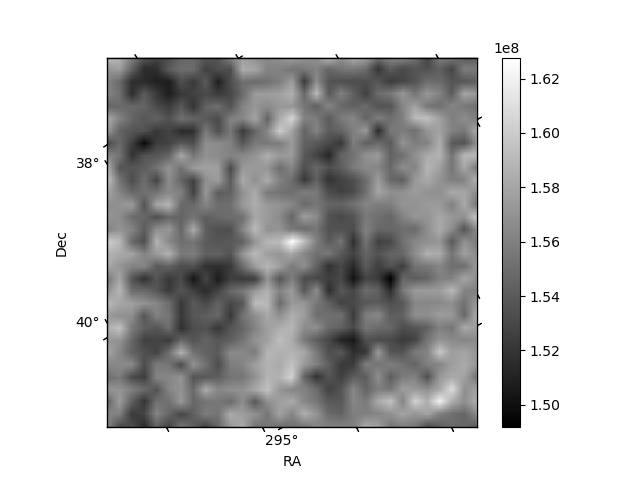
Histogram calculated using DETX and DETY for each event in the final _common_clean file
| Quadrant A | 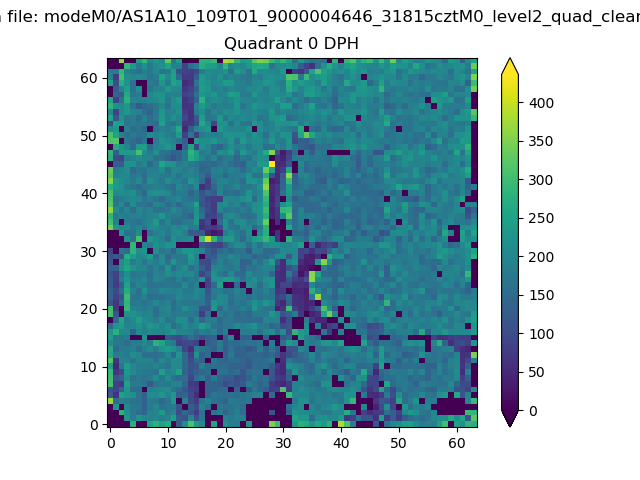 |
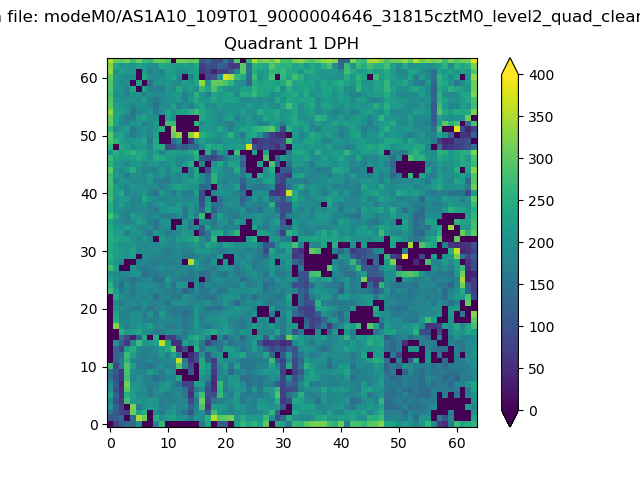 |
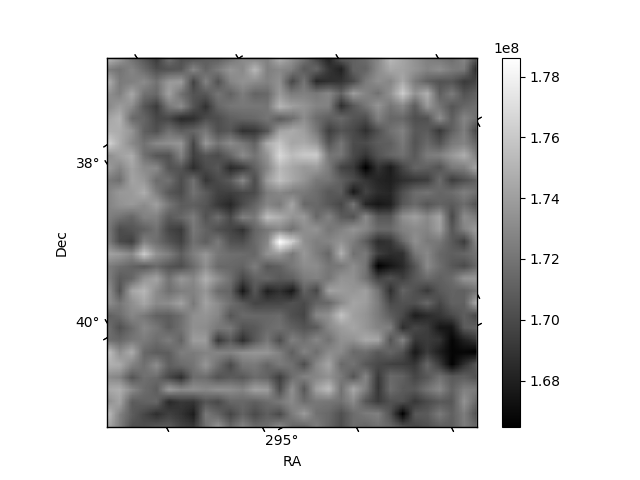
Quadrant B |
|---|---|---|---|
| Quadrant D | 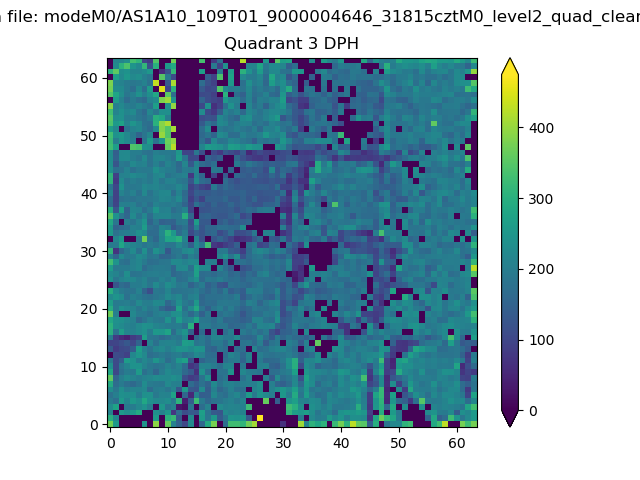 |
 |
Quadrant C |
| Plot type | Count rate plots | Images |
|---|---|---|
| Comparison with Poisson distribution Blue bars denote a histogram of data divided into 1 sec bins. Red curve is a Poisson curve with rate = median count rate of data. |
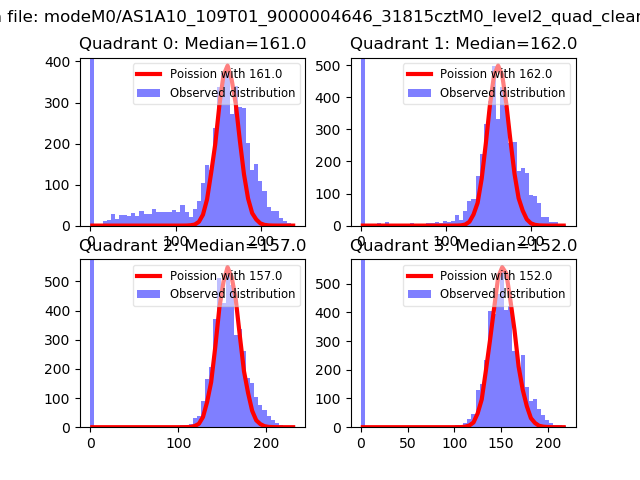 |
 |
| Quadrant-wise count rates Data is divided into 100 sec bins |
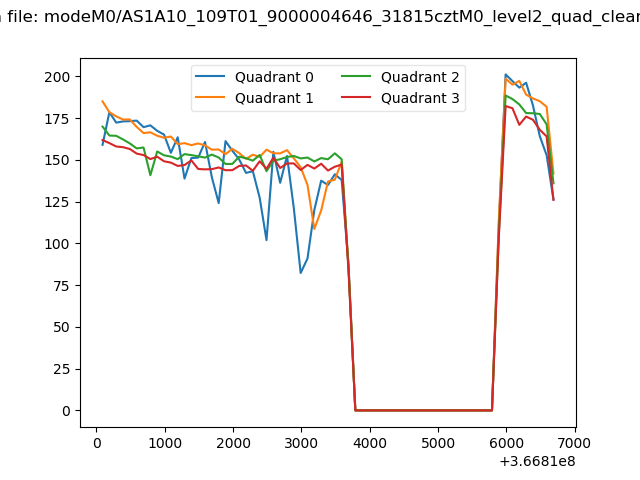 |
|
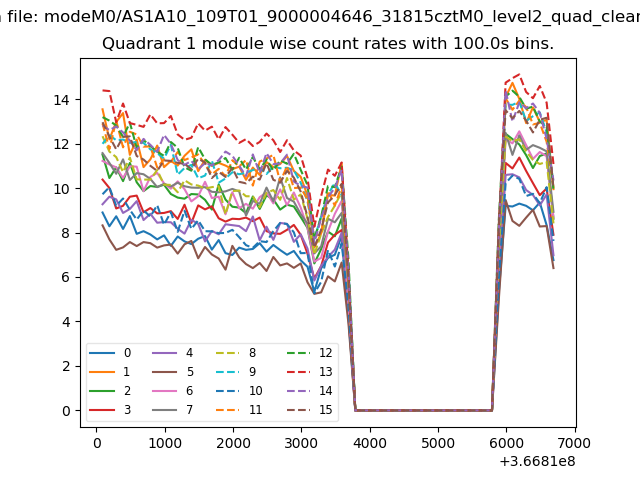
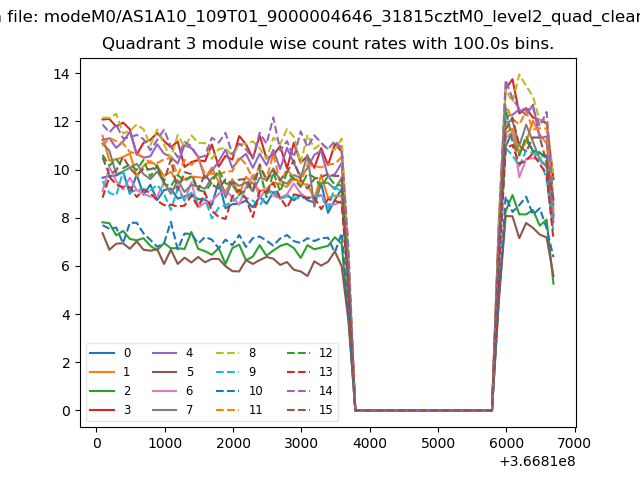
| Module-wise count rates for Quadrant A Data is divided into 100 sec bins |
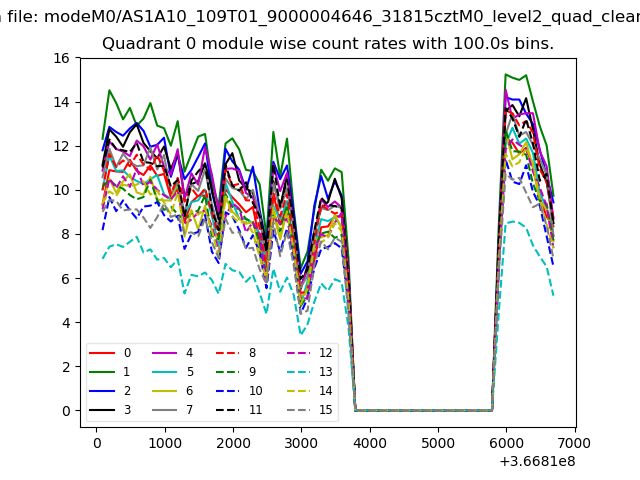 |
 |
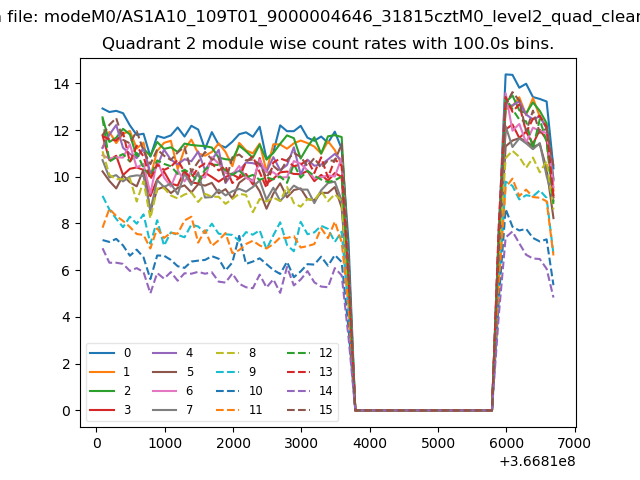
| Module-wise count rates for Quadrant B Data is divided into 100 sec bins |
 |
 |
| Module-wise count rates for Quadrant C Data is divided into 100 sec bins |
 |
 |
| Module-wise count rates for Quadrant D Data is divided into 100 sec bins |
 |
 |
| Parameter | Plot |
|---|---|
| CZT HV Monitor | 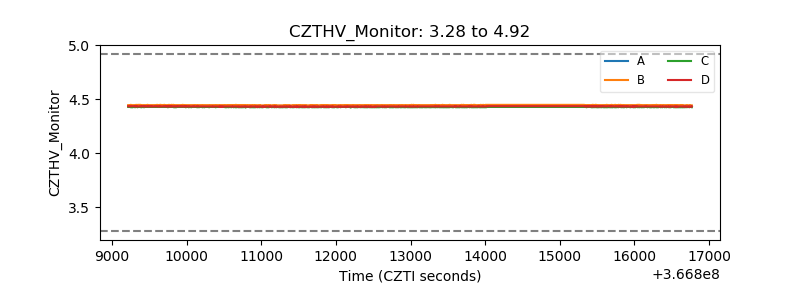 |
| D_VDD | 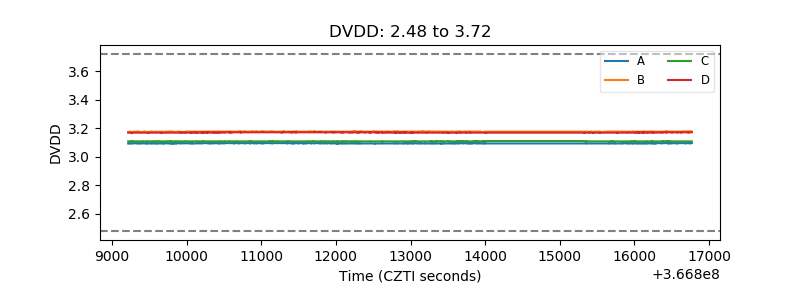 |
| Temperature 1 | 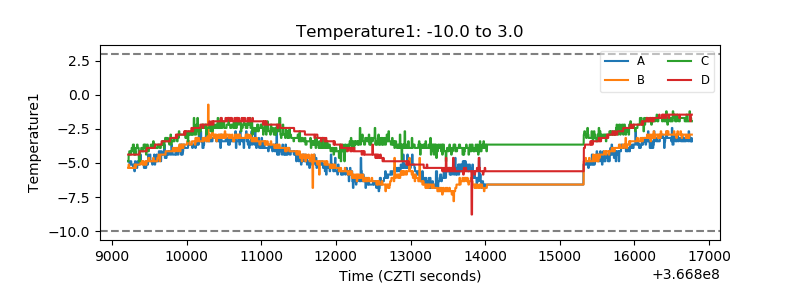 |
| Veto HV Monitor | 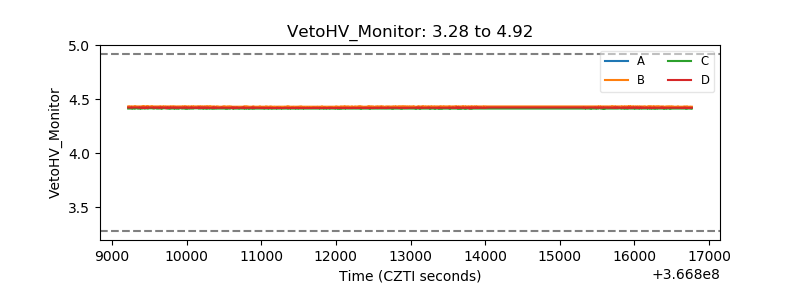 |
| Veto LLD | 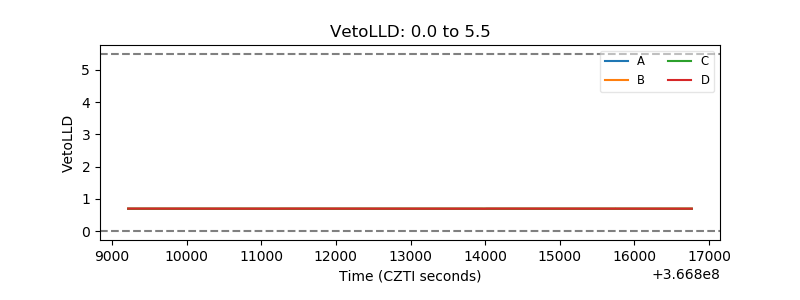 |
| Alpha Counter | 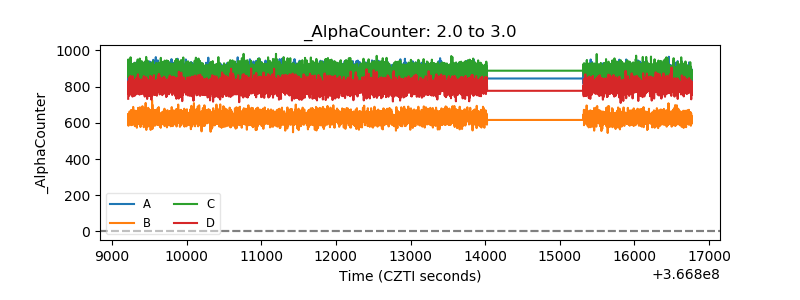 |
| _CPM_Rate | 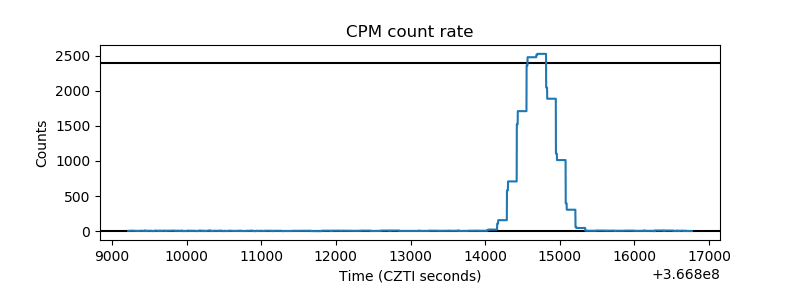 |
| CZT Counter | 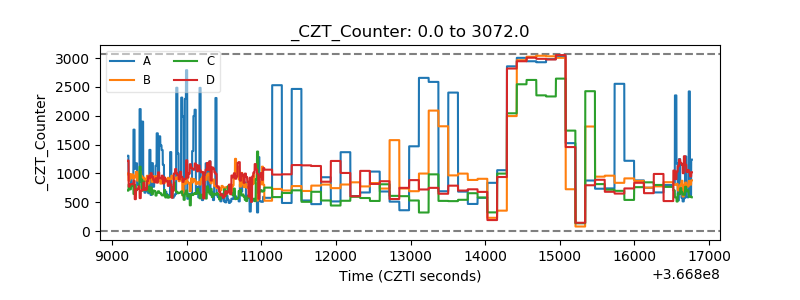 |
| +2.5 Volts monitor |  |
| +5 Volts monitor |  |
| _ROLL_ROT | 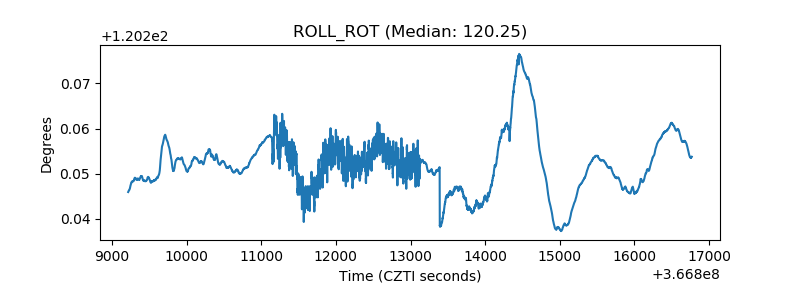 |
| _Roll_DEC | 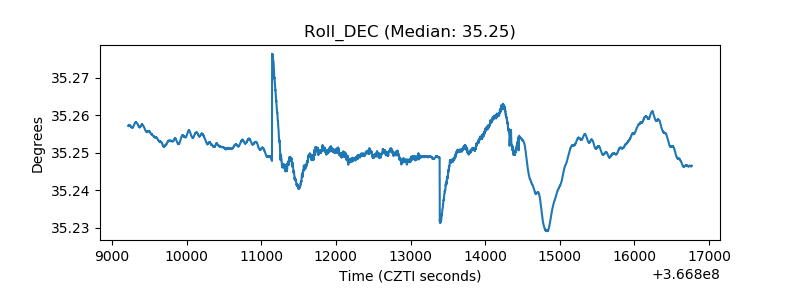 |
| _Roll_RA | 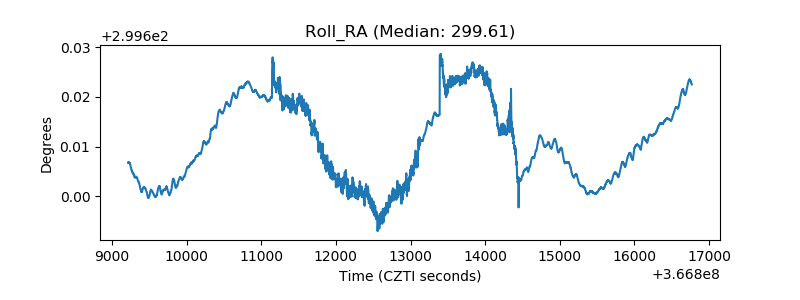 |
| Veto Counter | 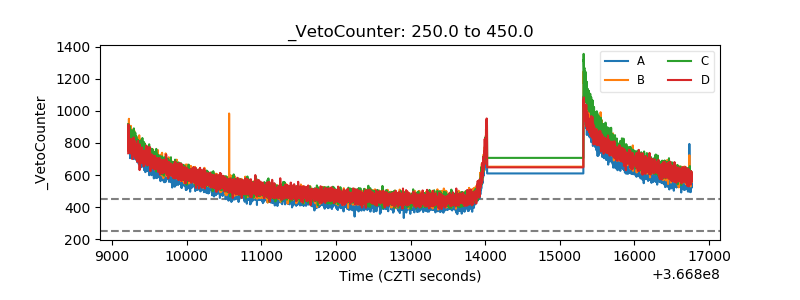 |