| Param | Original file | Final file |
|---|---|---|
| Filename | modeM0/AS1A10_109T01_9000004646_31816cztM0_level2.evt | modeM0/AS1A10_109T01_9000004646_31816cztM0_level2_quad_clean.evt |
| Size (bytes) | 342,685,440 | 62,254,080 |
| Size | 326.8 MB | 59.4 MB |
| Events in quadrant A | 2,568,359 | 415,176 |
| Events in quadrant B | 2,843,570 | 423,996 |
| Events in quadrant C | 2,200,637 | 414,505 |
| Events in quadrant D | 2,534,407 | 390,373 |
| Mode SS | |||
|---|---|---|---|
| Quadrant | BADHDUFLAG | Total packets | Discarded packets |
| A | 0 | 77 | 11 |
| B | 0 | 75 | 9 |
| C | 0 | 75 | 7 |
| D | 0 | 77 | 7 |
| Mode M0 | |||
|---|---|---|---|
| Quadrant | BADHDUFLAG | Total packets | Discarded packets |
| A | 0 | 11070 | 1044 |
| B | 0 | 11772 | 1184 |
| C | 0 | 9699 | 796 |
| D | 0 | 10487 | 788 |
| Mode M9 | |||
|---|---|---|---|
| Quadrant | BADHDUFLAG | Total packets | Discarded packets |
| A | 0 | 8 | 7 |
| B | 0 | 4 | 3 |
| C | 0 | 5 | 5 |
| D | 0 | 3 | 2 |
| Quadrant | Total seconds | Saturated seconds | Saturation percentage |
|---|---|---|---|
| A | 3399 | 238 | 7.002059% |
| B | 3363 | 61 | 1.813857% |
| C | 3421 | 134 | 3.916983% |
| D | 3413 | 139 | 4.072663% |
Noise dominated data is calculated using 1-second bins in cleaned event files. If a bin has >2000 counts, and if more than 50% of those come from <1% of pixels, then it is considered to be noise-dominated and hence unusable.
| Quadrant | # 1 sec bins | Bins with >0 counts | Bins with >2000 counts | High rate bins dominated by noise | Noise dominated (total time) | Noise dominated (detector-on time) | Marked lightcurve |
|---|---|---|---|---|---|---|---|
| A | 7483 | 3468 | 151 | 151 | 2.02% | 4.35% | 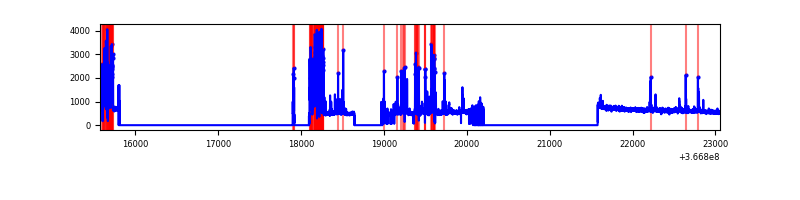 |
| B | 7483 | 3439 | 5 | 5 | 0.07% | 0.15% | 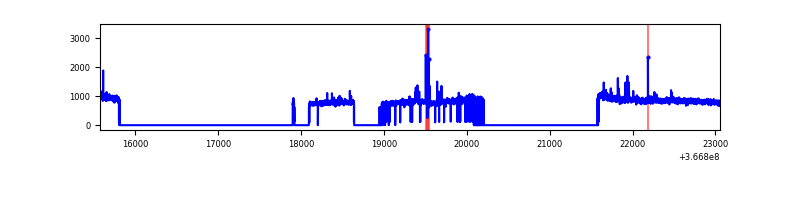 |
| C | 7483 | 3489 | 32 | 32 | 0.43% | 0.92% | 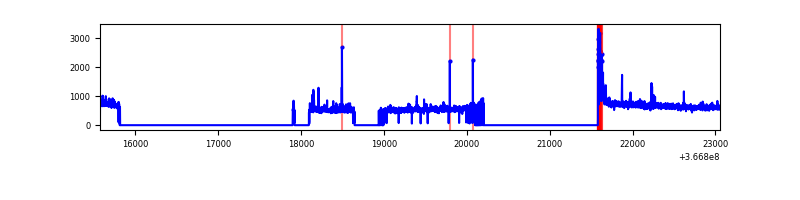 |
| D | 7483 | 3482 | 96 | 96 | 1.28% | 2.76% | 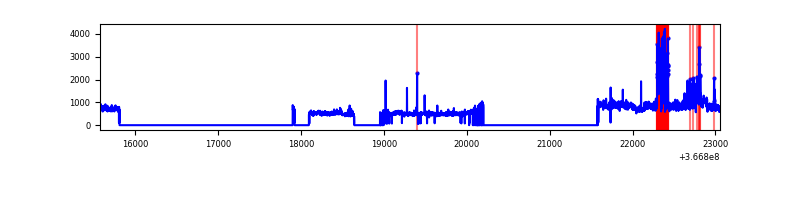 |
Top three noisy pixels from each quadrant. If the there are fewer than three noisy pixels in the level2.evt file, extra rows are filled as -1
| Pixel properties | Quadrant properties | ||||||
|---|---|---|---|---|---|---|---|
| Quadrant | DetID | PixID | Counts | Sigma | Mean | Median | Sigma |
| A | 0 | 13 | 675495 | 7001.5 | 490 | 485 | 96.4 |
| A | 13 | 254 | 5899 | 56.16 | 490 | 485 | 96.4 |
| A | 3 | 137 | 4481 | 41.45 | 490 | 485 | 96.4 |
| B | 6 | 159 | 876617 | 9487.15 | 486 | 476 | 92.4 |
| B | 10 | 245 | 51813 | 555.89 | 486 | 476 | 92.4 |
| B | 12 | 111 | 10642 | 110.08 | 486 | 476 | 92.4 |
| C | 0 | 10 | 166483 | 1458.43 | 484 | 489 | 113.8 |
| C | 14 | 238 | 81025 | 707.59 | 484 | 489 | 113.8 |
| C | 3 | 233 | 48837 | 424.79 | 484 | 489 | 113.8 |
| D | 8 | 195 | 393062 | 3439.2 | 482 | 471 | 114.2 |
| D | 1 | 52 | 236848 | 2070.72 | 482 | 471 | 114.2 |
| D | 12 | 233 | 29918 | 257.96 | 482 | 471 | 114.2 |
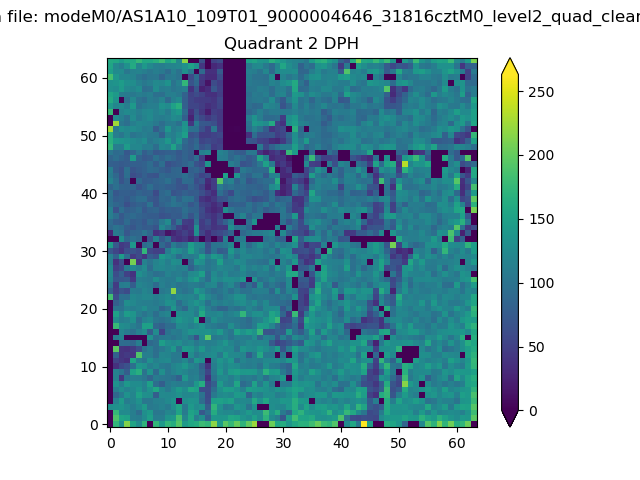
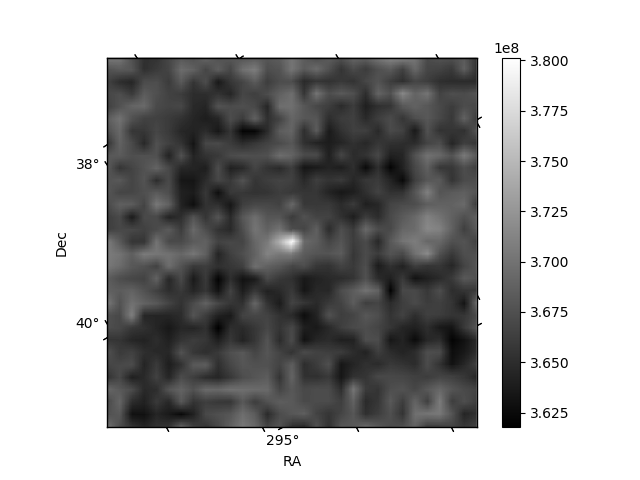
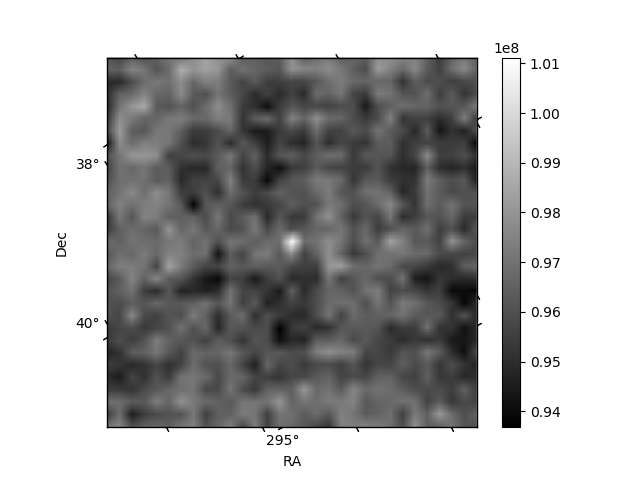
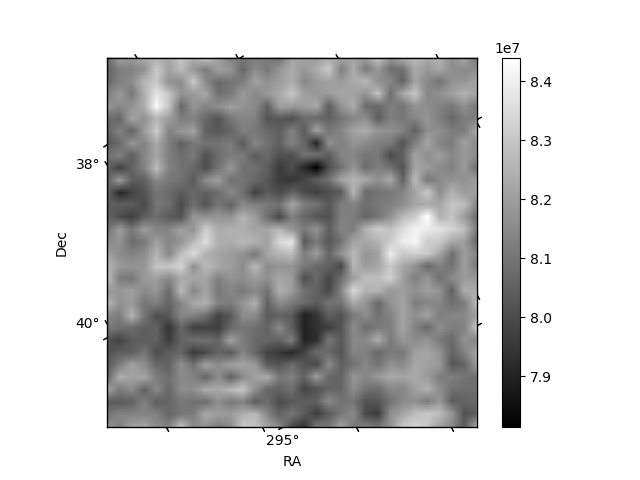
Histogram calculated using DETX and DETY for each event in the final _common_clean file
| Quadrant A | 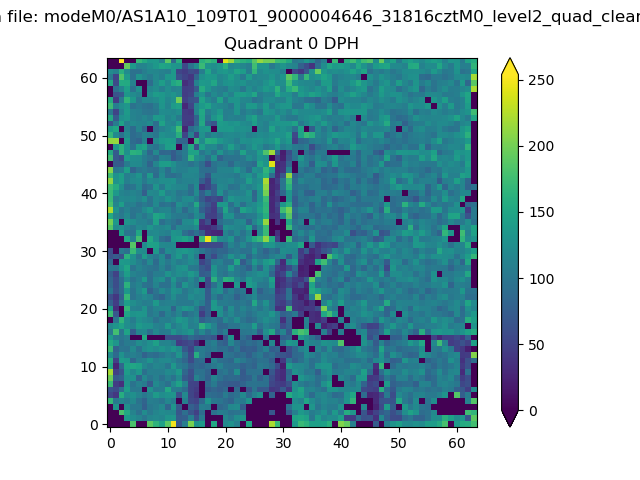 |
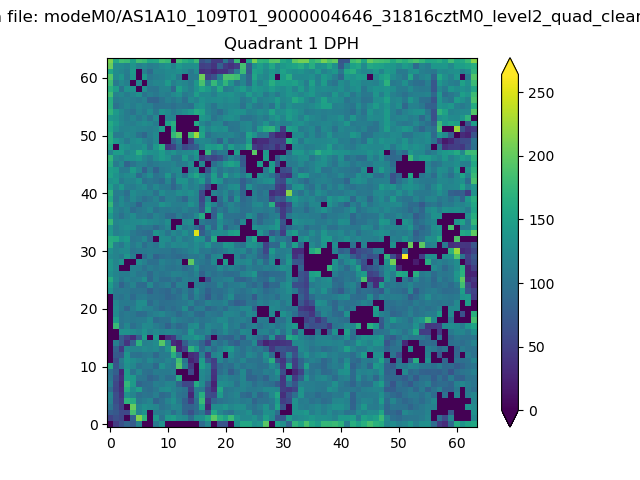 |
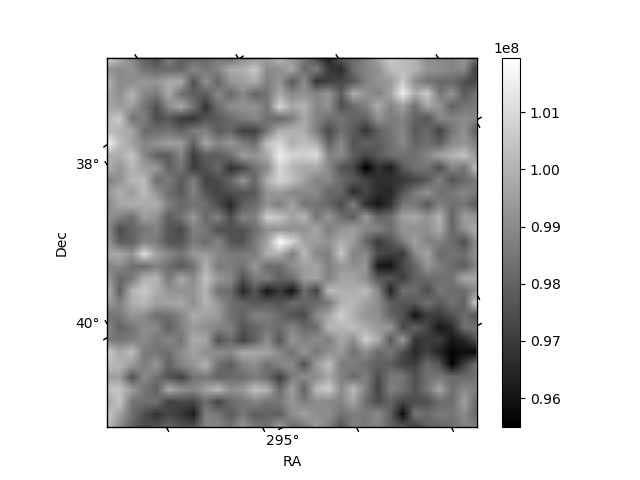
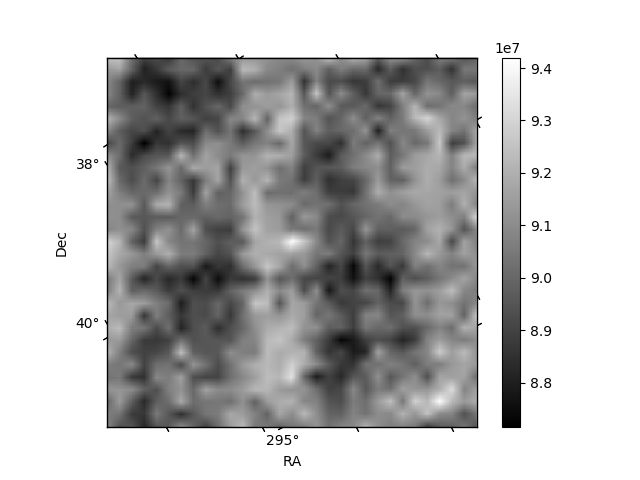
Quadrant B |
|---|---|---|---|
| Quadrant D | 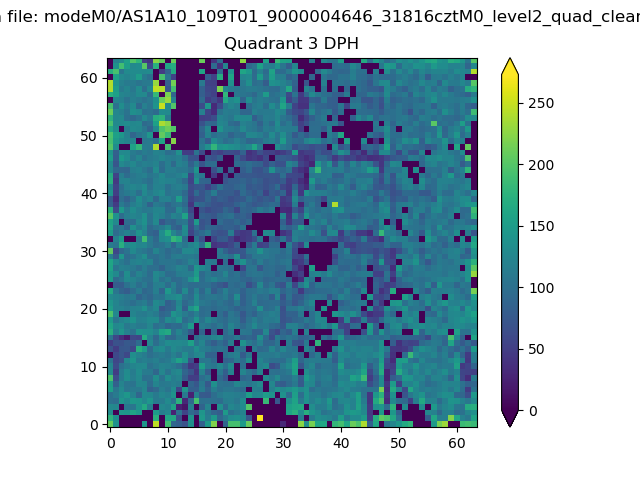 |
 |
Quadrant C |
| Plot type | Count rate plots | Images |
|---|---|---|
| Comparison with Poisson distribution Blue bars denote a histogram of data divided into 1 sec bins. Red curve is a Poisson curve with rate = median count rate of data. |
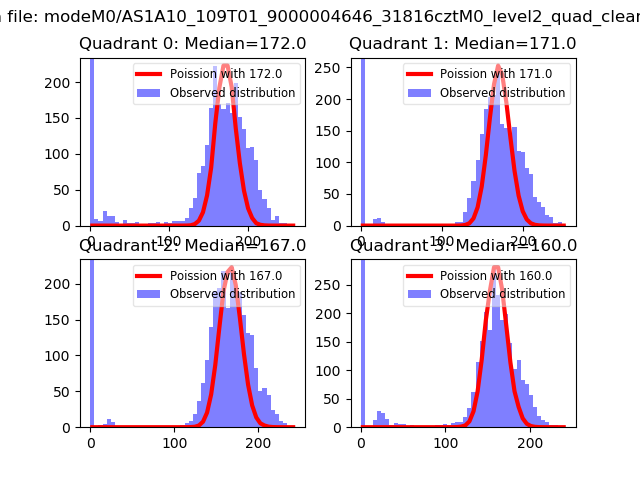 |
 |
| Quadrant-wise count rates Data is divided into 100 sec bins |
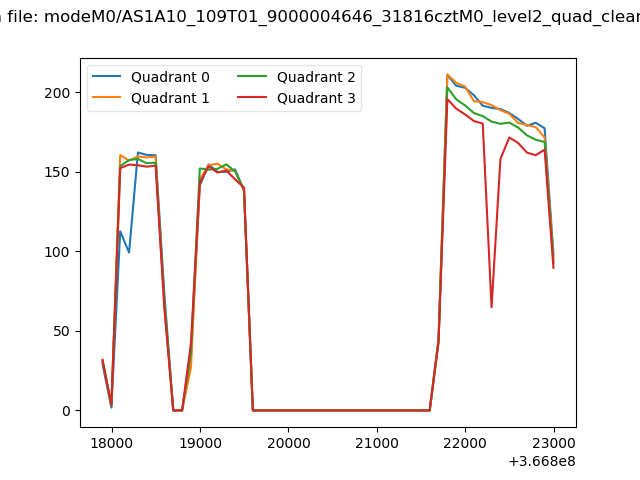 |
|
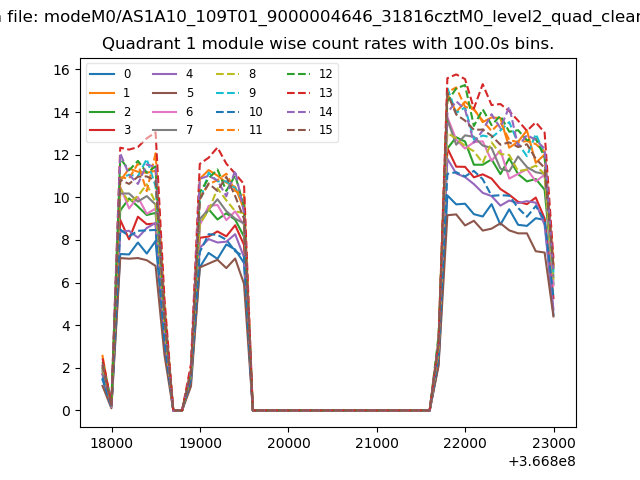
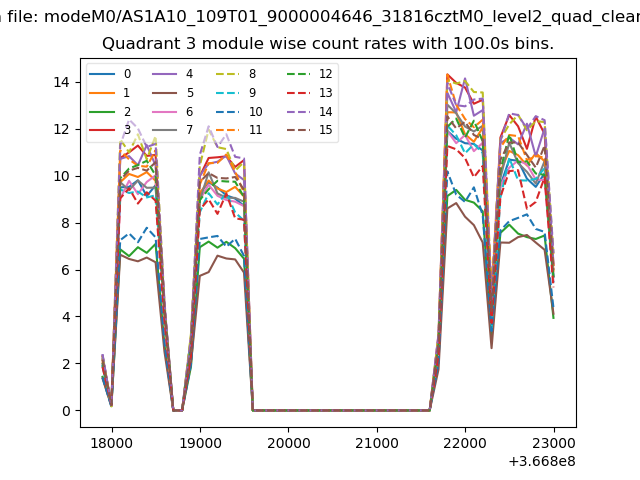
| Module-wise count rates for Quadrant A Data is divided into 100 sec bins |
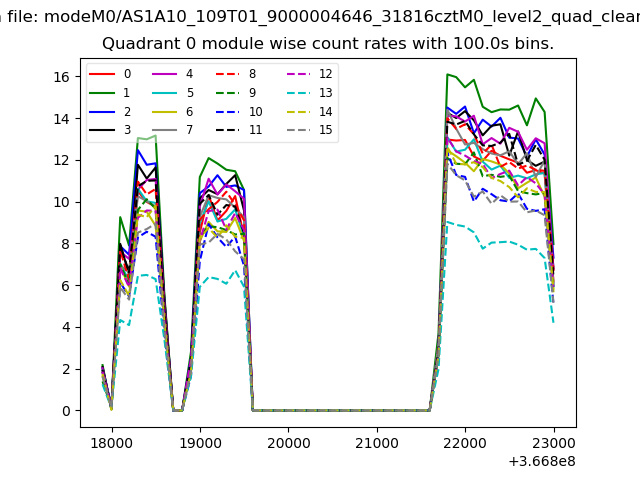 |
 |
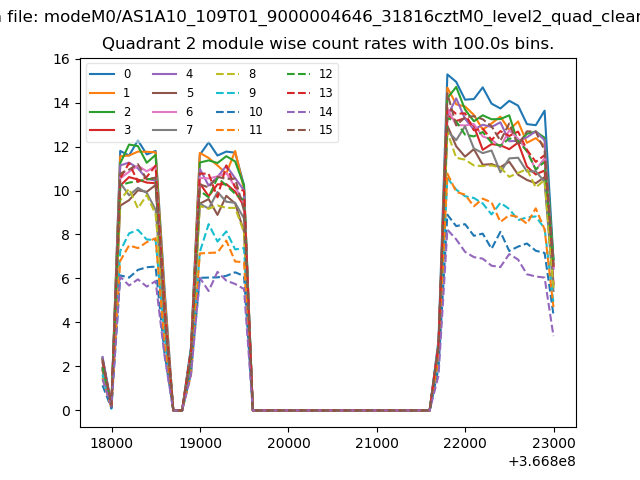
| Module-wise count rates for Quadrant B Data is divided into 100 sec bins |
 |
 |
| Module-wise count rates for Quadrant C Data is divided into 100 sec bins |
 |
 |
| Module-wise count rates for Quadrant D Data is divided into 100 sec bins |
 |
 |
| Parameter | Plot |
|---|---|
| CZT HV Monitor | 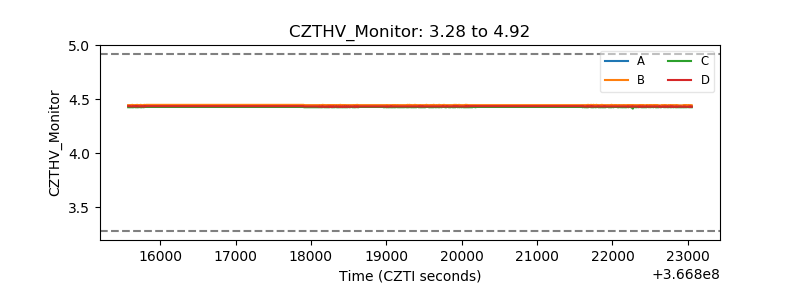 |
| D_VDD | 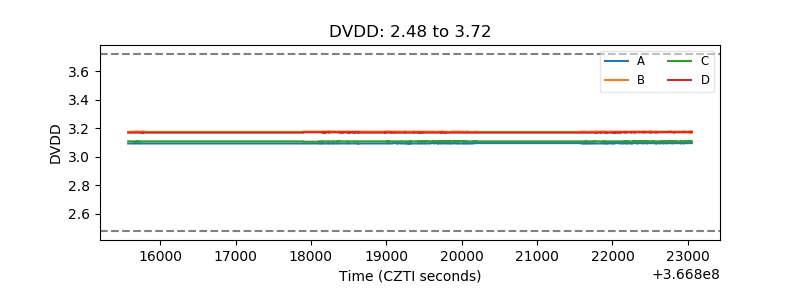 |
| Temperature 1 | 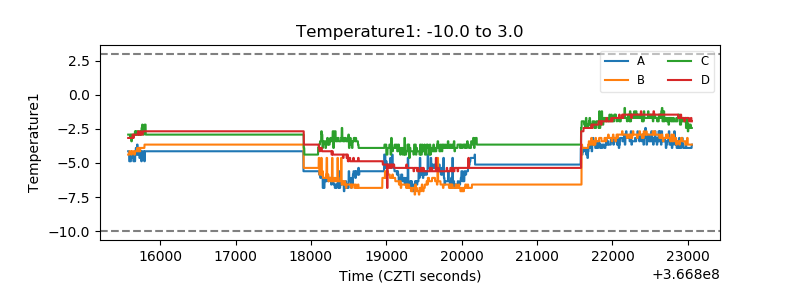 |
| Veto HV Monitor |  |
| Veto LLD | 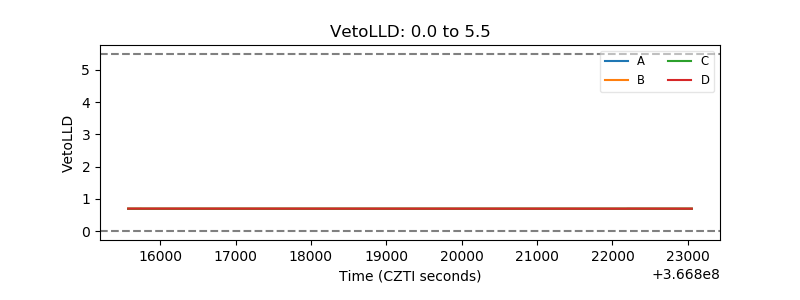 |
| Alpha Counter | 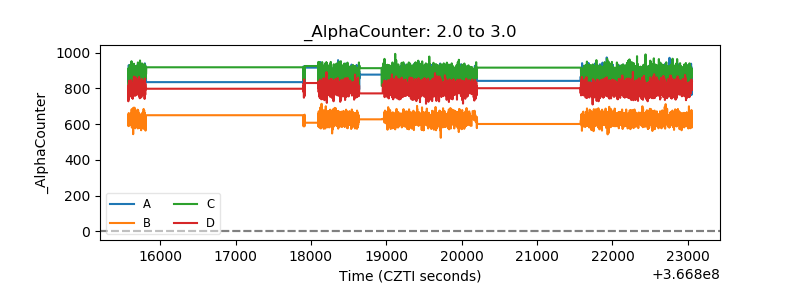 |
| _CPM_Rate | 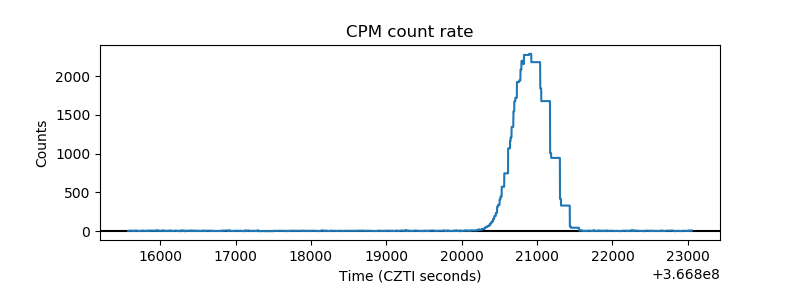 |
| CZT Counter | 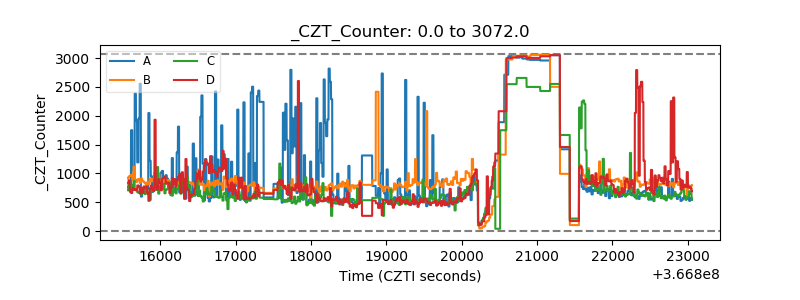 |
| +2.5 Volts monitor | 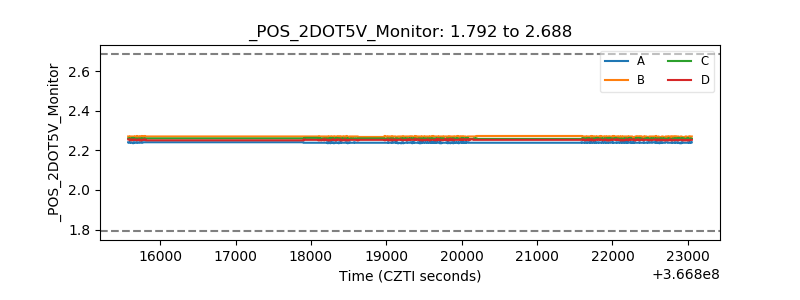 |
| +5 Volts monitor |  |
| _ROLL_ROT | 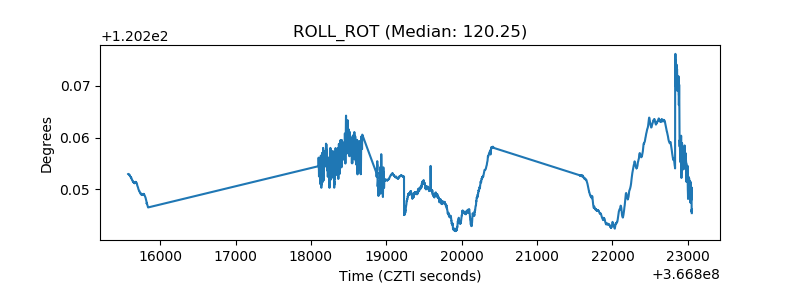 |
| _Roll_DEC | 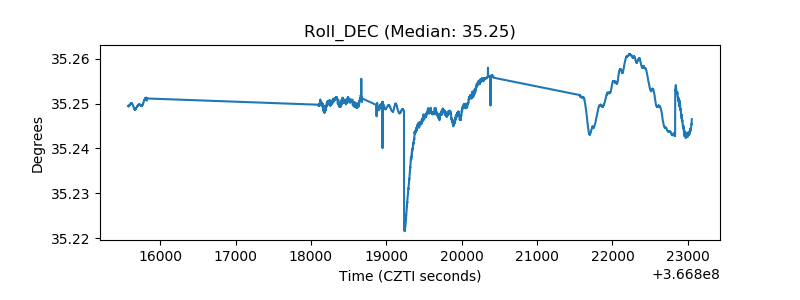 |
| _Roll_RA | 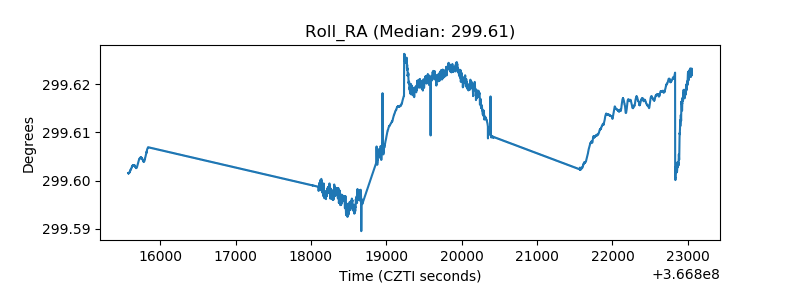 |
| Veto Counter | 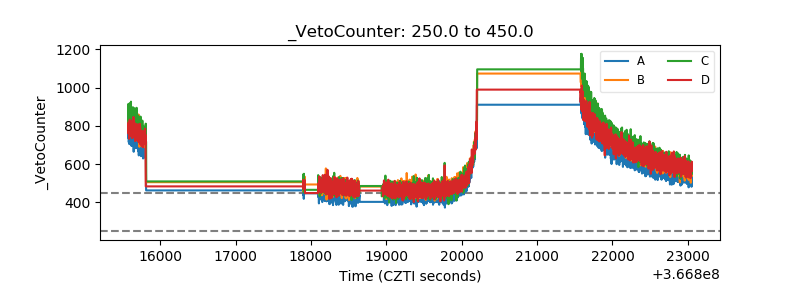 |