| Param | Original file | Final file |
|---|---|---|
| Filename | modeM0/AS1A10_109T01_9000004646_31817cztM0_level2.evt | modeM0/AS1A10_109T01_9000004646_31817cztM0_level2_quad_clean.evt |
| Size (bytes) | 1,034,671,680 | 187,038,720 |
| Size | 986.7 MB | 178.4 MB |
| Events in quadrant A | 9,310,354 | 1,212,103 |
| Events in quadrant B | 8,183,922 | 1,306,569 |
| Events in quadrant C | 6,174,486 | 1,259,385 |
| Events in quadrant D | 7,016,305 | 1,217,460 |
| Mode SS | |||
|---|---|---|---|
| Quadrant | BADHDUFLAG | Total packets | Discarded packets |
| A | 0 | 210 | 12 |
| B | 0 | 210 | 12 |
| C | 0 | 211 | 15 |
| D | 0 | 211 | 11 |
| Mode M0 | |||
|---|---|---|---|
| Quadrant | BADHDUFLAG | Total packets | Discarded packets |
| A | 0 | 35466 | 1225 |
| B | 0 | 32536 | 1970 |
| C | 0 | 25915 | 1208 |
| D | 0 | 28840 | 1660 |
| Mode M9 | |||
|---|---|---|---|
| Quadrant | BADHDUFLAG | Total packets | Discarded packets |
| A | 0 | 26 | 0 |
| B | 0 | 26 | 0 |
| C | 0 | 26 | 0 |
| D | 0 | 26 | 0 |
| Quadrant | Total seconds | Saturated seconds | Saturation percentage |
|---|---|---|---|
| A | 9666 | 1712 | 17.711566% |
| B | 9629 | 376 | 3.904871% |
| C | 9667 | 512 | 5.296369% |
| D | 9637 | 302 | 3.133755% |
Noise dominated data is calculated using 1-second bins in cleaned event files. If a bin has >2000 counts, and if more than 50% of those come from <1% of pixels, then it is considered to be noise-dominated and hence unusable.
| Quadrant | # 1 sec bins | Bins with >0 counts | Bins with >2000 counts | High rate bins dominated by noise | Noise dominated (total time) | Noise dominated (detector-on time) | Marked lightcurve |
|---|---|---|---|---|---|---|---|
| A | 12879 | 9737 | 1084 | 1084 | 8.42% | 11.13% | 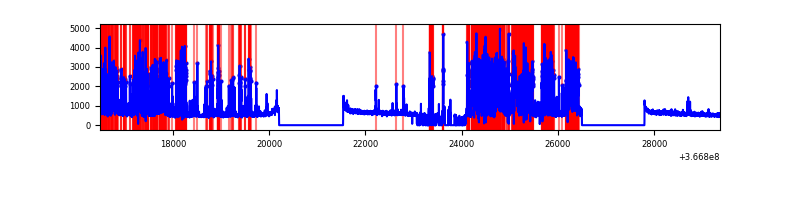 |
| B | 12879 | 9695 | 27 | 27 | 0.21% | 0.28% | 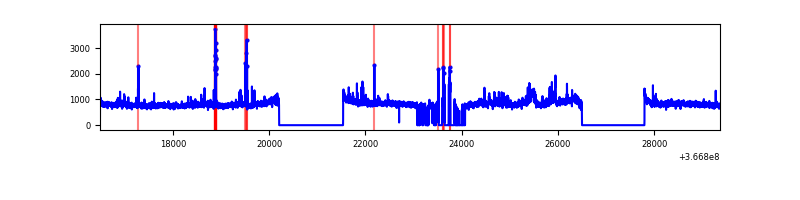 |
| C | 12879 | 9745 | 142 | 142 | 1.10% | 1.46% | 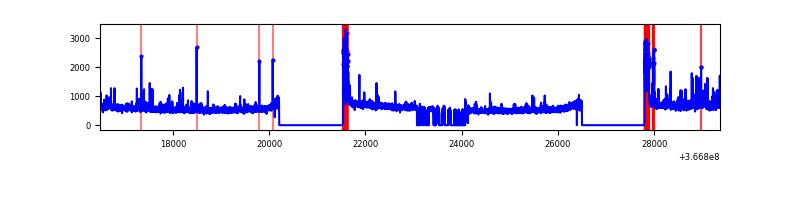 |
| D | 12879 | 9710 | 122 | 122 | 0.95% | 1.26% | 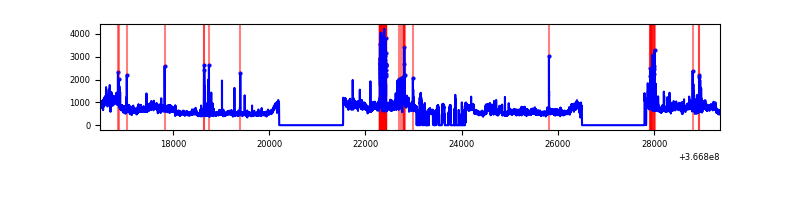 |
Top three noisy pixels from each quadrant. If the there are fewer than three noisy pixels in the level2.evt file, extra rows are filled as -1
| Pixel properties | Quadrant properties | ||||||
|---|---|---|---|---|---|---|---|
| Quadrant | DetID | PixID | Counts | Sigma | Mean | Median | Sigma |
| A | 0 | 13 | 4383673 | 17499.57 | 1276 | 1257 | 250.4 |
| A | 13 | 254 | 16414 | 60.52 | 1276 | 1257 | 250.4 |
| A | 3 | 137 | 11729 | 41.82 | 1276 | 1257 | 250.4 |
| B | 6 | 159 | 2509603 | 10055.63 | 1332 | 1302 | 249.4 |
| B | 10 | 245 | 420151 | 1679.14 | 1332 | 1302 | 249.4 |
| B | 12 | 111 | 29061 | 111.28 | 1332 | 1302 | 249.4 |
| C | 0 | 10 | 623312 | 2068.94 | 1298 | 1313 | 300.6 |
| C | 14 | 238 | 227290 | 751.66 | 1298 | 1313 | 300.6 |
| C | 3 | 233 | 205670 | 679.75 | 1298 | 1313 | 300.6 |
| D | 8 | 195 | 1483082 | 4747.83 | 1325 | 1298 | 312.1 |
| D | 1 | 52 | 239353 | 762.76 | 1325 | 1298 | 312.1 |
| D | 12 | 218 | 112621 | 356.69 | 1325 | 1298 | 312.1 |
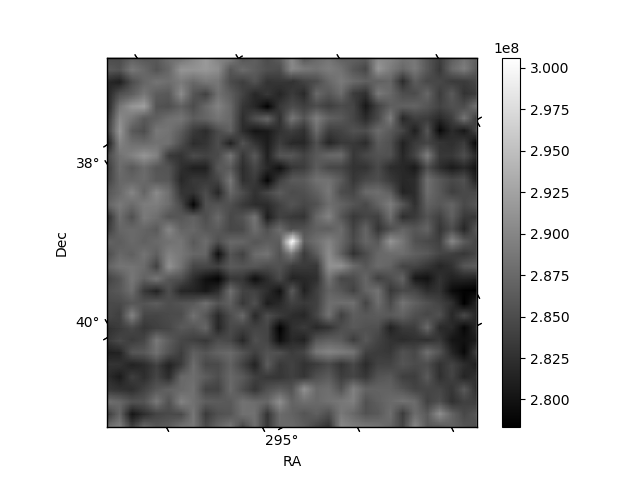
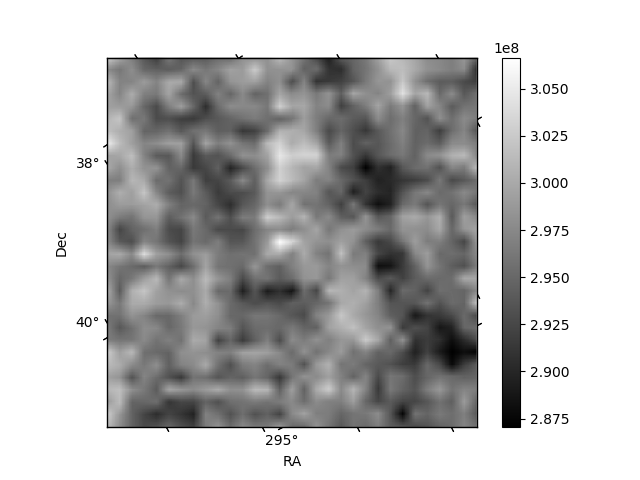
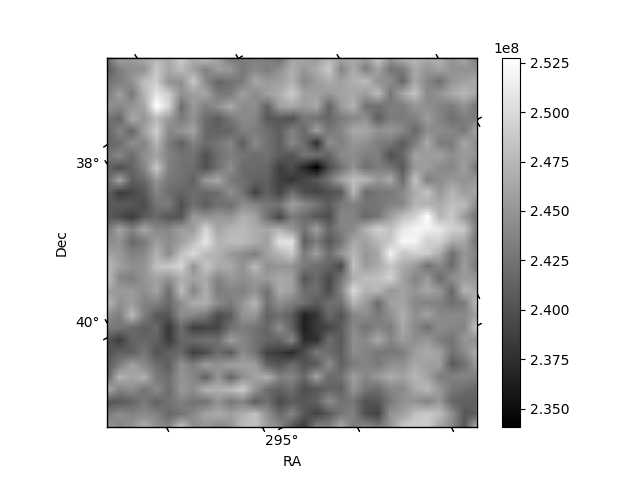
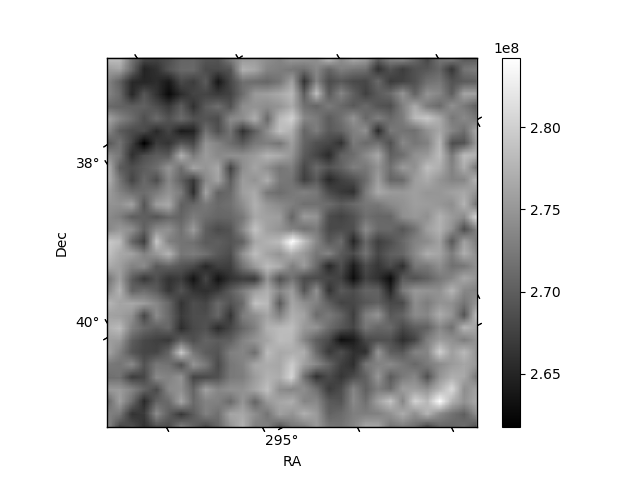
Histogram calculated using DETX and DETY for each event in the final _common_clean file
| Quadrant A | 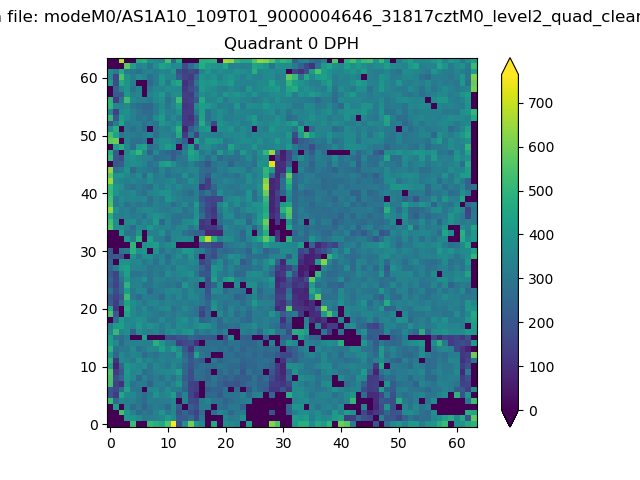 |
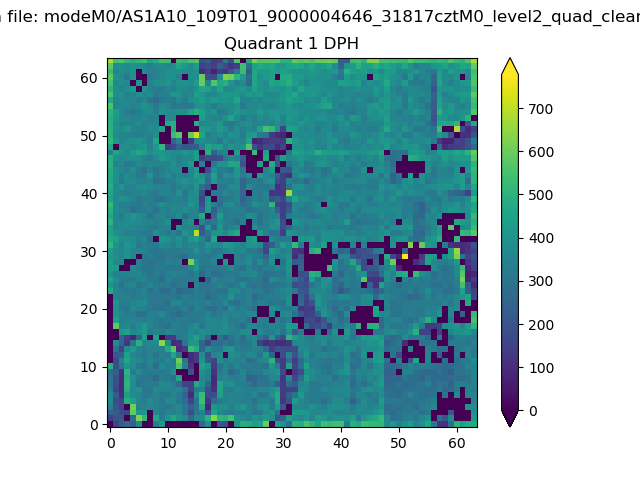 |
Quadrant B |
|---|---|---|---|
| Quadrant D | 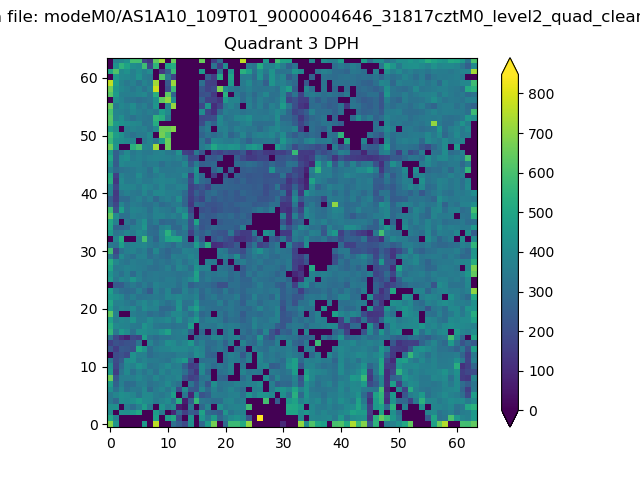 |
 |
Quadrant C |
| Plot type | Count rate plots | Images |
|---|---|---|
| Comparison with Poisson distribution Blue bars denote a histogram of data divided into 1 sec bins. Red curve is a Poisson curve with rate = median count rate of data. |
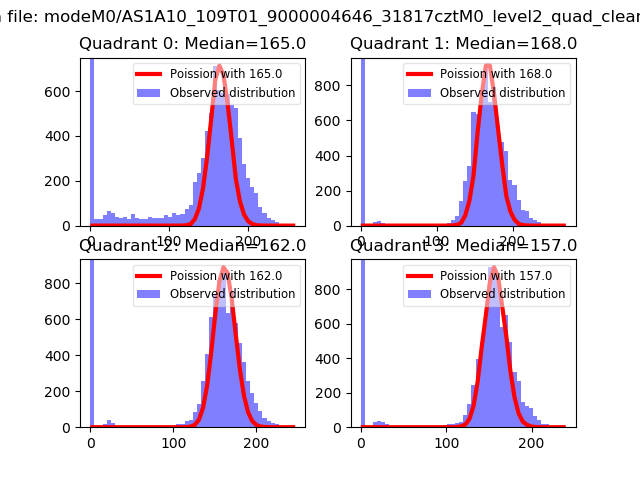 |
 |
| Quadrant-wise count rates Data is divided into 100 sec bins |
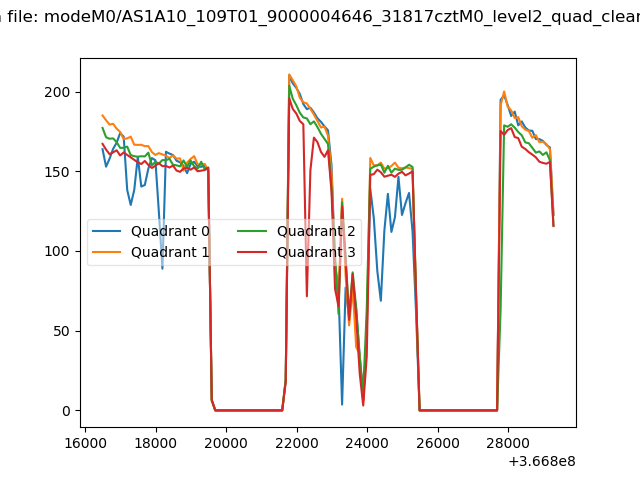 |
|
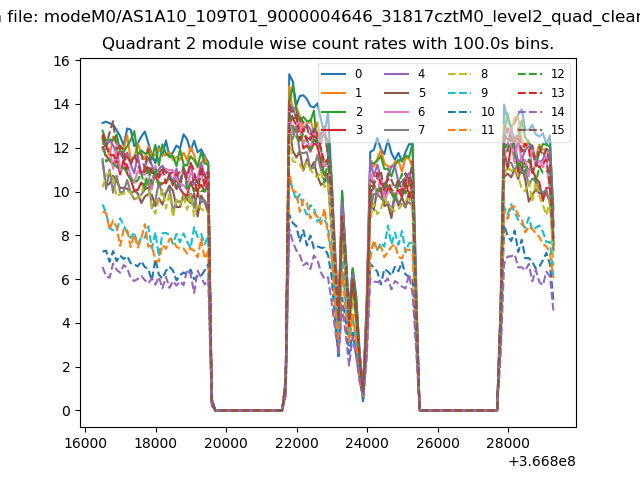
| Module-wise count rates for Quadrant A Data is divided into 100 sec bins |
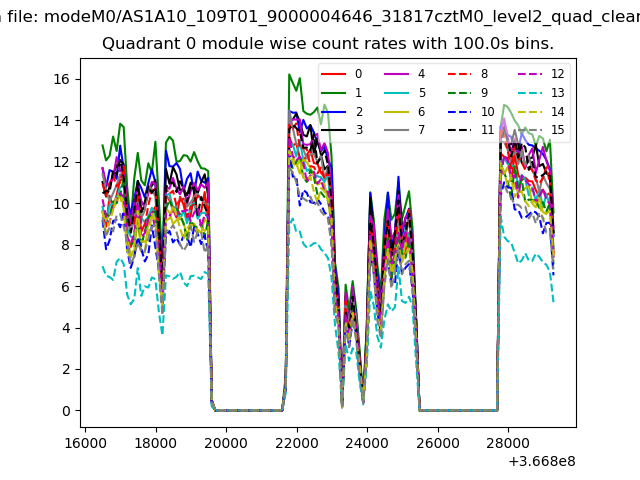 |
 |
| Module-wise count rates for Quadrant B Data is divided into 100 sec bins |
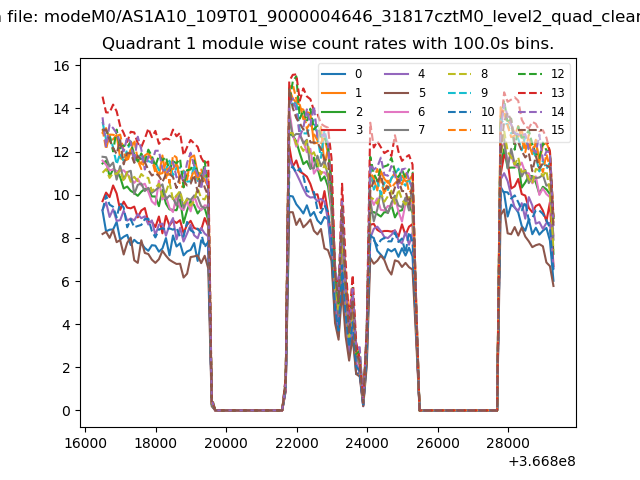 |
 |
| Module-wise count rates for Quadrant C Data is divided into 100 sec bins |
 |
 |
| Module-wise count rates for Quadrant D Data is divided into 100 sec bins |
 |
 |
| Parameter | Plot |
|---|---|
| CZT HV Monitor | 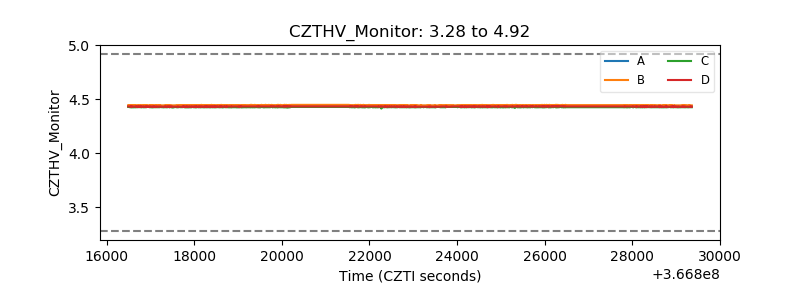 |
| D_VDD | 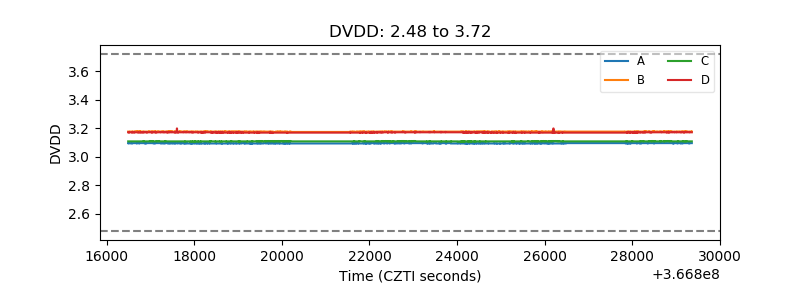 |
| Temperature 1 | 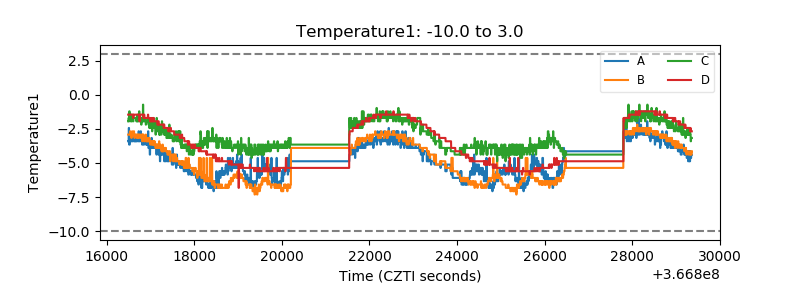 |
| Veto HV Monitor | 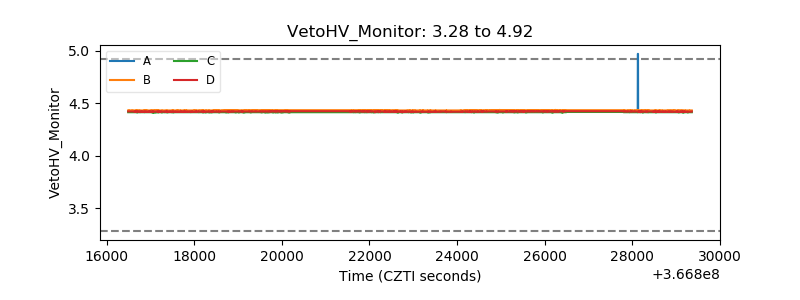 |
| Veto LLD | 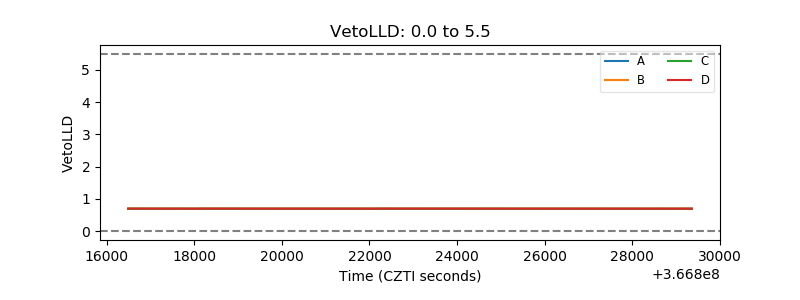 |
| Alpha Counter | 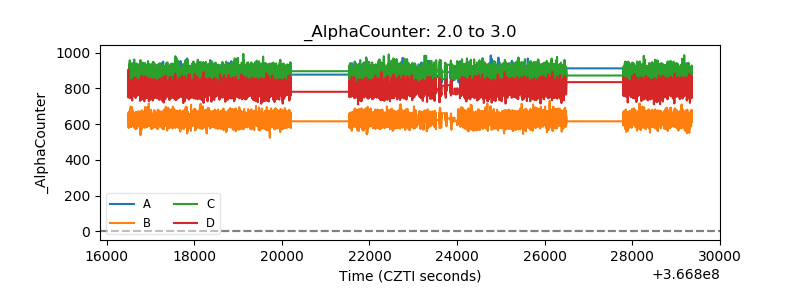 |
| _CPM_Rate | 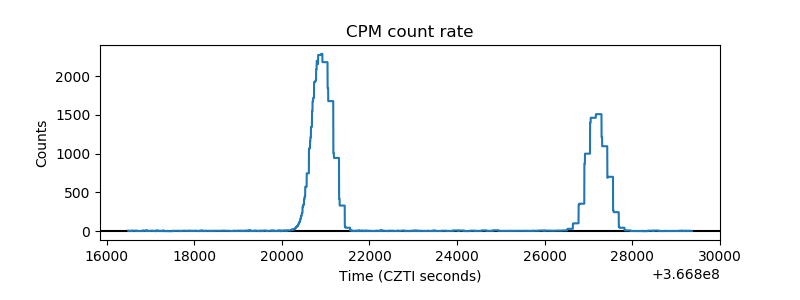 |
| CZT Counter |  |
| +2.5 Volts monitor |  |
| +5 Volts monitor |  |
| _ROLL_ROT |  |
| _Roll_DEC |  |
| _Roll_RA |  |
| Veto Counter |  |