| Param | Original file | Final file |
|---|---|---|
| Filename | modeM0/AS1A10_109T01_9000004646_31818cztM0_level2.evt | modeM0/AS1A10_109T01_9000004646_31818cztM0_level2_quad_clean.evt |
| Size (bytes) | 619,087,680 | 115,099,200 |
| Size | 590.4 MB | 109.8 MB |
| Events in quadrant A | 3,439,983 | 792,191 |
| Events in quadrant B | 5,469,700 | 785,508 |
| Events in quadrant C | 4,400,012 | 737,894 |
| Events in quadrant D | 5,007,465 | 724,363 |
| Mode SS | |||
|---|---|---|---|
| Quadrant | BADHDUFLAG | Total packets | Discarded packets |
| A | 0 | 132 | 0 |
| B | 0 | 132 | 0 |
| C | 0 | 132 | 0 |
| D | 0 | 132 | 0 |
| Mode M0 | |||
|---|---|---|---|
| Quadrant | BADHDUFLAG | Total packets | Discarded packets |
| A | 0 | 14238 | 2 |
| B | 0 | 20620 | 2 |
| C | 0 | 17525 | 2 |
| D | 0 | 19221 | 2 |
| Mode M9 | |||
|---|---|---|---|
| Quadrant | BADHDUFLAG | Total packets | Discarded packets |
| A | 0 | 19 | 0 |
| B | 0 | 19 | 0 |
| C | 0 | 19 | 0 |
| D | 0 | 20 | 0 |
| Quadrant | Total seconds | Saturated seconds | Saturation percentage |
|---|---|---|---|
| A | 6384 | 84 | 1.315789% |
| B | 6384 | 331 | 5.184837% |
| C | 6384 | 395 | 6.187343% |
| D | 6384 | 288 | 4.511278% |
Noise dominated data is calculated using 1-second bins in cleaned event files. If a bin has >2000 counts, and if more than 50% of those come from <1% of pixels, then it is considered to be noise-dominated and hence unusable.
| Quadrant | # 1 sec bins | Bins with >0 counts | Bins with >2000 counts | High rate bins dominated by noise | Noise dominated (total time) | Noise dominated (detector-on time) | Marked lightcurve |
|---|---|---|---|---|---|---|---|
| A | 7554 | 6385 | 2 | 2 | 0.03% | 0.03% | 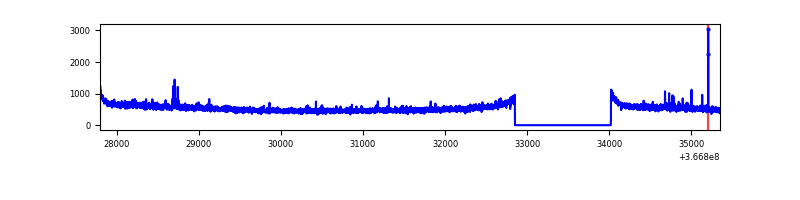 |
| B | 7554 | 6385 | 147 | 147 | 1.95% | 2.30% | 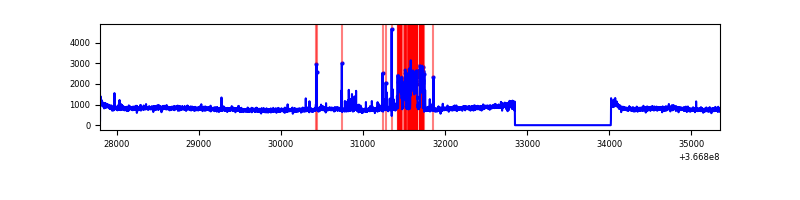 |
| C | 7554 | 6385 | 128 | 128 | 1.69% | 2.00% | 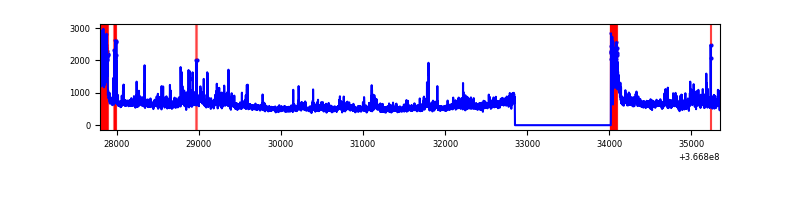 |
| D | 7554 | 6385 | 231 | 231 | 3.06% | 3.62% | 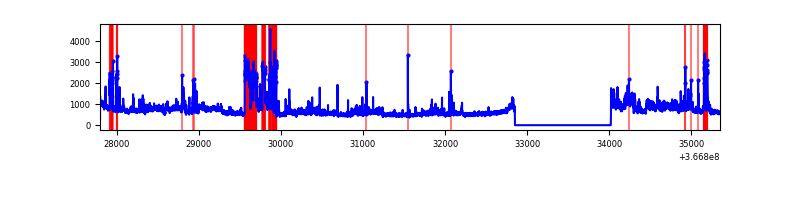 |
Top three noisy pixels from each quadrant. If the there are fewer than three noisy pixels in the level2.evt file, extra rows are filled as -1
| Pixel properties | Quadrant properties | ||||||
|---|---|---|---|---|---|---|---|
| Quadrant | DetID | PixID | Counts | Sigma | Mean | Median | Sigma |
| A | 0 | 13 | 44019 | 248.67 | 877 | 865 | 173.5 |
| A | 13 | 254 | 12790 | 68.72 | 877 | 865 | 173.5 |
| A | 13 | 6 | 9984 | 52.55 | 877 | 865 | 173.5 |
| B | 6 | 159 | 1659592 | 10288.16 | 852 | 831 | 161.2 |
| B | 10 | 245 | 458357 | 2837.72 | 852 | 831 | 161.2 |
| B | 12 | 111 | 18724 | 110.98 | 852 | 831 | 161.2 |
| C | 0 | 10 | 556362 | 2890.26 | 823 | 829 | 192.2 |
| C | 3 | 233 | 434958 | 2258.63 | 823 | 829 | 192.2 |
| C | 14 | 238 | 148582 | 768.71 | 823 | 829 | 192.2 |
| D | 8 | 195 | 897632 | 4469.21 | 845 | 827 | 200.7 |
| D | 12 | 218 | 698969 | 3479.18 | 845 | 827 | 200.7 |
| D | 12 | 233 | 73899 | 364.15 | 845 | 827 | 200.7 |
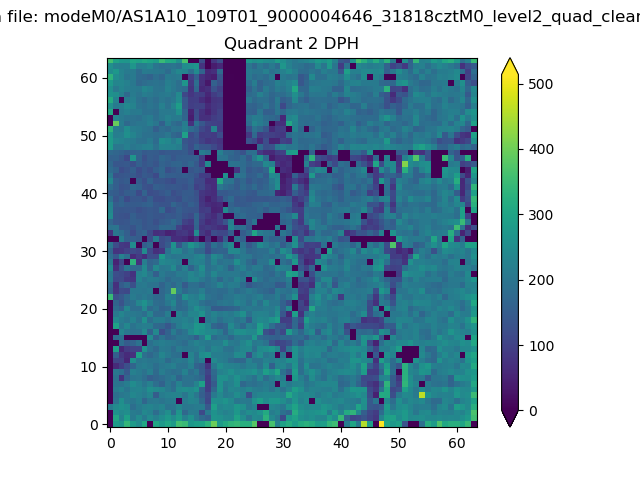
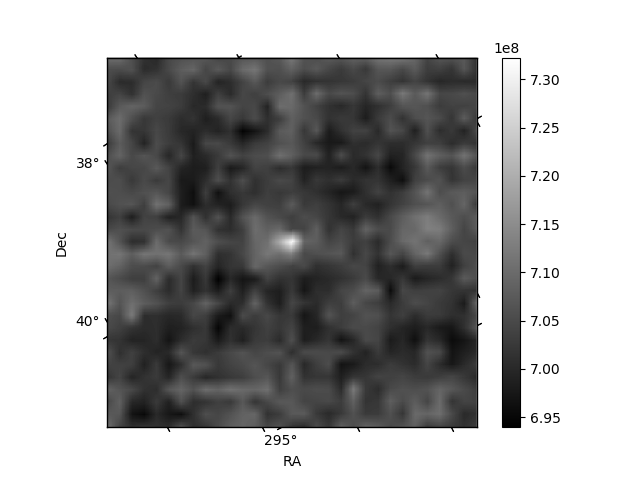
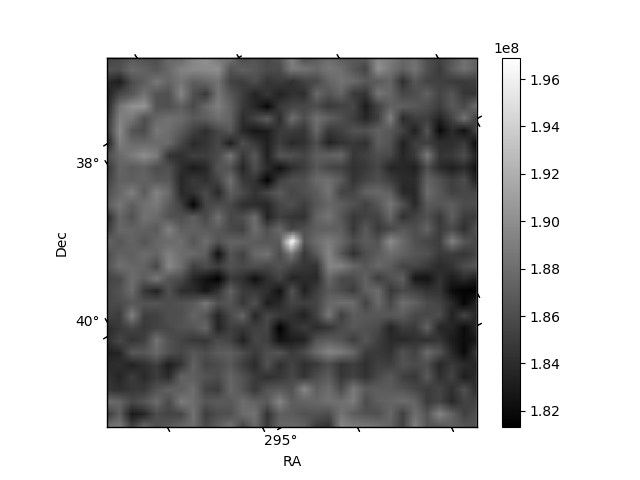
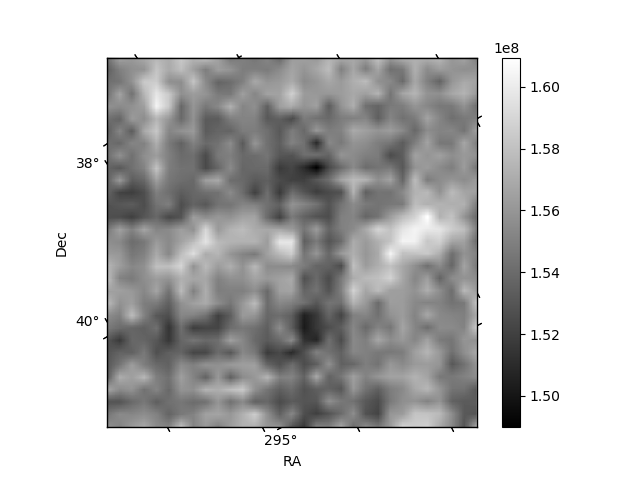
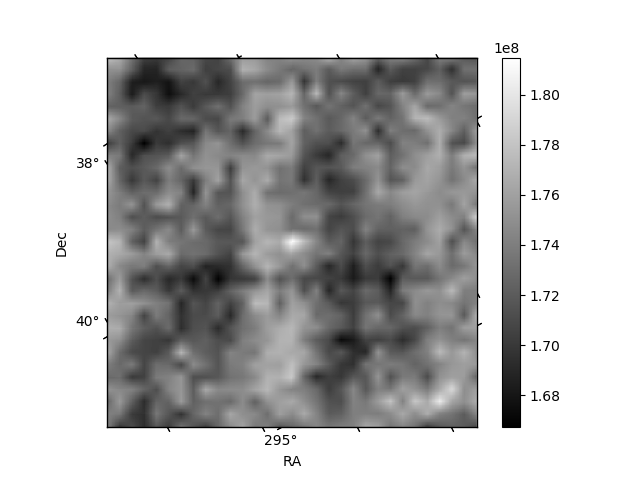
Histogram calculated using DETX and DETY for each event in the final _common_clean file
| Quadrant A | 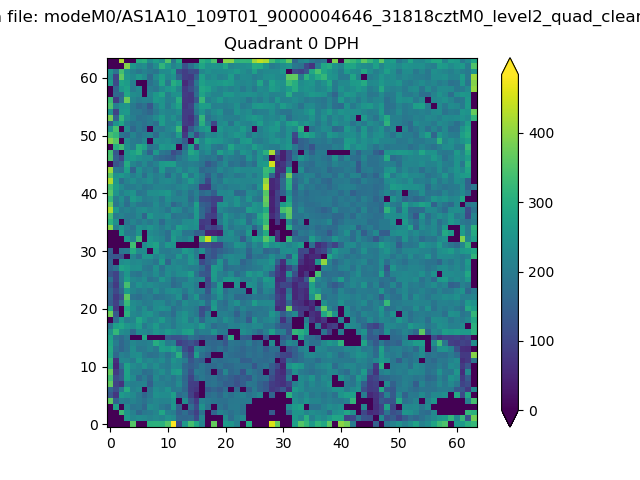 |
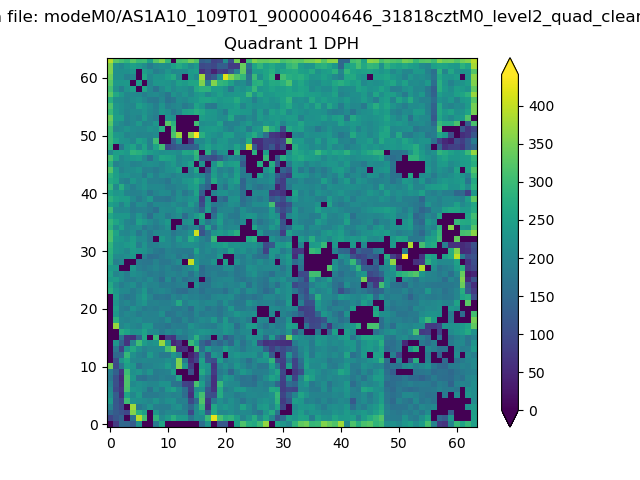 |
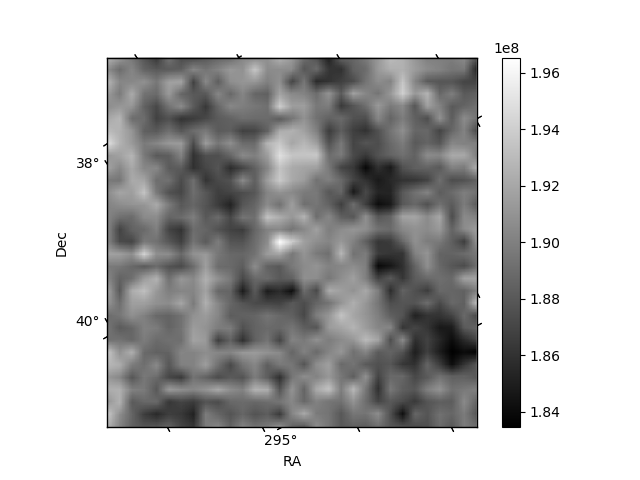
Quadrant B |
|---|---|---|---|
| Quadrant D | 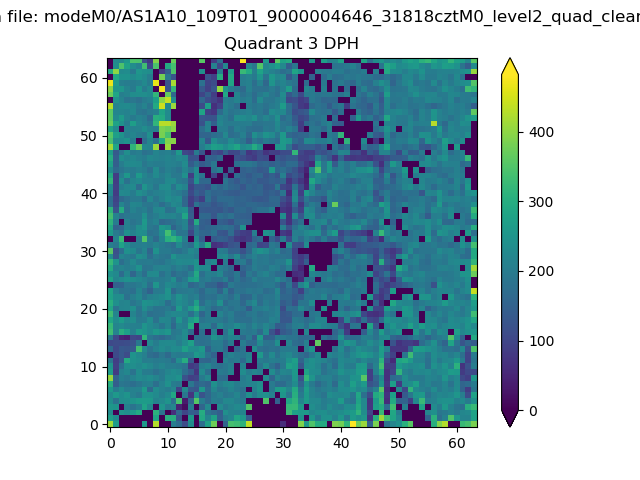 |
 |
Quadrant C |
| Plot type | Count rate plots | Images |
|---|---|---|
| Comparison with Poisson distribution Blue bars denote a histogram of data divided into 1 sec bins. Red curve is a Poisson curve with rate = median count rate of data. |
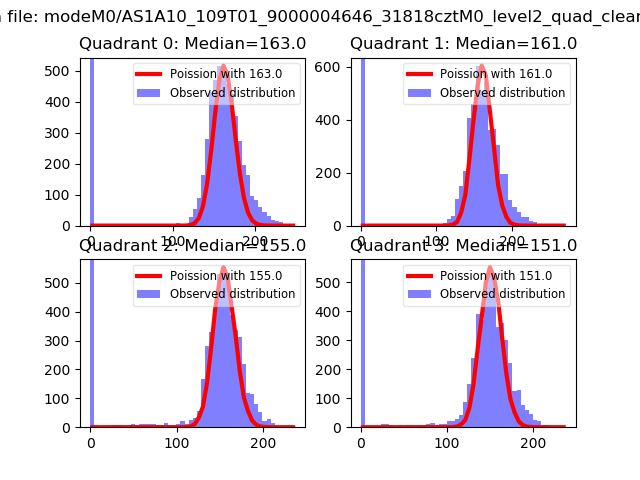 |
 |
| Quadrant-wise count rates Data is divided into 100 sec bins |
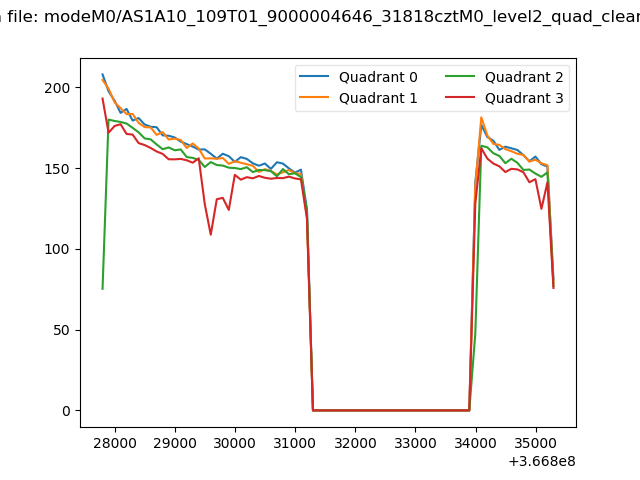 |
|
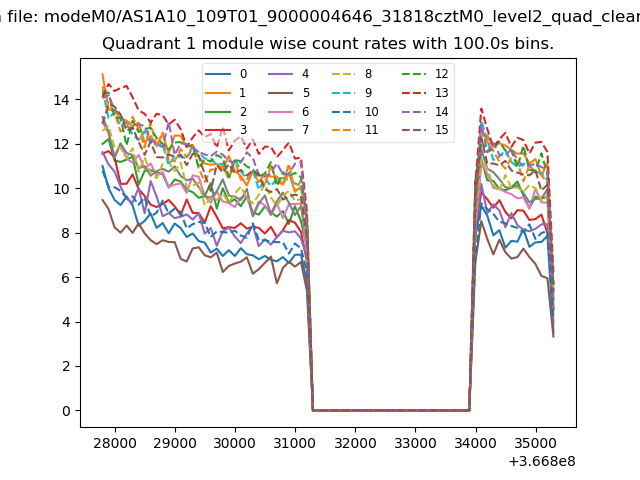
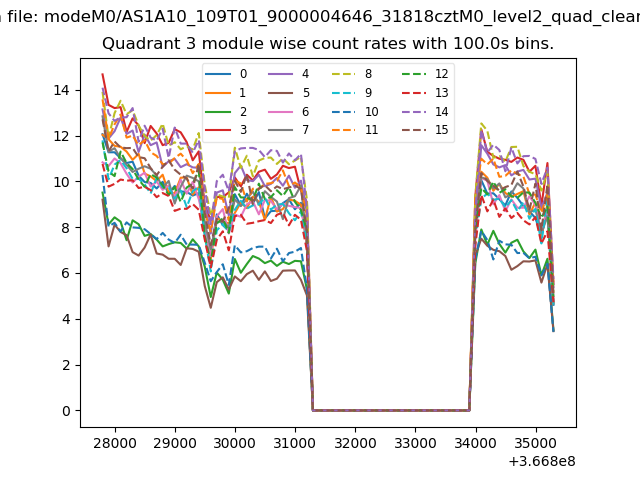
| Module-wise count rates for Quadrant A Data is divided into 100 sec bins |
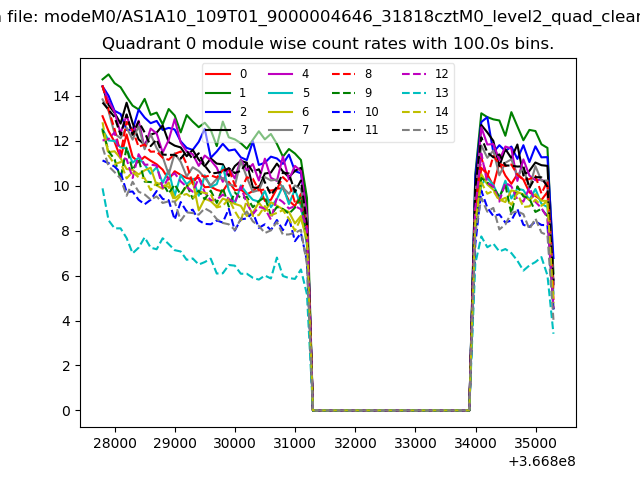 |
 |
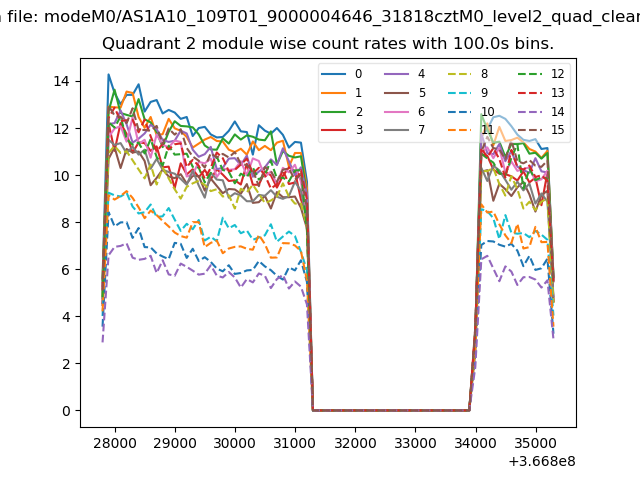
| Module-wise count rates for Quadrant B Data is divided into 100 sec bins |
 |
 |
| Module-wise count rates for Quadrant C Data is divided into 100 sec bins |
 |
 |
| Module-wise count rates for Quadrant D Data is divided into 100 sec bins |
 |
 |
| Parameter | Plot |
|---|---|
| CZT HV Monitor | 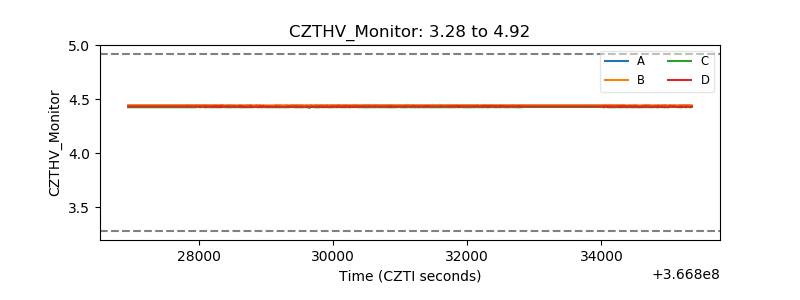 |
| D_VDD | 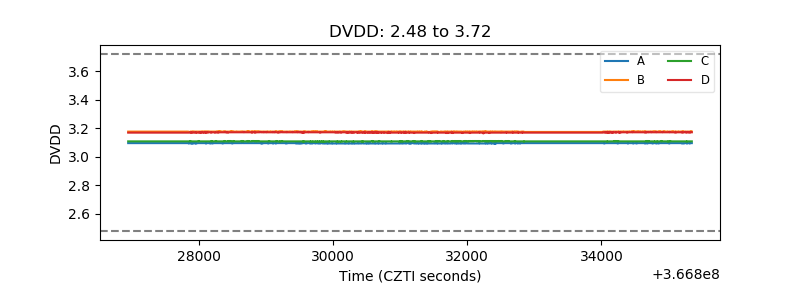 |
| Temperature 1 | 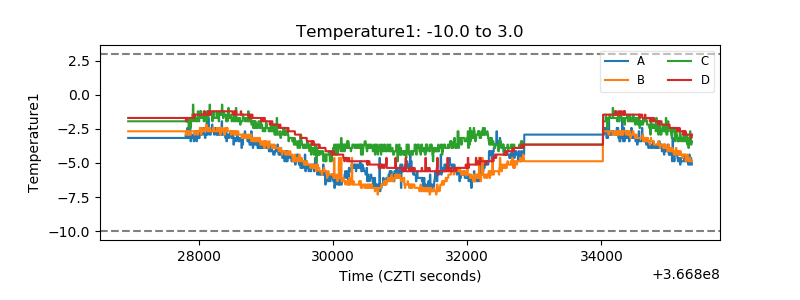 |
| Veto HV Monitor |  |
| Veto LLD | 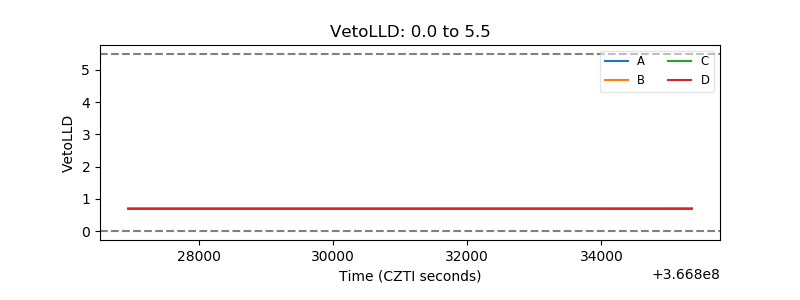 |
| Alpha Counter | 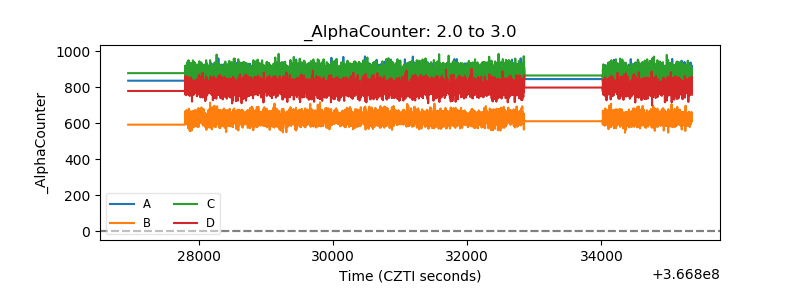 |
| _CPM_Rate | 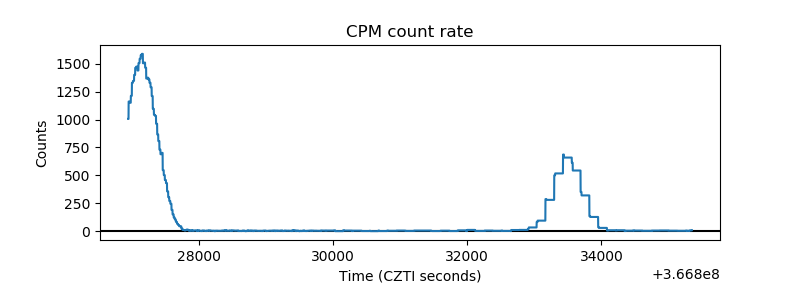 |
| CZT Counter | 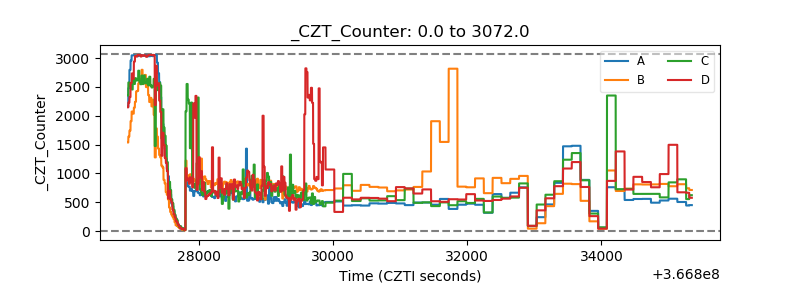 |
| +2.5 Volts monitor | 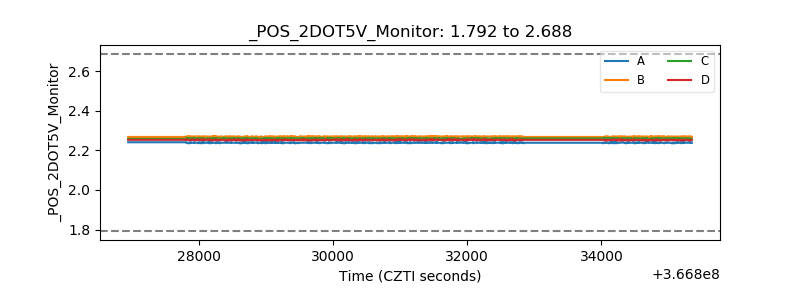 |
| +5 Volts monitor |  |
| _ROLL_ROT | 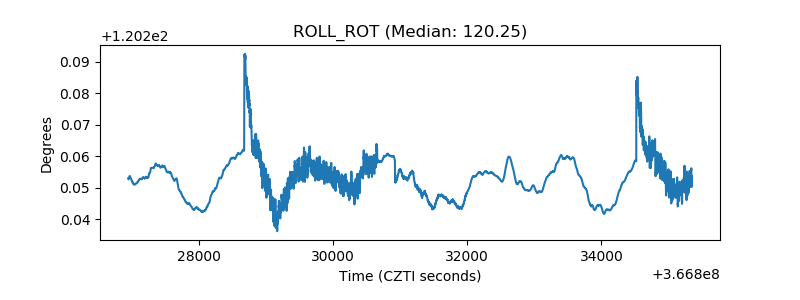 |
| _Roll_DEC | 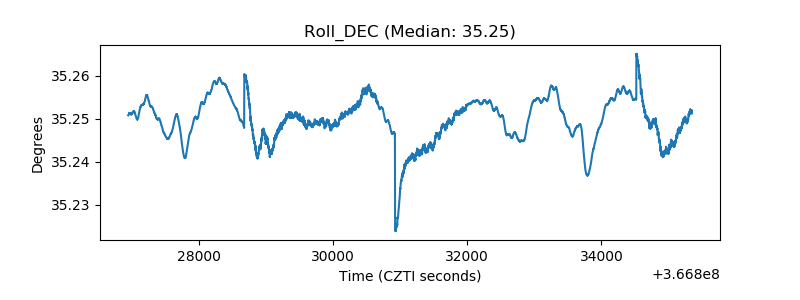 |
| _Roll_RA | 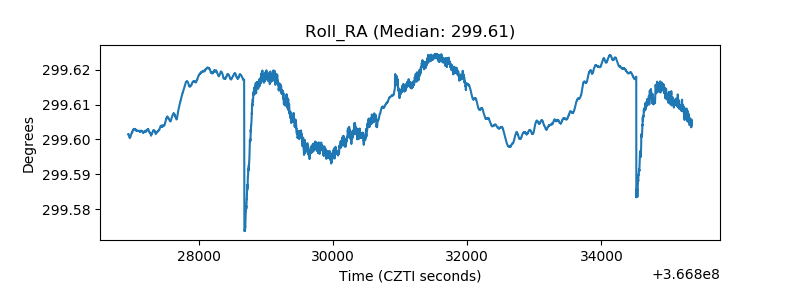 |
| Veto Counter | 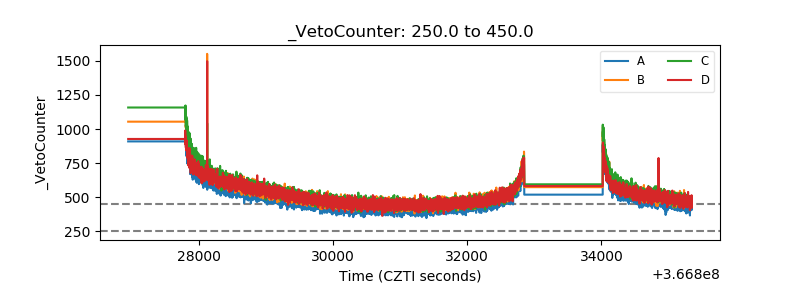 |