| Param | Original file | Final file |
|---|---|---|
| Filename | modeM0/AS1A10_109T01_9000004646_31819cztM0_level2.evt | modeM0/AS1A10_109T01_9000004646_31819cztM0_level2_quad_clean.evt |
| Size (bytes) | 685,961,280 | 102,490,560 |
| Size | 654.2 MB | 97.7 MB |
| Events in quadrant A | 4,313,189 | 674,206 |
| Events in quadrant B | 6,258,279 | 667,246 |
| Events in quadrant C | 4,659,599 | 646,752 |
| Events in quadrant D | 5,083,931 | 641,030 |
| Mode SS | |||
|---|---|---|---|
| Quadrant | BADHDUFLAG | Total packets | Discarded packets |
| A | 0 | 138 | 0 |
| B | 0 | 138 | 0 |
| C | 0 | 138 | 0 |
| D | 0 | 138 | 0 |
| Mode M0 | |||
|---|---|---|---|
| Quadrant | BADHDUFLAG | Total packets | Discarded packets |
| A | 0 | 17172 | 2 |
| B | 0 | 23426 | 3 |
| C | 0 | 18452 | 2 |
| D | 0 | 19744 | 2 |
| Mode M9 | |||
|---|---|---|---|
| Quadrant | BADHDUFLAG | Total packets | Discarded packets |
| A | 0 | 9 | 0 |
| B | 0 | 9 | 0 |
| C | 0 | 9 | 0 |
| D | 0 | 9 | 0 |
| Quadrant | Total seconds | Saturated seconds | Saturation percentage |
|---|---|---|---|
| A | 6803 | 401 | 5.894458% |
| B | 6802 | 553 | 8.129962% |
| C | 6802 | 441 | 6.483387% |
| D | 6803 | 264 | 3.880641% |
Noise dominated data is calculated using 1-second bins in cleaned event files. If a bin has >2000 counts, and if more than 50% of those come from <1% of pixels, then it is considered to be noise-dominated and hence unusable.
| Quadrant | # 1 sec bins | Bins with >0 counts | Bins with >2000 counts | High rate bins dominated by noise | Noise dominated (total time) | Noise dominated (detector-on time) | Marked lightcurve |
|---|---|---|---|---|---|---|---|
| A | 7653 | 6804 | 217 | 217 | 2.84% | 3.19% | 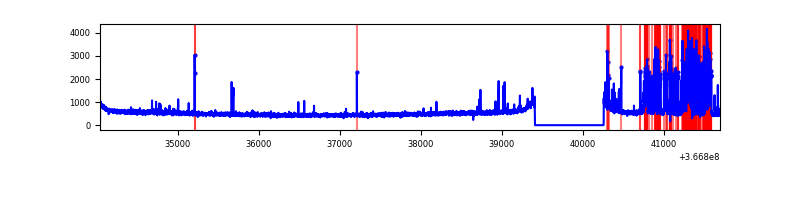 |
| B | 7652 | 6803 | 328 | 328 | 4.29% | 4.82% | 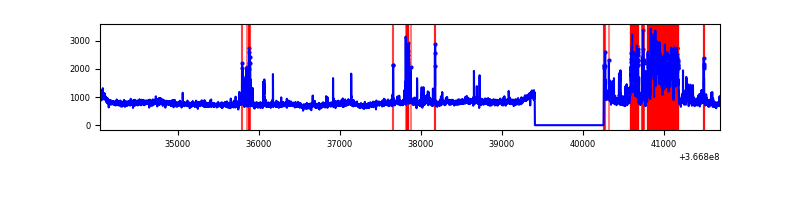 |
| C | 7652 | 6803 | 114 | 114 | 1.49% | 1.68% | 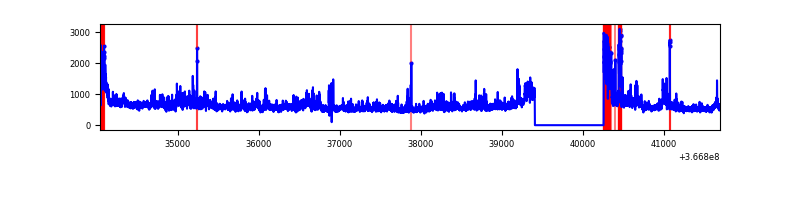 |
| D | 7653 | 6804 | 139 | 139 | 1.82% | 2.04% | 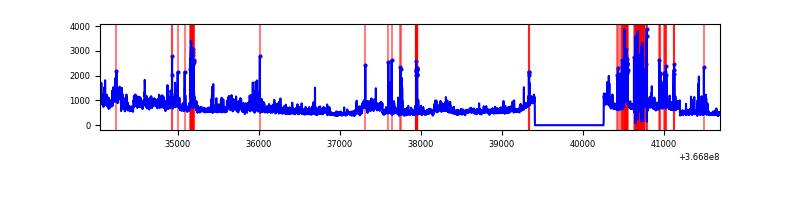 |
Top three noisy pixels from each quadrant. If the there are fewer than three noisy pixels in the level2.evt file, extra rows are filled as -1
| Pixel properties | Quadrant properties | ||||||
|---|---|---|---|---|---|---|---|
| Quadrant | DetID | PixID | Counts | Sigma | Mean | Median | Sigma |
| A | 0 | 13 | 951385 | 5499.69 | 865 | 849 | 172.8 |
| A | 13 | 6 | 14425 | 78.55 | 865 | 849 | 172.8 |
| A | 13 | 254 | 13925 | 75.65 | 865 | 849 | 172.8 |
| B | 6 | 159 | 1757054 | 10772.1 | 850 | 829 | 163.0 |
| B | 10 | 245 | 1128015 | 6913.78 | 850 | 829 | 163.0 |
| B | 12 | 111 | 19580 | 115.01 | 850 | 829 | 163.0 |
| C | 0 | 10 | 631917 | 3227.02 | 830 | 839 | 195.6 |
| C | 3 | 233 | 545110 | 2783.14 | 830 | 839 | 195.6 |
| C | 14 | 238 | 164866 | 838.75 | 830 | 839 | 195.6 |
| D | 8 | 195 | 1151311 | 5664.41 | 850 | 830 | 203.1 |
| D | 12 | 218 | 349662 | 1717.48 | 850 | 830 | 203.1 |
| D | 12 | 233 | 157189 | 769.84 | 850 | 830 | 203.1 |
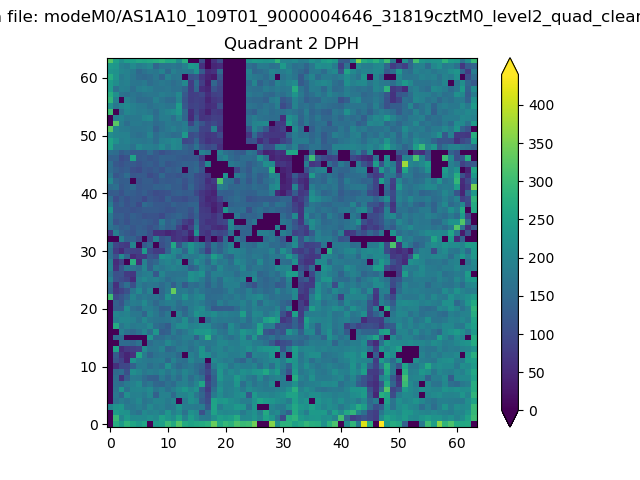
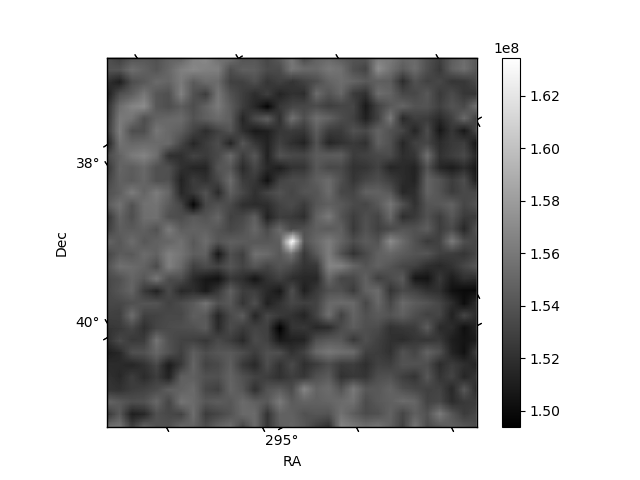
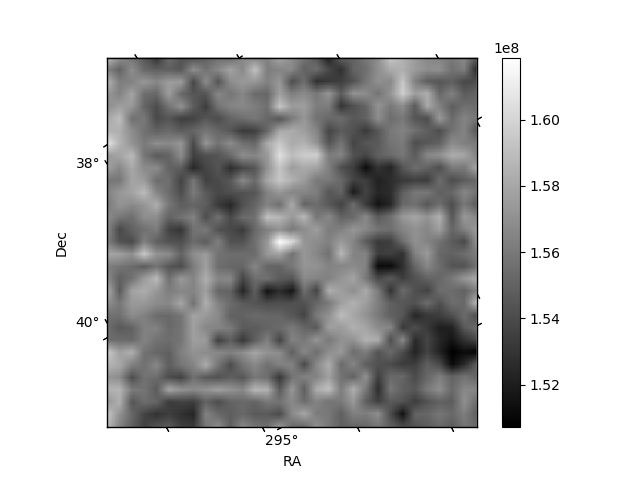
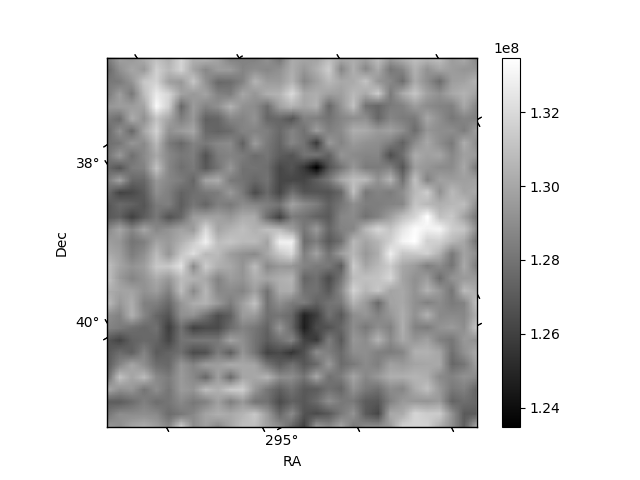
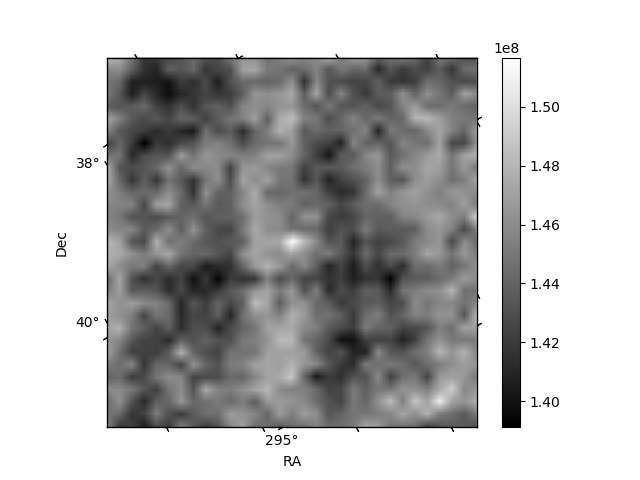
Histogram calculated using DETX and DETY for each event in the final _common_clean file
| Quadrant A | 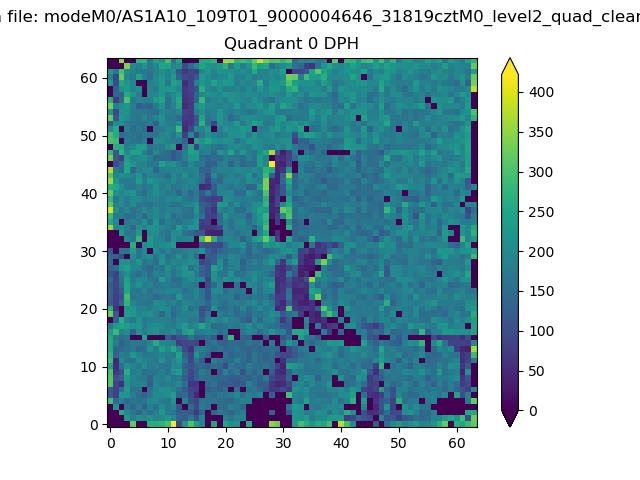 |
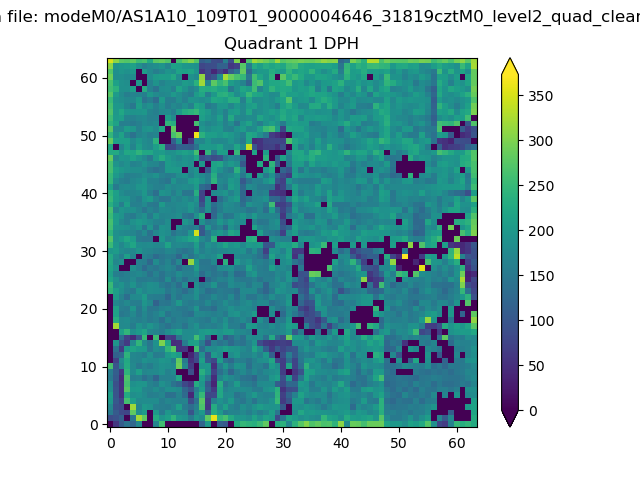 |
Quadrant B |
|---|---|---|---|
| Quadrant D | 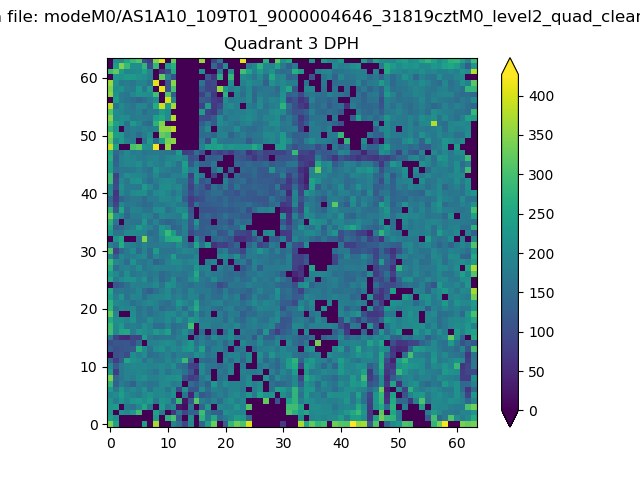 |
 |
Quadrant C |
| Plot type | Count rate plots | Images |
|---|---|---|
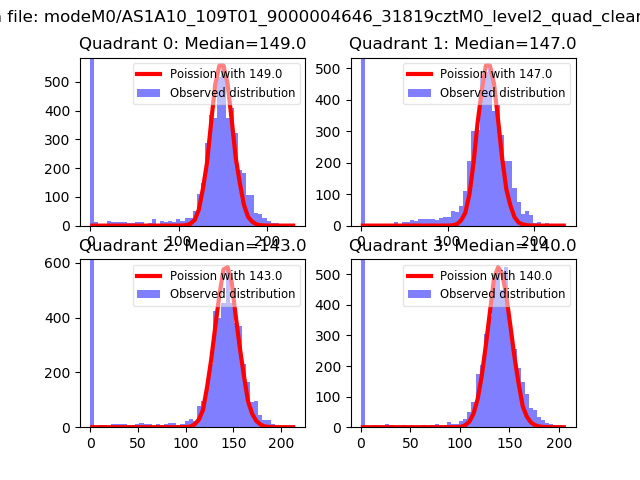
| Comparison with Poisson distribution Blue bars denote a histogram of data divided into 1 sec bins. Red curve is a Poisson curve with rate = median count rate of data. |
 |
 |
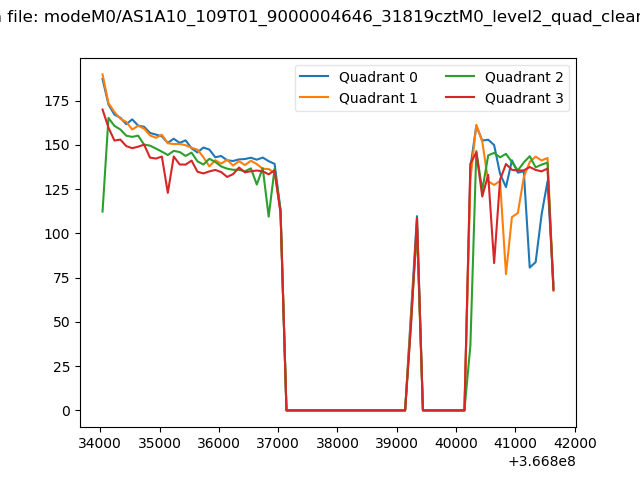
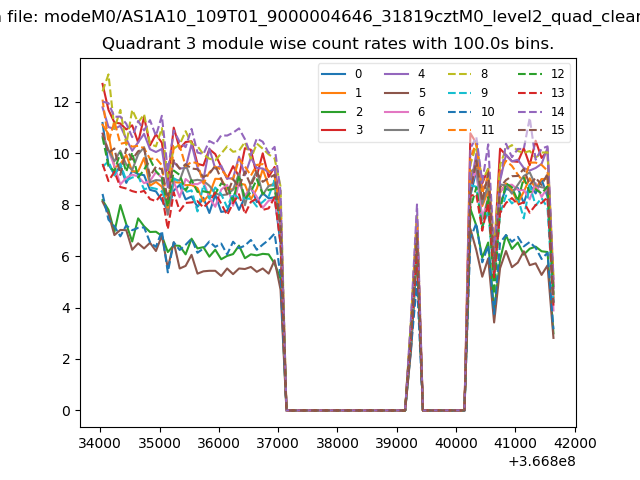
| Quadrant-wise count rates Data is divided into 100 sec bins |
 |
|
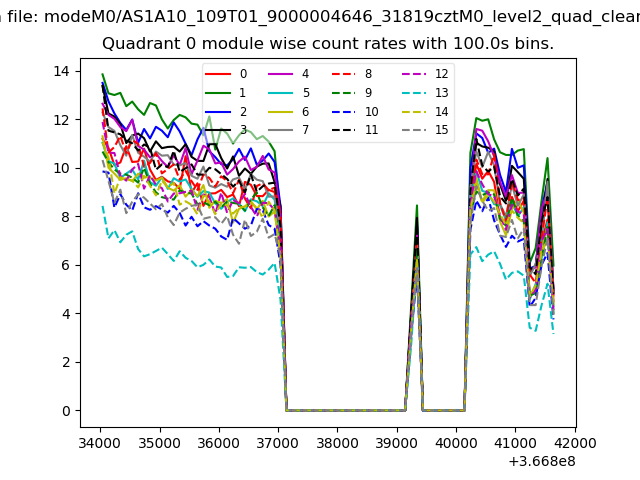
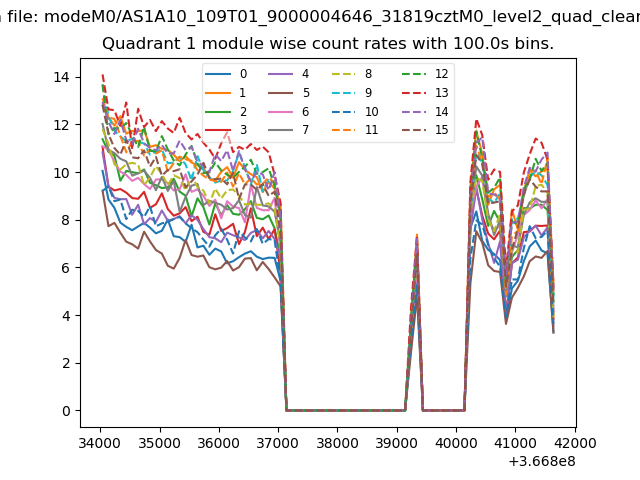
| Module-wise count rates for Quadrant A Data is divided into 100 sec bins |
 |
 |
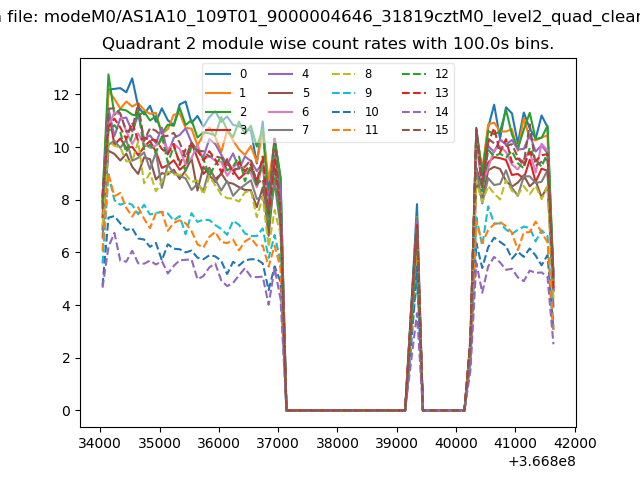
| Module-wise count rates for Quadrant B Data is divided into 100 sec bins |
 |
 |
| Module-wise count rates for Quadrant C Data is divided into 100 sec bins |
 |
 |
| Module-wise count rates for Quadrant D Data is divided into 100 sec bins |
 |
 |
| Parameter | Plot |
|---|---|
| CZT HV Monitor | 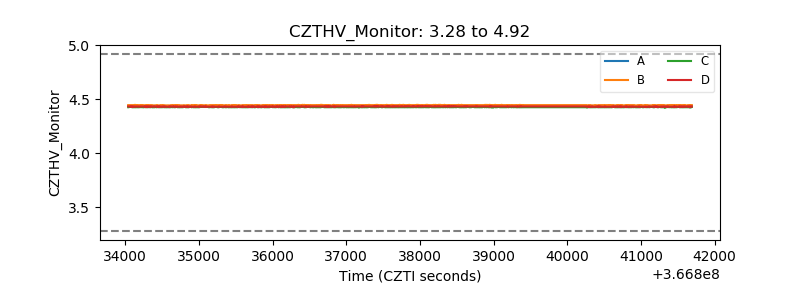 |
| D_VDD | 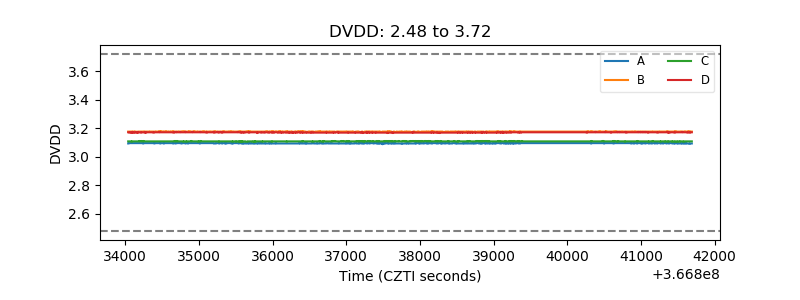 |
| Temperature 1 | 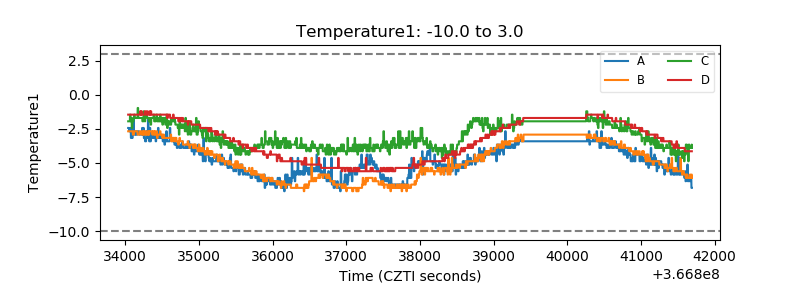 |
| Veto HV Monitor | 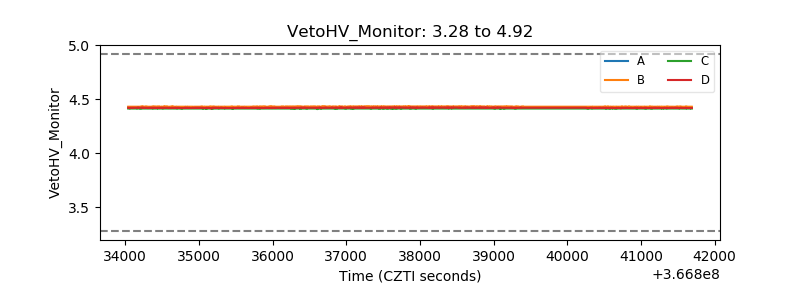 |
| Veto LLD | 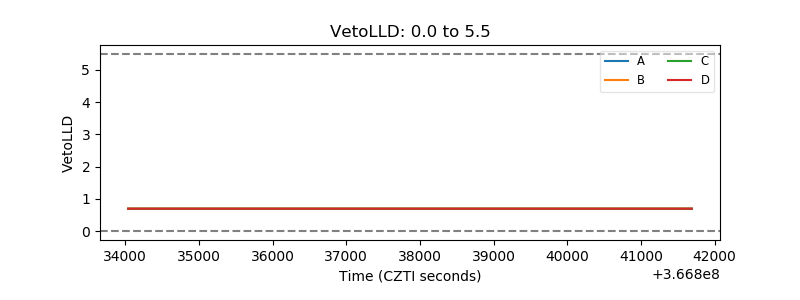 |
| Alpha Counter |  |
| _CPM_Rate | 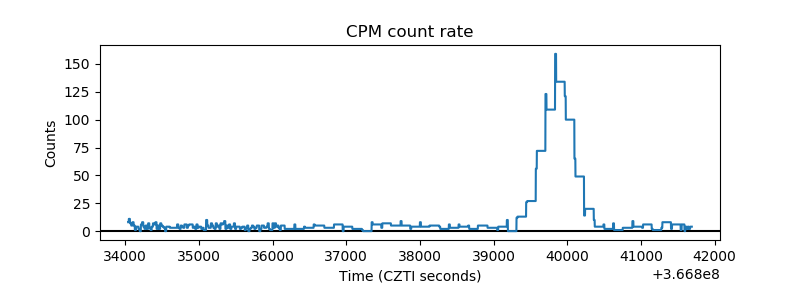 |
| CZT Counter | 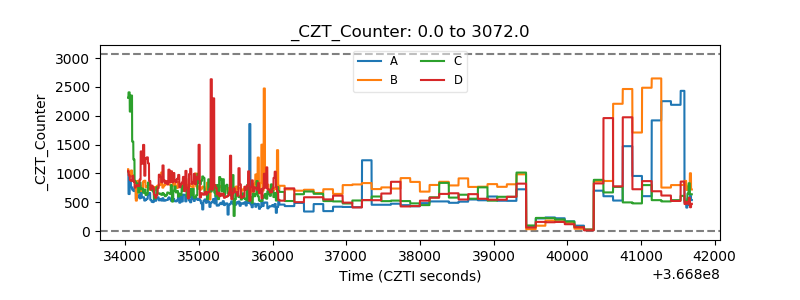 |
| +2.5 Volts monitor | 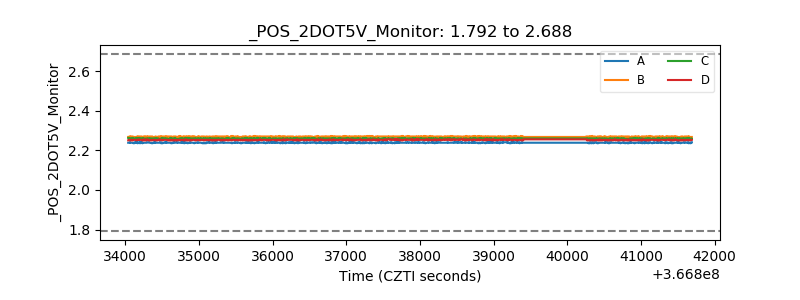 |
| +5 Volts monitor | 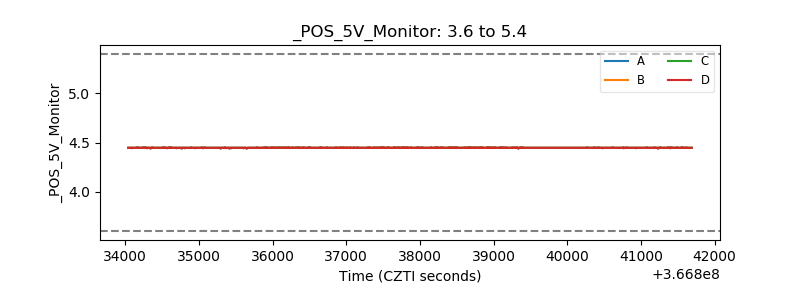 |
| _ROLL_ROT | 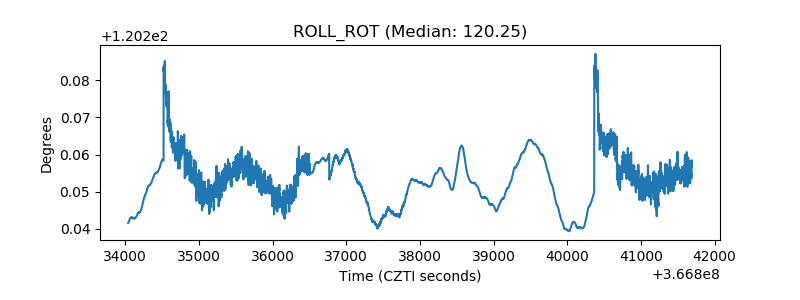 |
| _Roll_DEC | 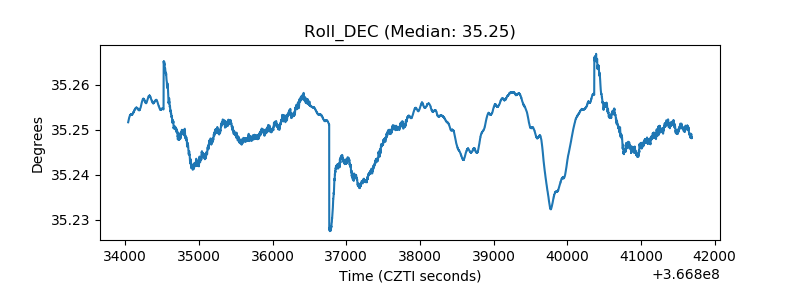 |
| _Roll_RA | 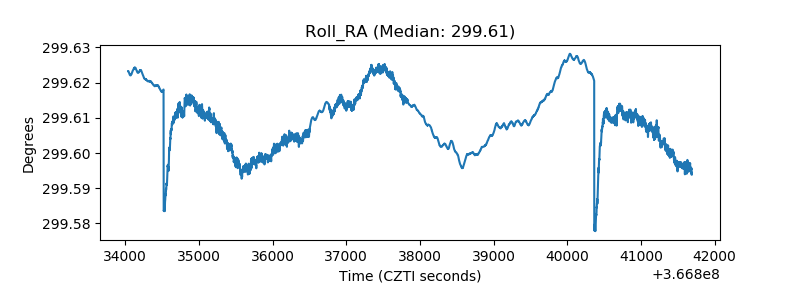 |
| Veto Counter | 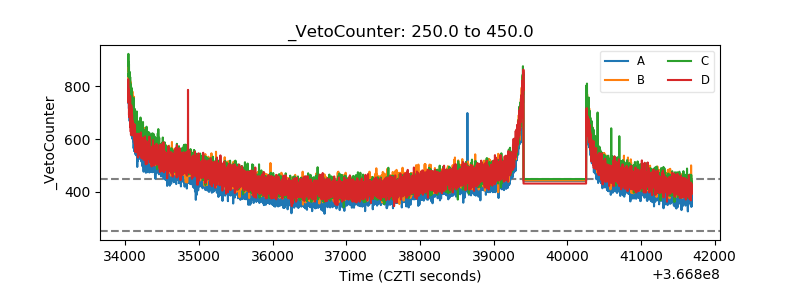 |