| Param | Original file | Final file |
|---|---|---|
| Filename | modeM0/AS1A10_109T01_9000004646_31820cztM0_level2.evt | modeM0/AS1A10_109T01_9000004646_31820cztM0_level2_quad_clean.evt |
| Size (bytes) | 671,120,640 | 101,370,240 |
| Size | 640.0 MB | 96.7 MB |
| Events in quadrant A | 4,211,856 | 659,273 |
| Events in quadrant B | 6,348,693 | 655,511 |
| Events in quadrant C | 4,591,369 | 646,826 |
| Events in quadrant D | 4,706,362 | 626,539 |
| Mode SS | |||
|---|---|---|---|
| Quadrant | BADHDUFLAG | Total packets | Discarded packets |
| A | 0 | 140 | 0 |
| B | 0 | 140 | 0 |
| C | 0 | 140 | 0 |
| D | 0 | 140 | 0 |
| Mode M0 | |||
|---|---|---|---|
| Quadrant | BADHDUFLAG | Total packets | Discarded packets |
| A | 0 | 17022 | 1 |
| B | 0 | 23811 | 2 |
| C | 0 | 18167 | 1 |
| D | 0 | 18746 | 1 |
| Mode M9 | |||
|---|---|---|---|
| Quadrant | BADHDUFLAG | Total packets | Discarded packets |
| A | 0 | 5 | 0 |
| B | 0 | 5 | 0 |
| C | 0 | 5 | 0 |
| D | 0 | 5 | 0 |
| Quadrant | Total seconds | Saturated seconds | Saturation percentage |
|---|---|---|---|
| A | 6907 | 373 | 5.400319% |
| B | 6907 | 528 | 7.644419% |
| C | 6907 | 279 | 4.039380% |
| D | 6907 | 251 | 3.633994% |
Noise dominated data is calculated using 1-second bins in cleaned event files. If a bin has >2000 counts, and if more than 50% of those come from <1% of pixels, then it is considered to be noise-dominated and hence unusable.
| Quadrant | # 1 sec bins | Bins with >0 counts | Bins with >2000 counts | High rate bins dominated by noise | Noise dominated (total time) | Noise dominated (detector-on time) | Marked lightcurve |
|---|---|---|---|---|---|---|---|
| A | 7357 | 6909 | 227 | 227 | 3.09% | 3.29% | 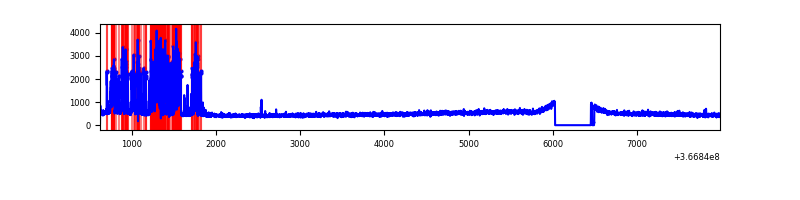 |
| B | 7357 | 6909 | 330 | 330 | 4.49% | 4.78% | 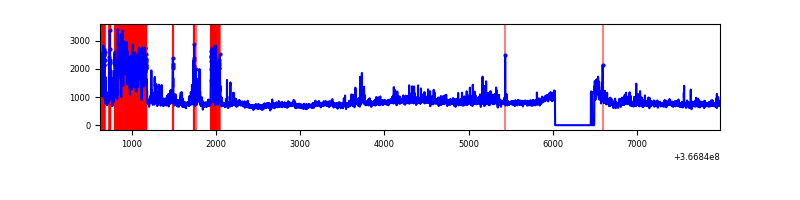 |
| C | 7357 | 6909 | 37 | 37 | 0.50% | 0.54% | 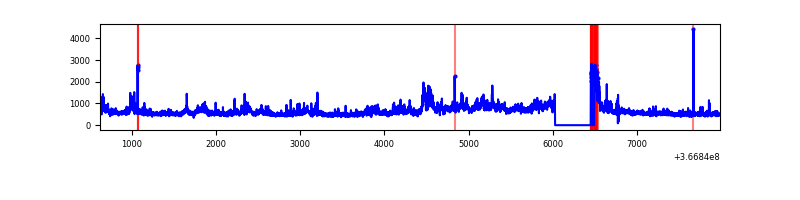 |
| D | 7357 | 6909 | 146 | 146 | 1.98% | 2.11% | 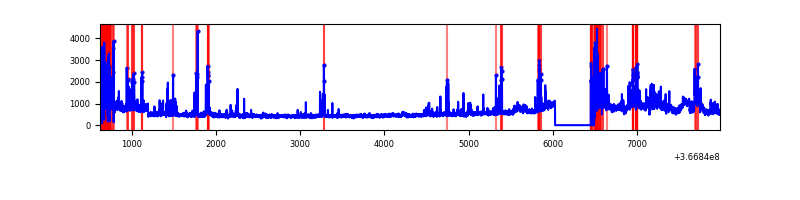 |
Top three noisy pixels from each quadrant. If the there are fewer than three noisy pixels in the level2.evt file, extra rows are filled as -1
| Pixel properties | Quadrant properties | ||||||
|---|---|---|---|---|---|---|---|
| Quadrant | DetID | PixID | Counts | Sigma | Mean | Median | Sigma |
| A | 0 | 13 | 929229 | 5420.36 | 846 | 830 | 171.3 |
| A | 13 | 254 | 14286 | 78.56 | 846 | 830 | 171.3 |
| A | 13 | 6 | 11207 | 60.59 | 846 | 830 | 171.3 |
| B | 6 | 159 | 1815435 | 11458.68 | 835 | 816 | 158.4 |
| B | 10 | 245 | 1046065 | 6600.38 | 835 | 816 | 158.4 |
| B | 4 | 80 | 131702 | 826.5 | 835 | 816 | 158.4 |
| C | 3 | 233 | 954980 | 4880.46 | 824 | 830 | 195.5 |
| C | 0 | 10 | 229714 | 1170.74 | 824 | 830 | 195.5 |
| C | 14 | 238 | 148401 | 754.82 | 824 | 830 | 195.5 |
| D | 8 | 195 | 704326 | 3572.86 | 824 | 805 | 196.9 |
| D | 12 | 218 | 669357 | 3395.27 | 824 | 805 | 196.9 |
| D | 12 | 233 | 117961 | 594.98 | 824 | 805 | 196.9 |
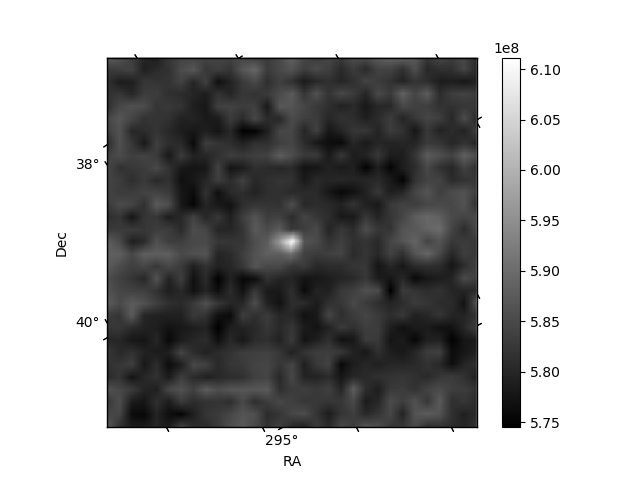
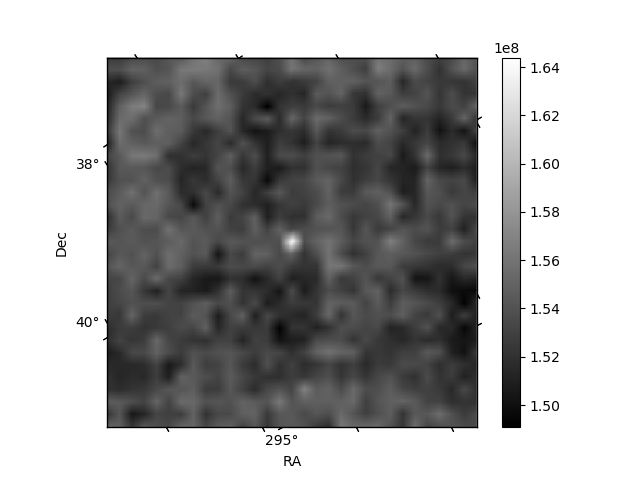
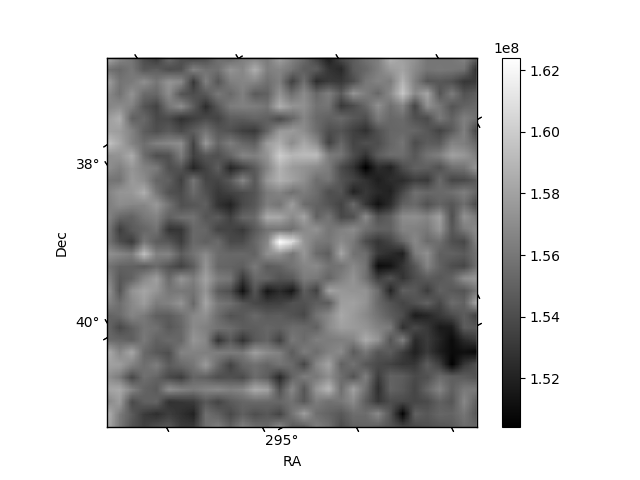
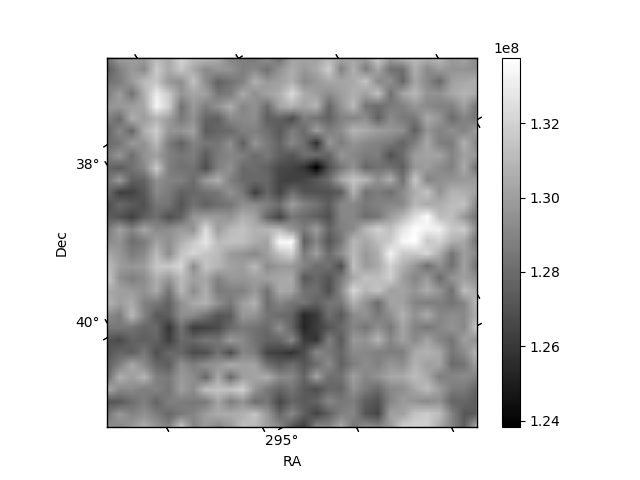
Histogram calculated using DETX and DETY for each event in the final _common_clean file
| Quadrant A | 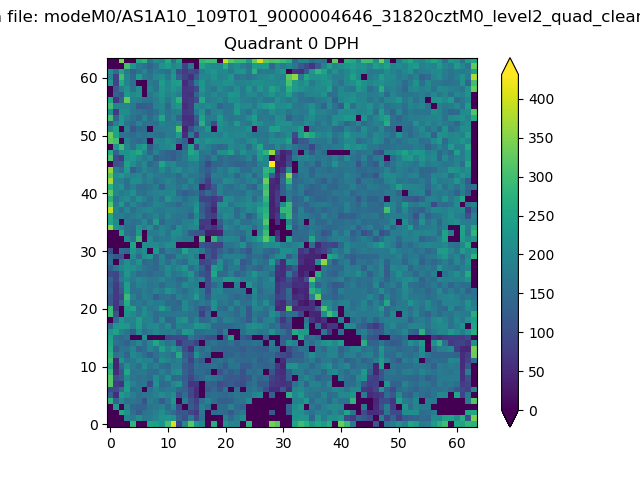 |
 |
Quadrant B |
|---|---|---|---|
| Quadrant D | 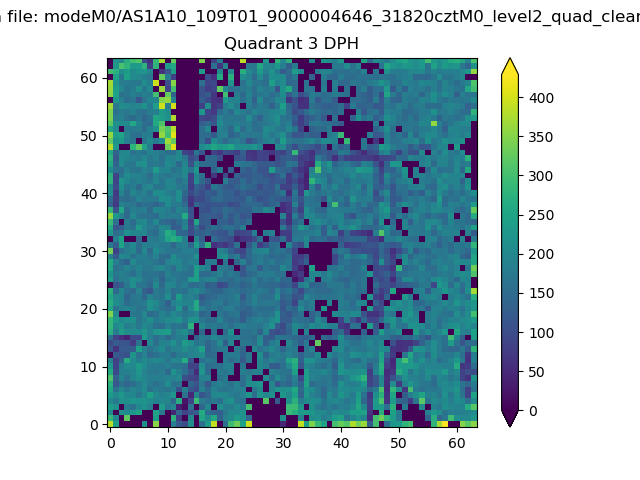 |
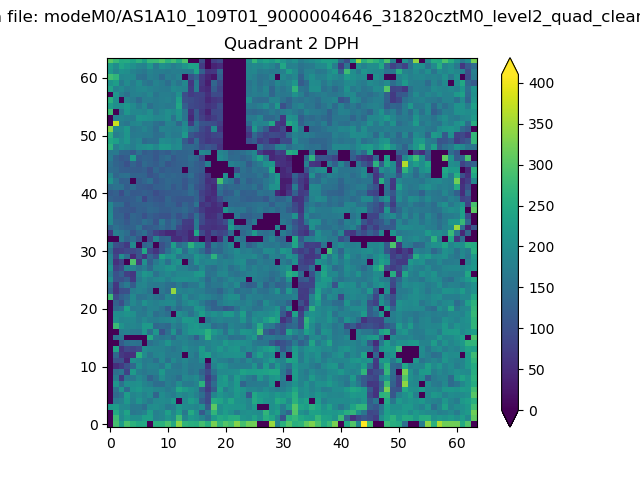 |
Quadrant C |
| Plot type | Count rate plots | Images |
|---|---|---|
| Comparison with Poisson distribution Blue bars denote a histogram of data divided into 1 sec bins. Red curve is a Poisson curve with rate = median count rate of data. |
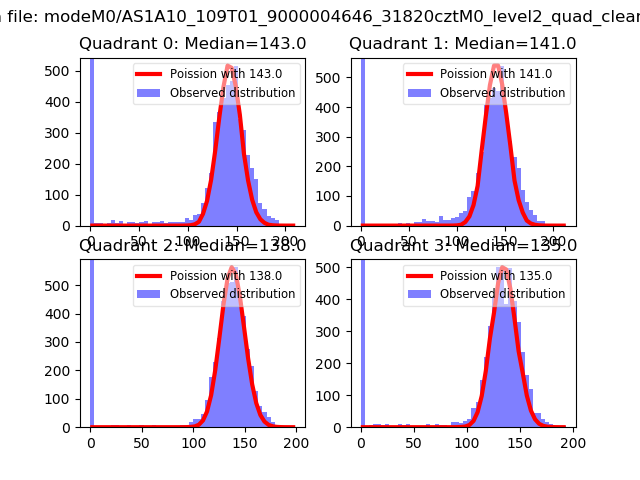 |
 |
| Quadrant-wise count rates Data is divided into 100 sec bins |
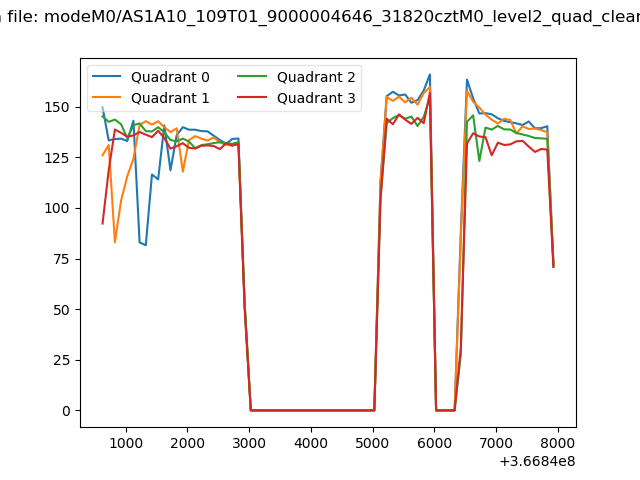 |
|
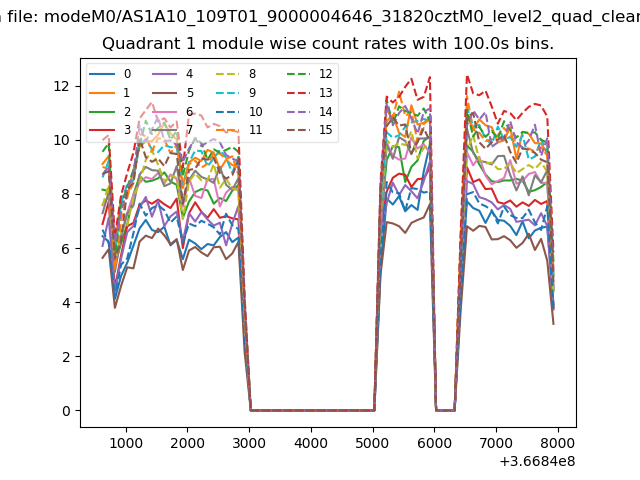
| Module-wise count rates for Quadrant A Data is divided into 100 sec bins |
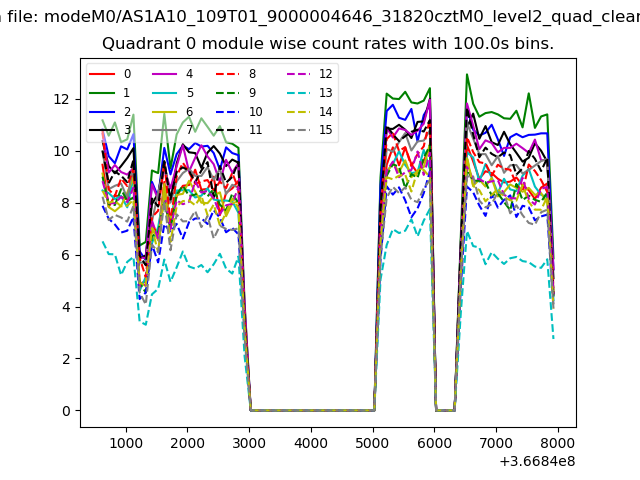 |
 |
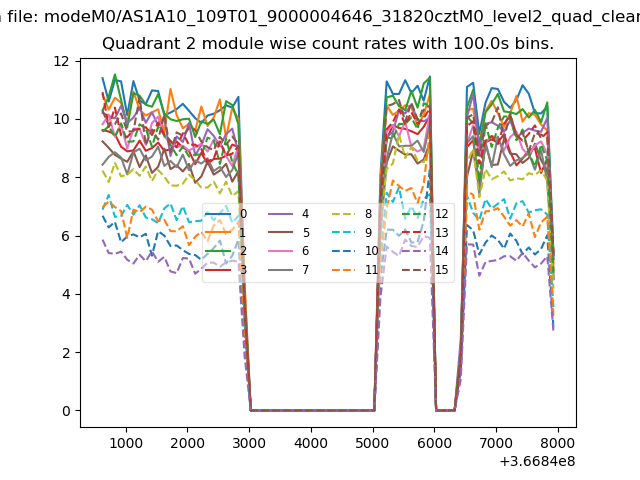
| Module-wise count rates for Quadrant B Data is divided into 100 sec bins |
 |
 |
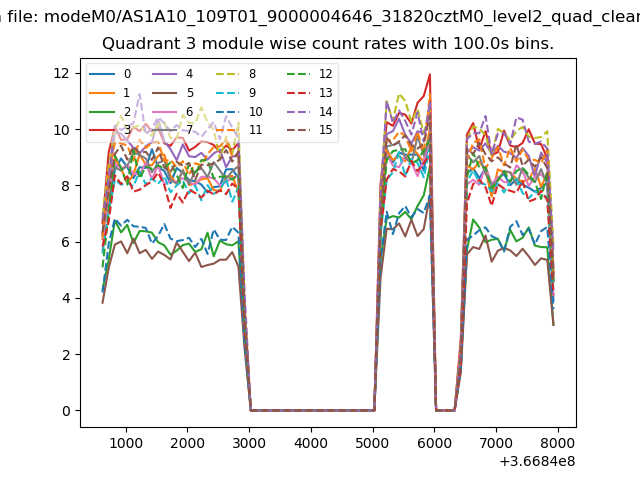
| Module-wise count rates for Quadrant C Data is divided into 100 sec bins |
 |
 |
| Module-wise count rates for Quadrant D Data is divided into 100 sec bins |
 |
 |
| Parameter | Plot |
|---|---|
| CZT HV Monitor | 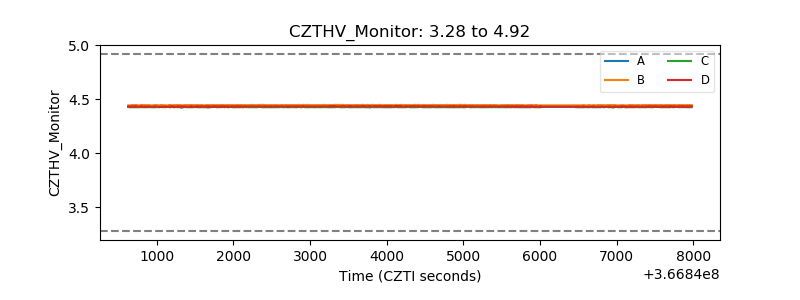 |
| D_VDD | 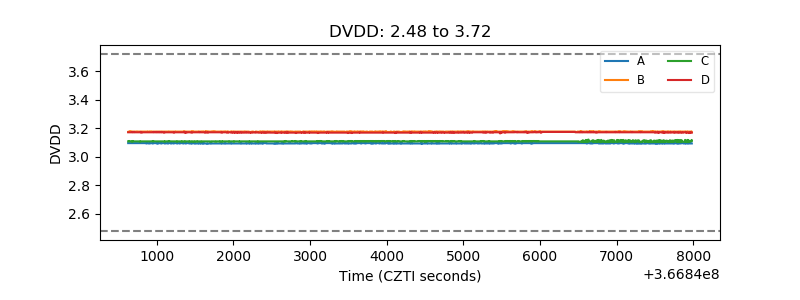 |
| Temperature 1 | 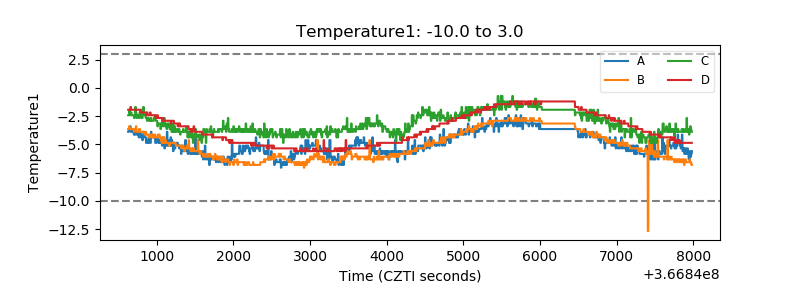 |
| Veto HV Monitor |  |
| Veto LLD |  |
| Alpha Counter | 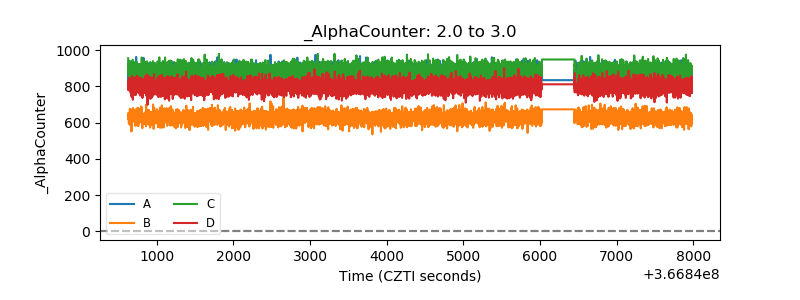 |
| _CPM_Rate | 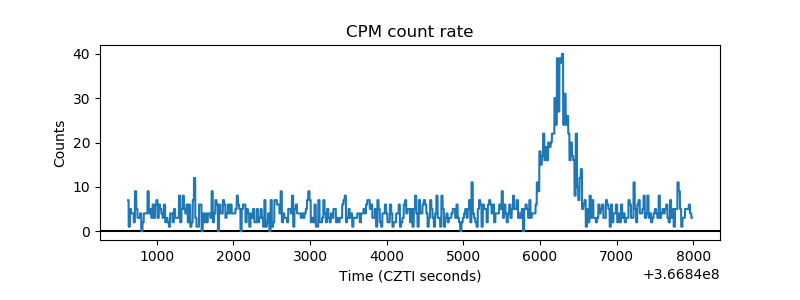 |
| CZT Counter | 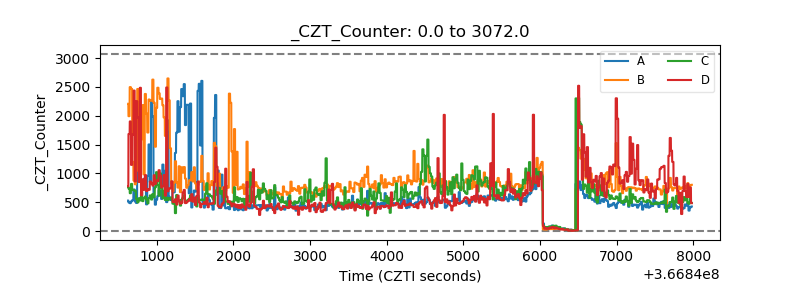 |
| +2.5 Volts monitor | 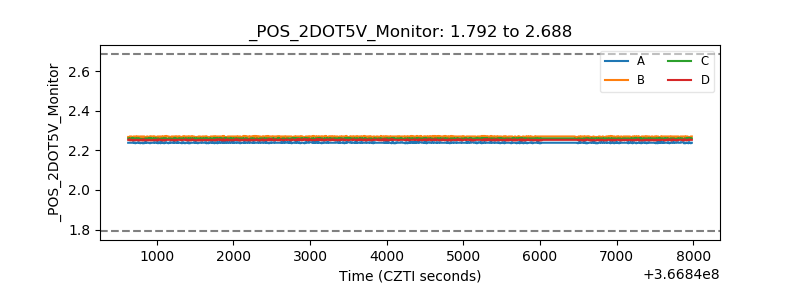 |
| +5 Volts monitor | 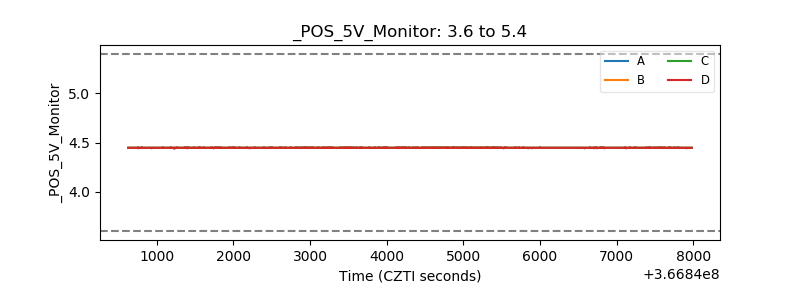 |
| _ROLL_ROT | 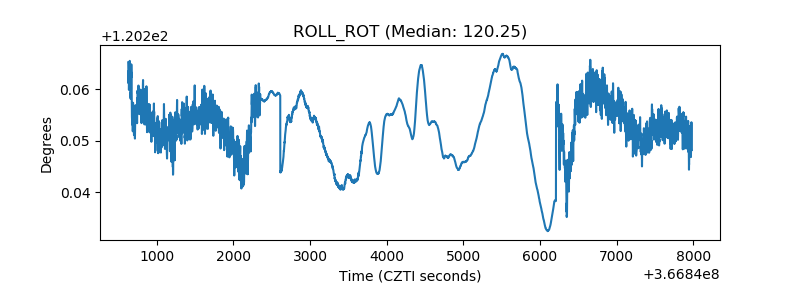 |
| _Roll_DEC | 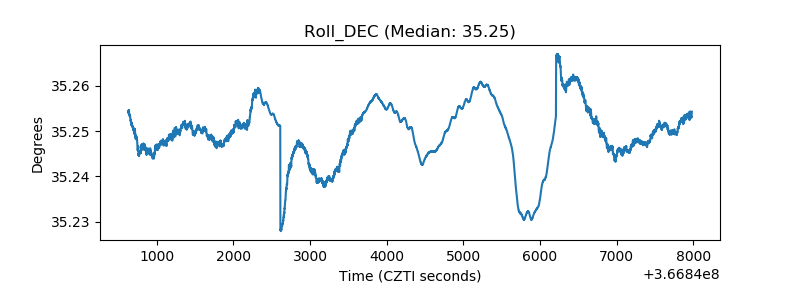 |
| _Roll_RA |  |
| Veto Counter | 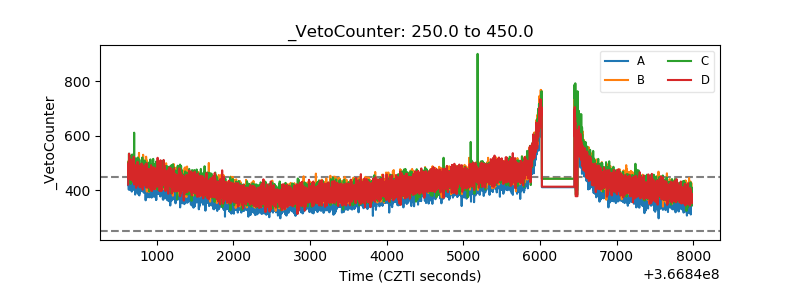 |