| Param | Original file | Final file |
|---|---|---|
| Filename | modeM0/AS1A10_109T01_9000004646_31822cztM0_level2.evt | modeM0/AS1A10_109T01_9000004646_31822cztM0_level2_quad_clean.evt |
| Size (bytes) | 1,090,808,640 | 172,252,800 |
| Size | 1.0 GB | 164.3 MB |
| Events in quadrant A | 5,907,144 | 1,132,479 |
| Events in quadrant B | 10,512,193 | 1,108,784 |
| Events in quadrant C | 8,626,251 | 1,066,297 |
| Events in quadrant D | 7,156,102 | 1,054,803 |
| Mode SS | |||
|---|---|---|---|
| Quadrant | BADHDUFLAG | Total packets | Discarded packets |
| A | 0 | 252 | 0 |
| B | 0 | 252 | 0 |
| C | 0 | 252 | 0 |
| D | 0 | 252 | 0 |
| Mode M0 | |||
|---|---|---|---|
| Quadrant | BADHDUFLAG | Total packets | Discarded packets |
| A | 0 | 25603 | 3 |
| B | 0 | 39716 | 8 |
| C | 0 | 34200 | 3 |
| D | 0 | 29751 | 3 |
| Mode M9 | |||
|---|---|---|---|
| Quadrant | BADHDUFLAG | Total packets | Discarded packets |
| A | 0 | 5 | 0 |
| B | 0 | 5 | 0 |
| C | 0 | 5 | 0 |
| D | 0 | 5 | 0 |
| Quadrant | Total seconds | Saturated seconds | Saturation percentage |
|---|---|---|---|
| A | 12360 | 61 | 0.493528% |
| B | 12359 | 420 | 3.398333% |
| C | 12360 | 679 | 5.493528% |
| D | 12360 | 77 | 0.622977% |
Noise dominated data is calculated using 1-second bins in cleaned event files. If a bin has >2000 counts, and if more than 50% of those come from <1% of pixels, then it is considered to be noise-dominated and hence unusable.
| Quadrant | # 1 sec bins | Bins with >0 counts | Bins with >2000 counts | High rate bins dominated by noise | Noise dominated (total time) | Noise dominated (detector-on time) | Marked lightcurve |
|---|---|---|---|---|---|---|---|
| A | 12890 | 12364 | 0 | 0 | 0.00% | 0.00% | 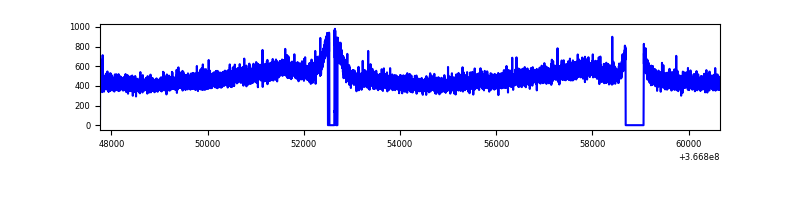 |
| B | 12889 | 12363 | 78 | 78 | 0.61% | 0.63% | 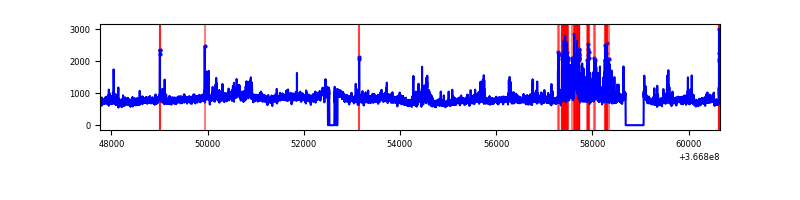 |
| C | 12890 | 12364 | 142 | 142 | 1.10% | 1.15% | 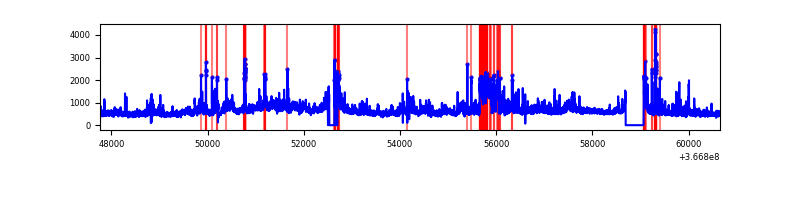 |
| D | 12890 | 12364 | 30 | 30 | 0.23% | 0.24% | 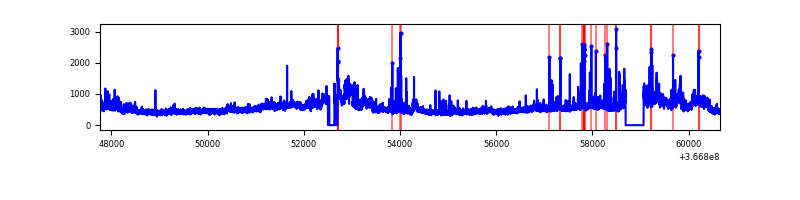 |
Top three noisy pixels from each quadrant. If the there are fewer than three noisy pixels in the level2.evt file, extra rows are filled as -1
| Pixel properties | Quadrant properties | ||||||
|---|---|---|---|---|---|---|---|
| Quadrant | DetID | PixID | Counts | Sigma | Mean | Median | Sigma |
| A | 13 | 254 | 21844 | 66.44 | 1527 | 1496 | 306.3 |
| A | 3 | 137 | 15759 | 46.57 | 1527 | 1496 | 306.3 |
| A | 13 | 6 | 12747 | 36.74 | 1527 | 1496 | 306.3 |
| B | 6 | 159 | 3377468 | 11780.93 | 1496 | 1459 | 286.6 |
| B | 10 | 245 | 587206 | 2044.02 | 1496 | 1459 | 286.6 |
| B | 3 | 209 | 327784 | 1138.74 | 1496 | 1459 | 286.6 |
| C | 3 | 233 | 2169850 | 6305.85 | 1452 | 1464 | 343.9 |
| C | 0 | 10 | 375706 | 1088.33 | 1452 | 1464 | 343.9 |
| C | 14 | 238 | 269320 | 778.95 | 1452 | 1464 | 343.9 |
| D | 8 | 195 | 1186575 | 3356.51 | 1480 | 1444 | 353.1 |
| D | 2 | 250 | 107498 | 300.36 | 1480 | 1444 | 353.1 |
| D | 12 | 218 | 106880 | 298.61 | 1480 | 1444 | 353.1 |
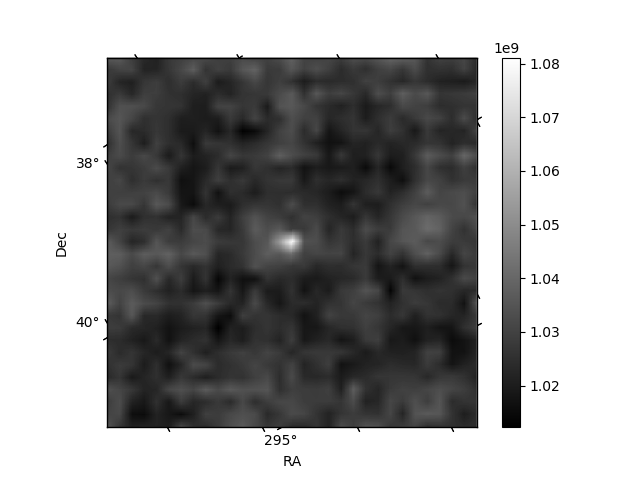
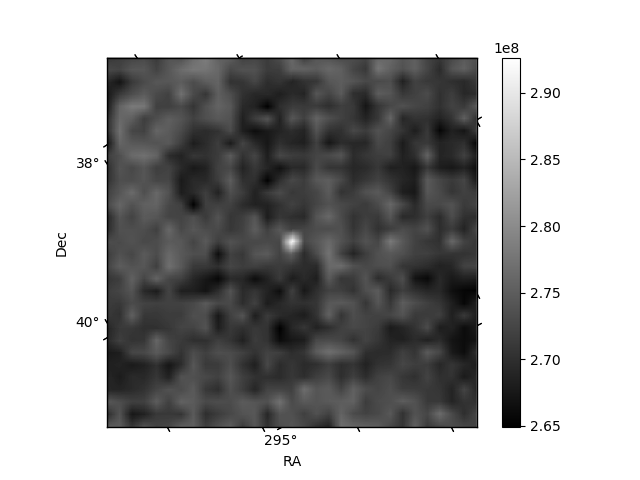
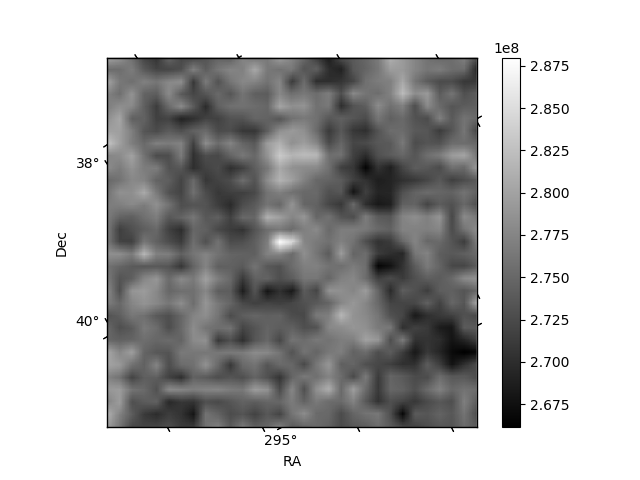
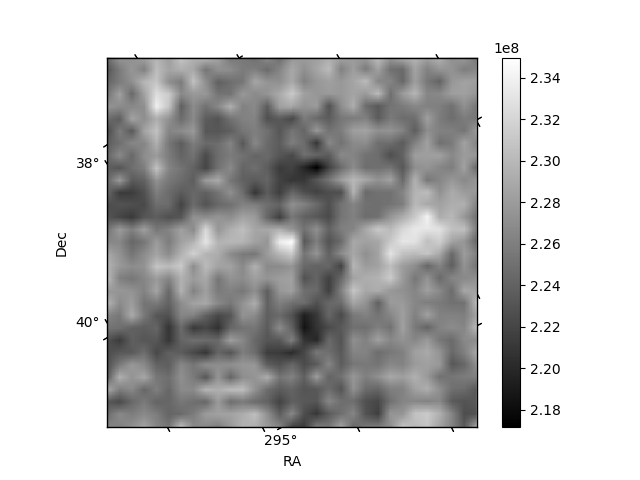
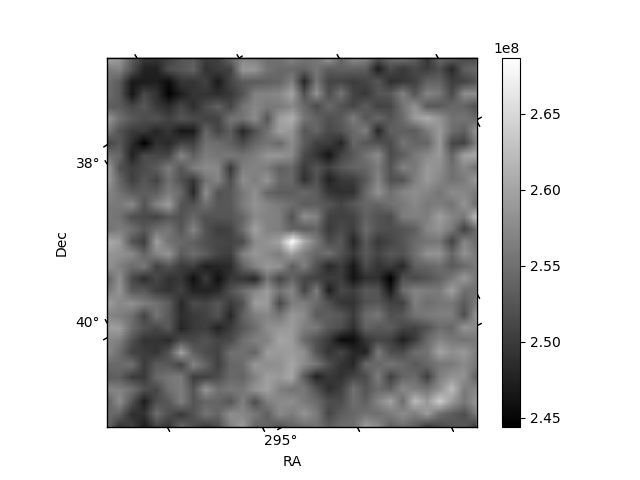
Histogram calculated using DETX and DETY for each event in the final _common_clean file
| Quadrant A | 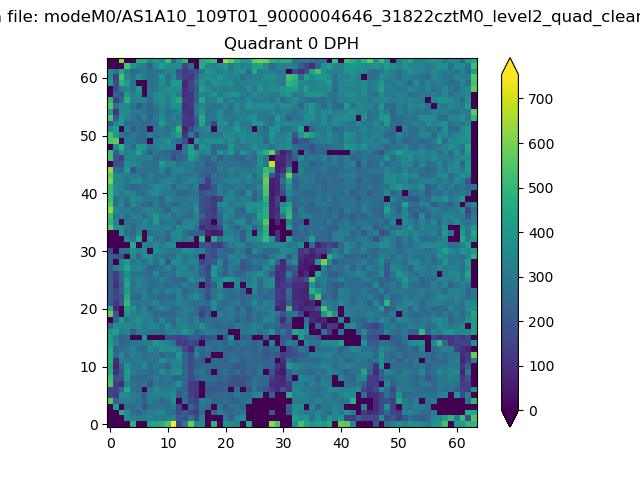 |
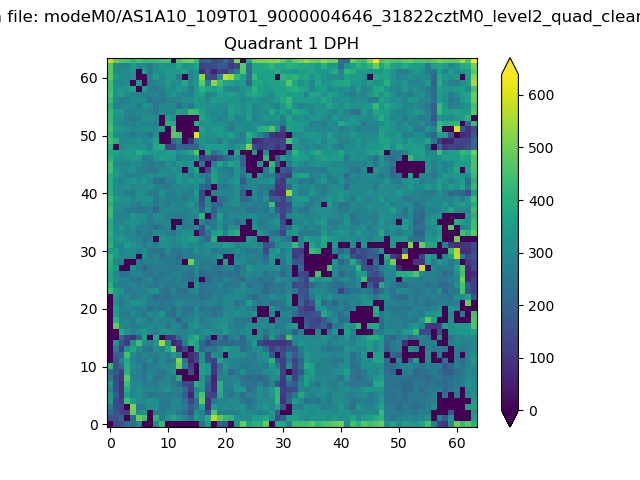 |
Quadrant B |
|---|---|---|---|
| Quadrant D | 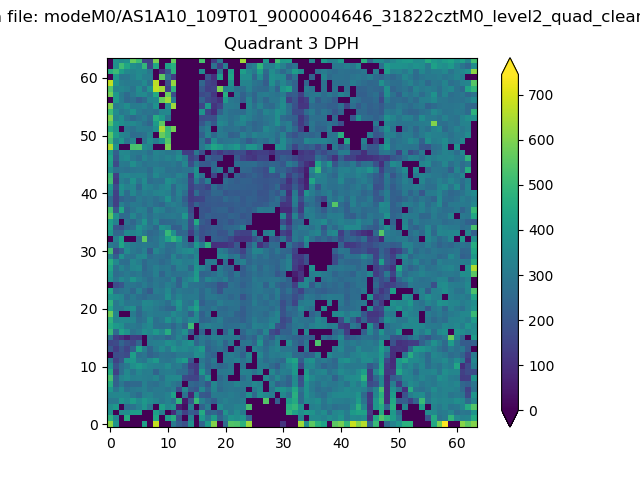 |
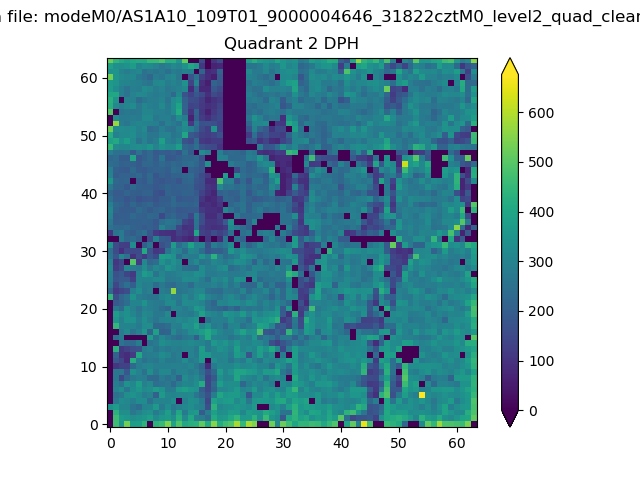 |
Quadrant C |
| Plot type | Count rate plots | Images |
|---|---|---|
| Comparison with Poisson distribution Blue bars denote a histogram of data divided into 1 sec bins. Red curve is a Poisson curve with rate = median count rate of data. |
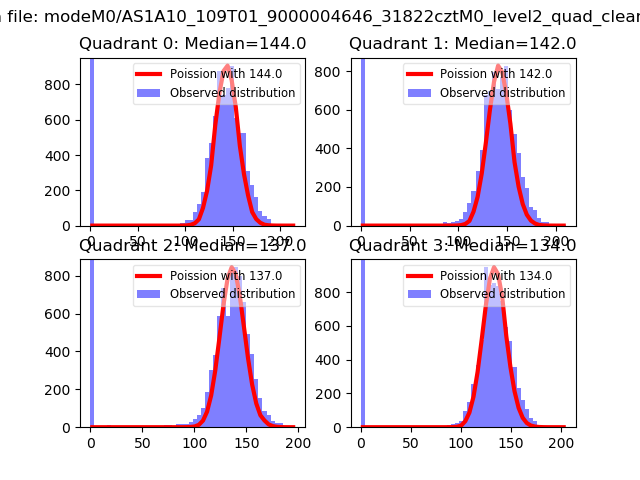 |
 |
| Quadrant-wise count rates Data is divided into 100 sec bins |
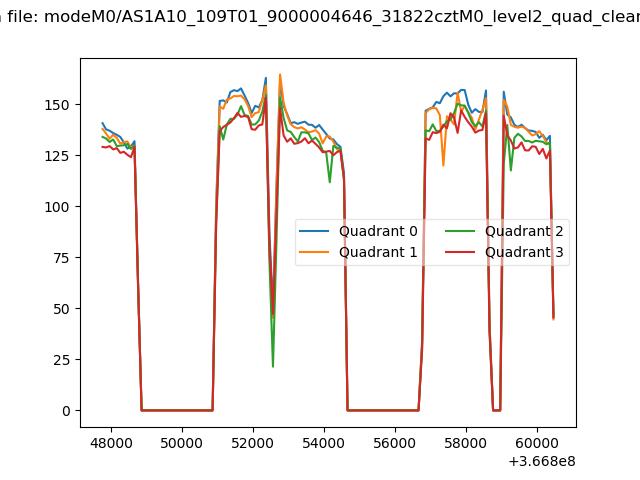 |
|
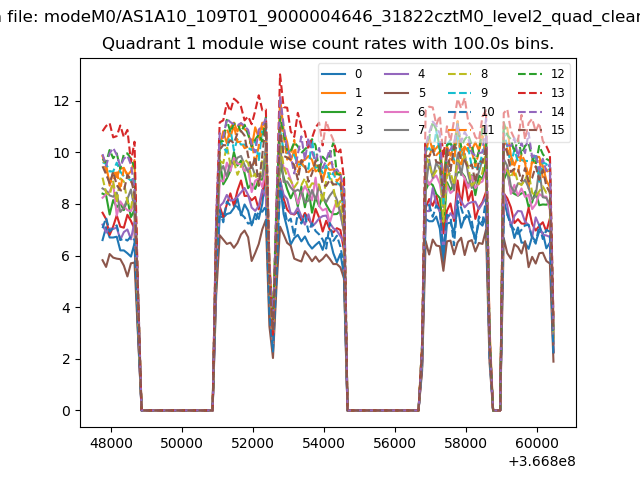
| Module-wise count rates for Quadrant A Data is divided into 100 sec bins |
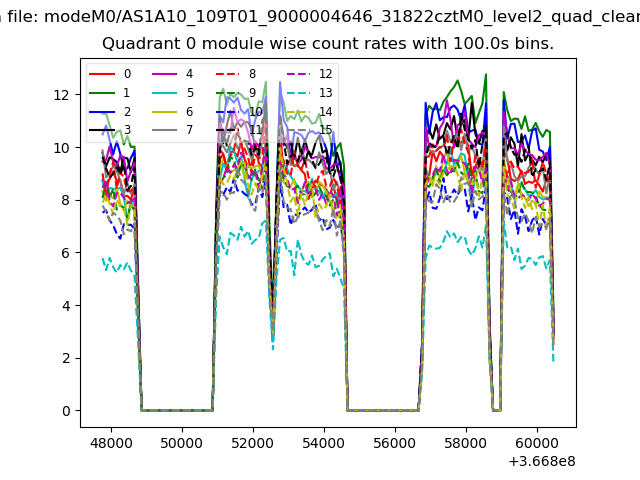 |
 |
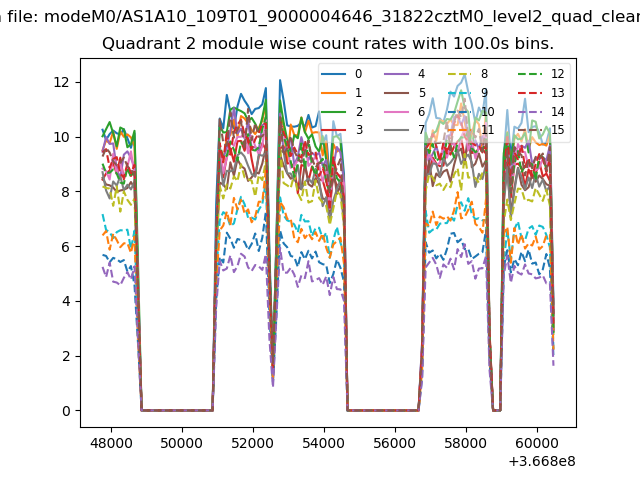
| Module-wise count rates for Quadrant B Data is divided into 100 sec bins |
 |
 |
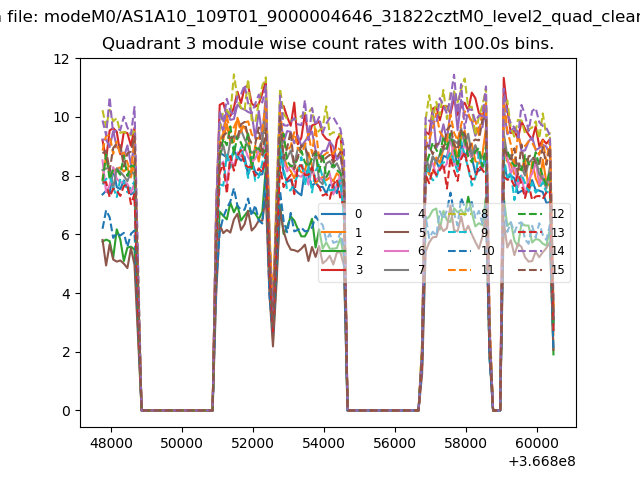
| Module-wise count rates for Quadrant C Data is divided into 100 sec bins |
 |
 |
| Module-wise count rates for Quadrant D Data is divided into 100 sec bins |
 |
 |
| Parameter | Plot |
|---|---|
| CZT HV Monitor | 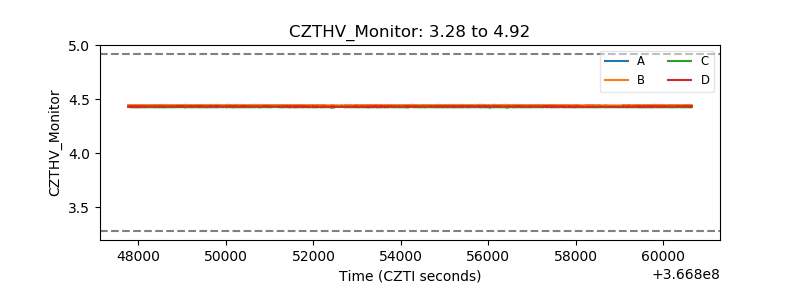 |
| D_VDD | 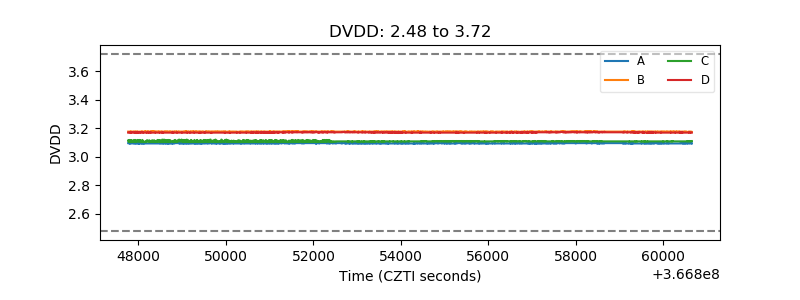 |
| Temperature 1 | 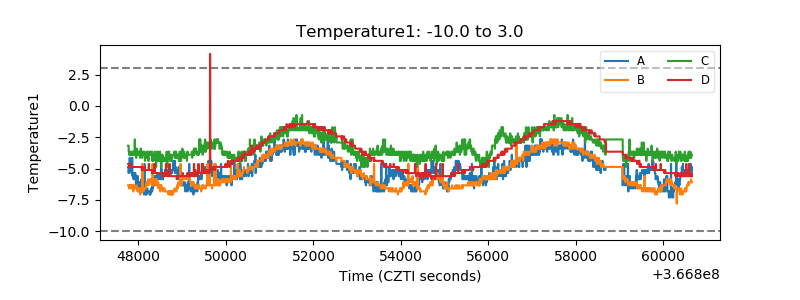 |
| Veto HV Monitor | 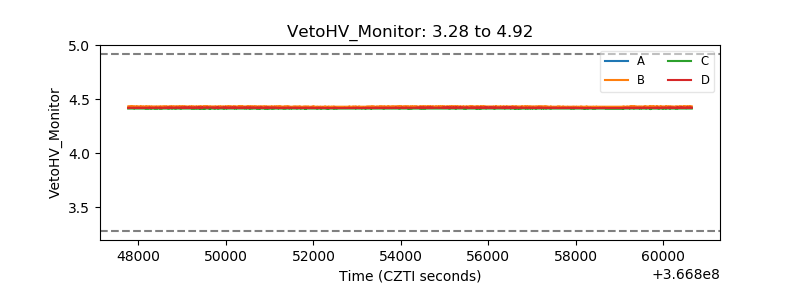 |
| Veto LLD | 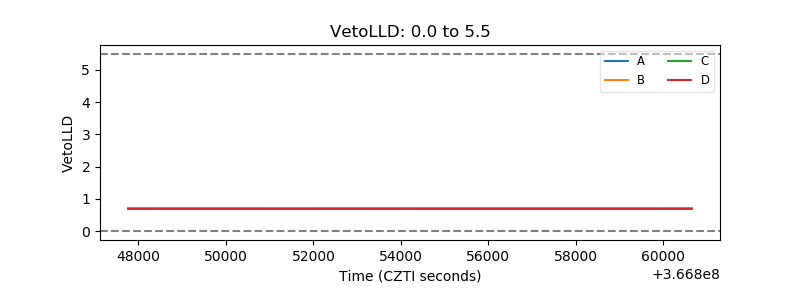 |
| Alpha Counter | 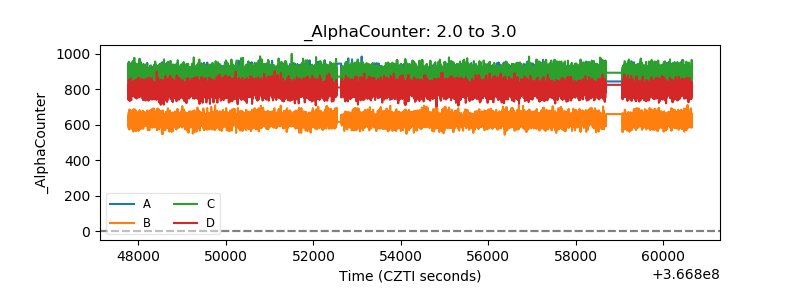 |
| _CPM_Rate | 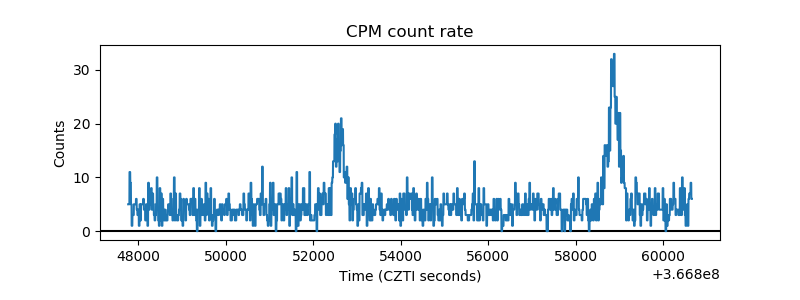 |
| CZT Counter | 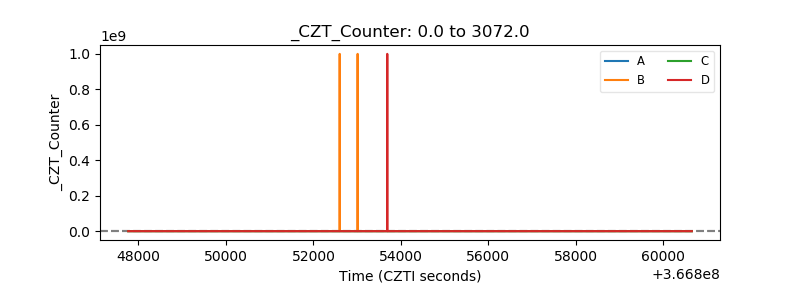 |
| +2.5 Volts monitor | 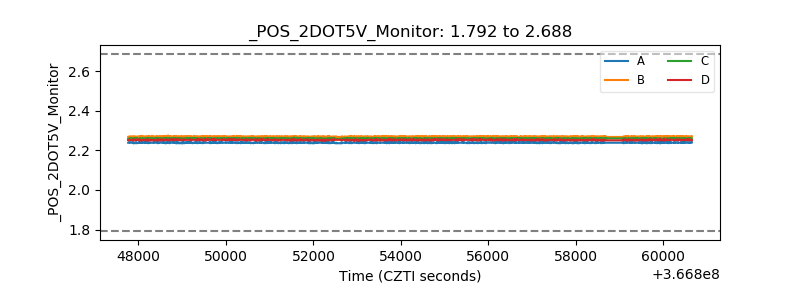 |
| +5 Volts monitor |  |
| _ROLL_ROT | 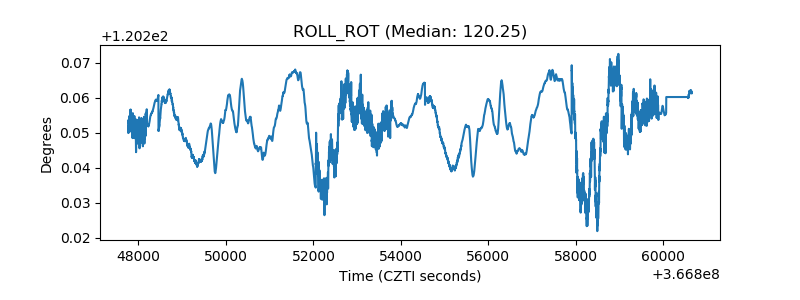 |
| _Roll_DEC | 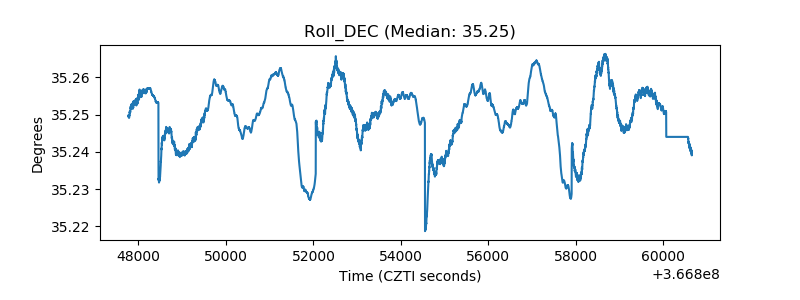 |
| _Roll_RA | 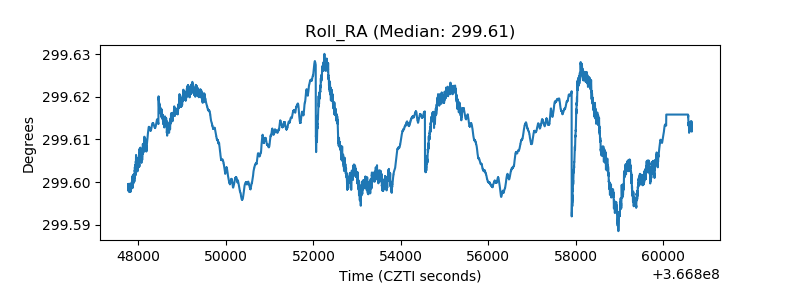 |
| Veto Counter | 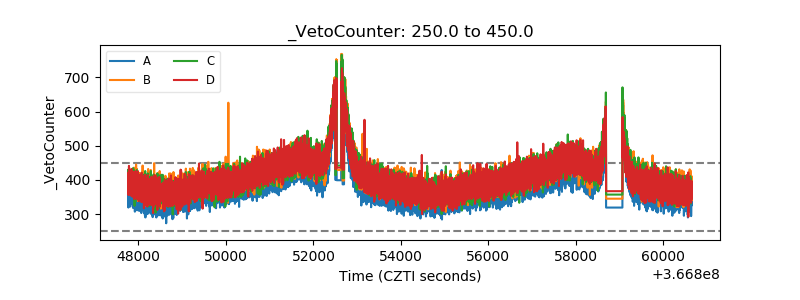 |