| Param | Original file | Final file |
|---|---|---|
| Filename | modeM0/AS1A10_109T01_9000004646_31824cztM0_level2.evt | modeM0/AS1A10_109T01_9000004646_31824cztM0_level2_quad_clean.evt |
| Size (bytes) | 1,104,171,840 | 157,259,520 |
| Size | 1.0 GB | 150.0 MB |
| Events in quadrant A | 5,908,337 | 1,012,940 |
| Events in quadrant B | 11,744,736 | 977,144 |
| Events in quadrant C | 7,420,315 | 961,303 |
| Events in quadrant D | 7,525,563 | 948,874 |
| Mode SS | |||
|---|---|---|---|
| Quadrant | BADHDUFLAG | Total packets | Discarded packets |
| A | 0 | 252 | 0 |
| B | 0 | 252 | 0 |
| C | 0 | 252 | 0 |
| D | 0 | 252 | 0 |
| Mode M0 | |||
|---|---|---|---|
| Quadrant | BADHDUFLAG | Total packets | Discarded packets |
| A | 0 | 25402 | 2 |
| B | 0 | 43839 | 2 |
| C | 0 | 29633 | 3 |
| D | 0 | 30570 | 2 |
| Mode M9 | |||
|---|---|---|---|
| Quadrant | BADHDUFLAG | Total packets | Discarded packets |
| A | 0 | 12 | 0 |
| B | 0 | 12 | 0 |
| C | 0 | 12 | 0 |
| D | 0 | 12 | 0 |
| Quadrant | Total seconds | Saturated seconds | Saturation percentage |
|---|---|---|---|
| A | 12477 | 63 | 0.504929% |
| B | 12478 | 850 | 6.811989% |
| C | 12477 | 375 | 3.005530% |
| D | 12477 | 251 | 2.011702% |
Noise dominated data is calculated using 1-second bins in cleaned event files. If a bin has >2000 counts, and if more than 50% of those come from <1% of pixels, then it is considered to be noise-dominated and hence unusable.
| Quadrant | # 1 sec bins | Bins with >0 counts | Bins with >2000 counts | High rate bins dominated by noise | Noise dominated (total time) | Noise dominated (detector-on time) | Marked lightcurve |
|---|---|---|---|---|---|---|---|
| A | 13657 | 12479 | 0 | 0 | 0.00% | 0.00% | 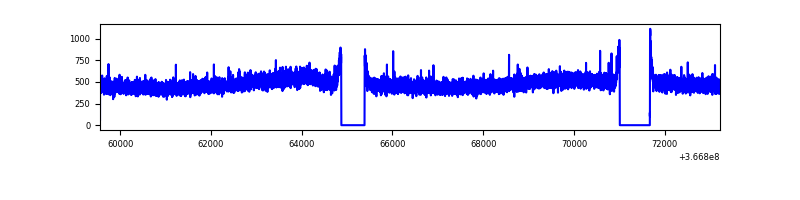 |
| B | 13658 | 12480 | 403 | 403 | 2.95% | 3.23% | 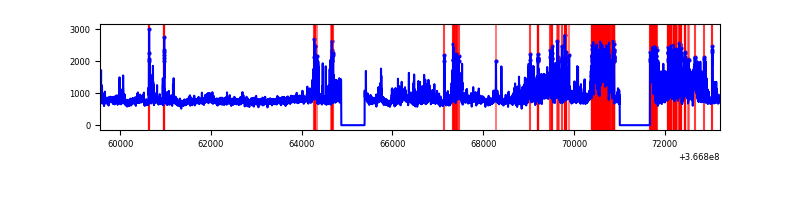 |
| C | 13657 | 12479 | 64 | 64 | 0.47% | 0.51% | 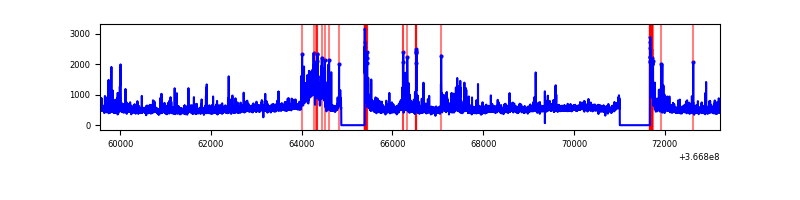 |
| D | 13657 | 12479 | 192 | 192 | 1.41% | 1.54% | 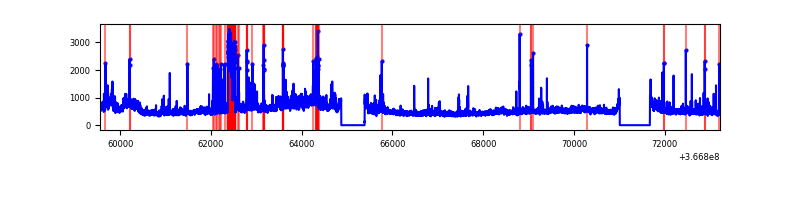 |
Top three noisy pixels from each quadrant. If the there are fewer than three noisy pixels in the level2.evt file, extra rows are filled as -1
| Pixel properties | Quadrant properties | ||||||
|---|---|---|---|---|---|---|---|
| Quadrant | DetID | PixID | Counts | Sigma | Mean | Median | Sigma |
| A | 13 | 254 | 22671 | 69.04 | 1529 | 1499 | 306.6 |
| A | 3 | 137 | 16047 | 47.44 | 1529 | 1499 | 306.6 |
| A | 0 | 226 | 12443 | 35.69 | 1529 | 1499 | 306.6 |
| B | 6 | 159 | 3287742 | 11535.99 | 1483 | 1447 | 284.9 |
| B | 4 | 80 | 2072609 | 7270.47 | 1483 | 1447 | 284.9 |
| B | 10 | 245 | 540754 | 1893.15 | 1483 | 1447 | 284.9 |
| C | 3 | 233 | 894396 | 2611.14 | 1456 | 1470 | 342.0 |
| C | 0 | 10 | 495924 | 1445.91 | 1456 | 1470 | 342.0 |
| C | 14 | 238 | 262385 | 762.98 | 1456 | 1470 | 342.0 |
| D | 8 | 195 | 1131360 | 3234.1 | 1466 | 1431 | 349.4 |
| D | 12 | 233 | 606250 | 1731.12 | 1466 | 1431 | 349.4 |
| D | 2 | 250 | 174730 | 496.02 | 1466 | 1431 | 349.4 |
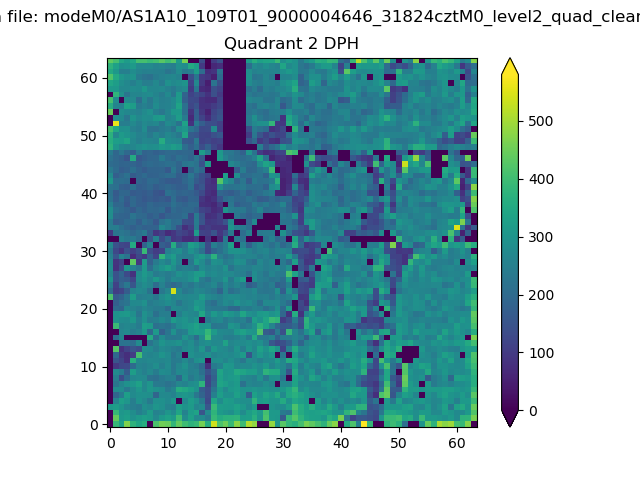
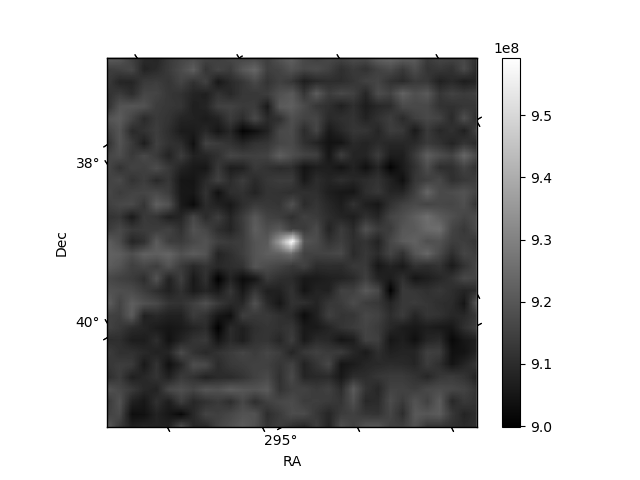
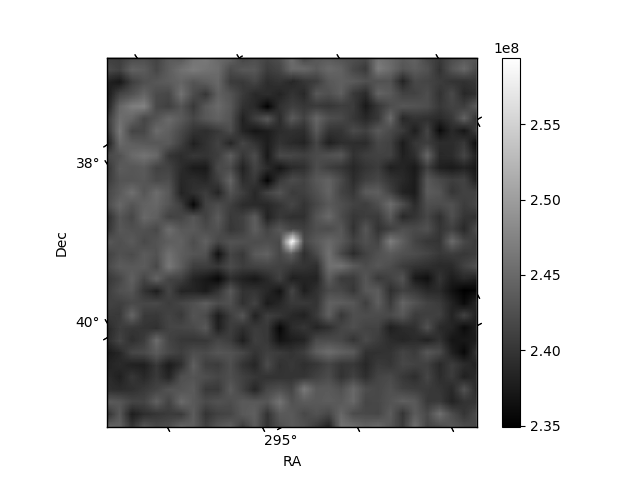
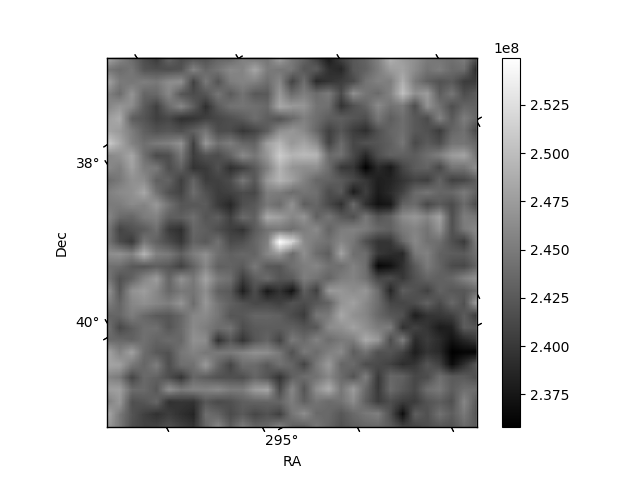
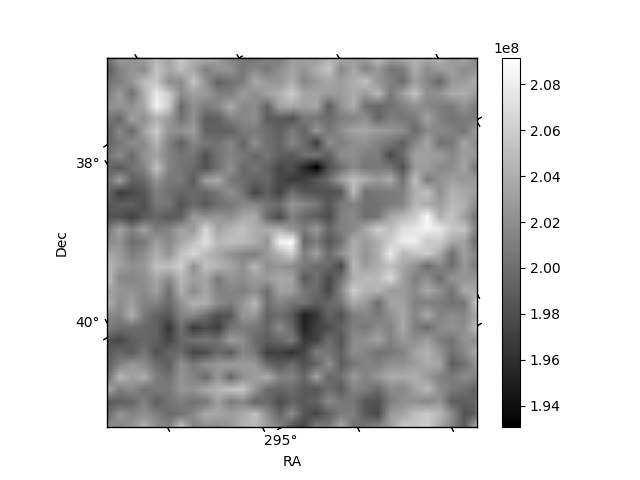
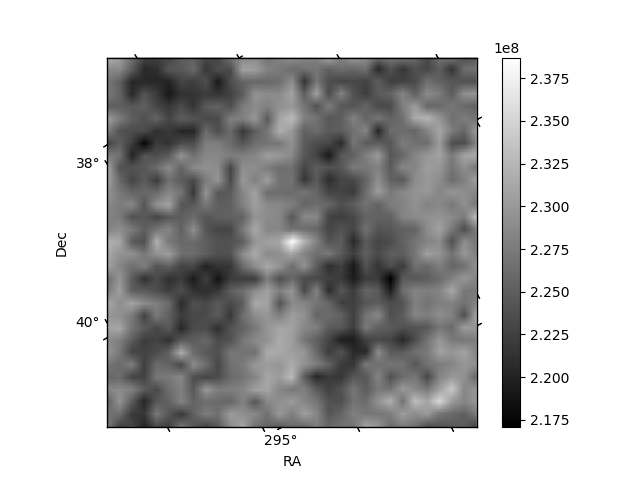
Histogram calculated using DETX and DETY for each event in the final _common_clean file
| Quadrant A | 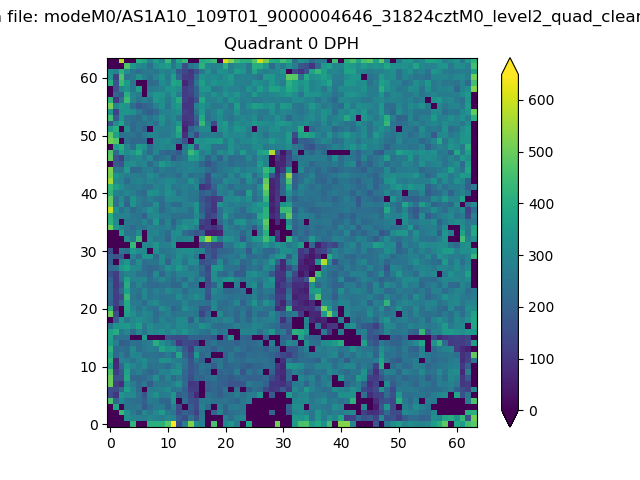 |
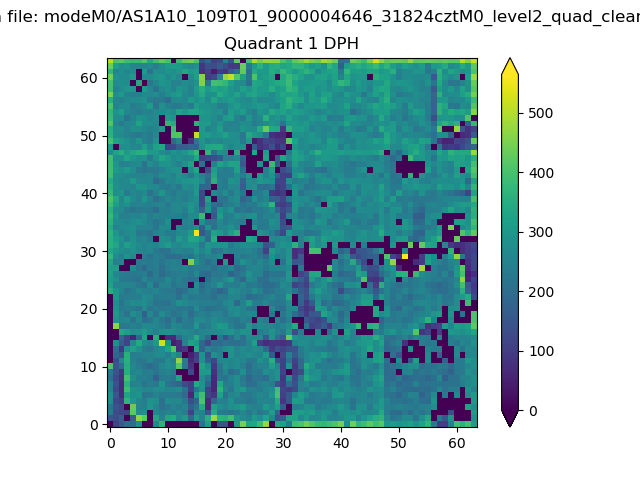 |
Quadrant B |
|---|---|---|---|
| Quadrant D | 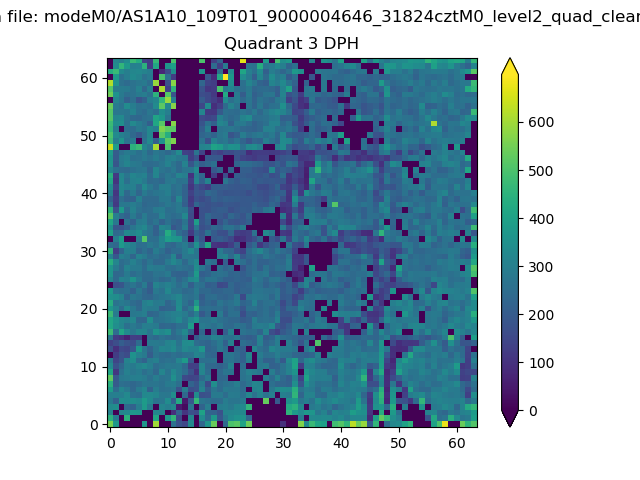 |
 |
Quadrant C |
| Plot type | Count rate plots | Images |
|---|---|---|
| Comparison with Poisson distribution Blue bars denote a histogram of data divided into 1 sec bins. Red curve is a Poisson curve with rate = median count rate of data. |
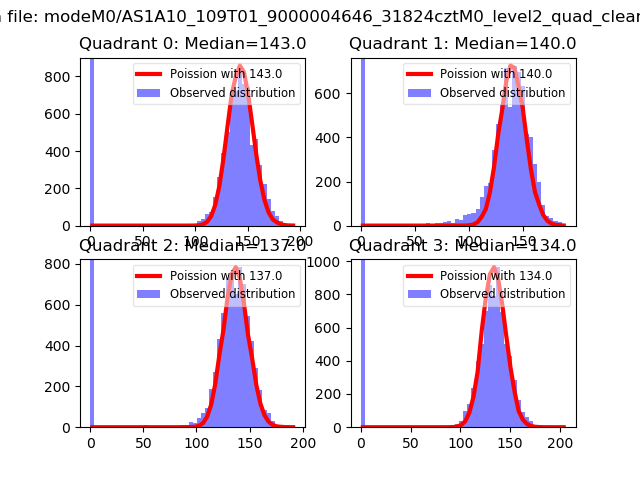 |
 |
| Quadrant-wise count rates Data is divided into 100 sec bins |
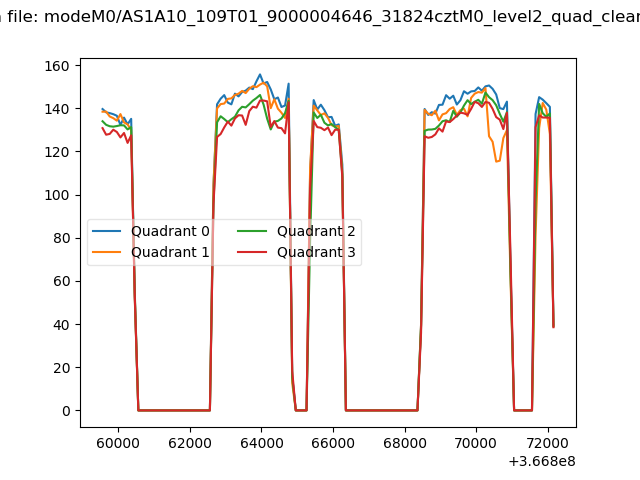 |
|
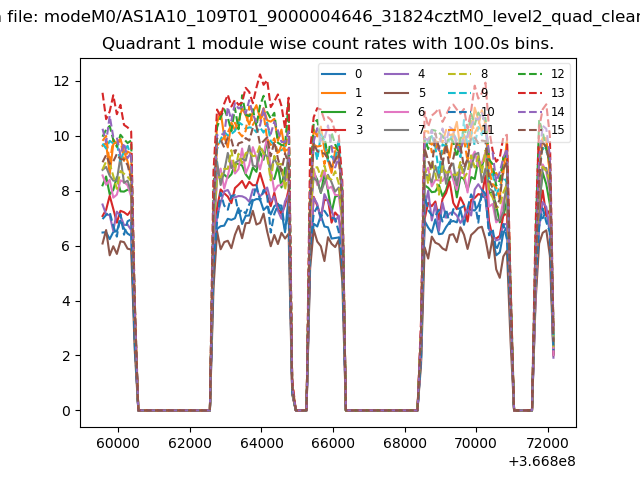
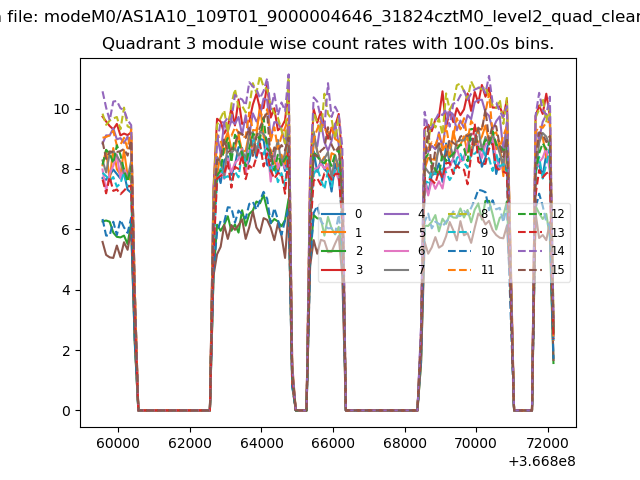
| Module-wise count rates for Quadrant A Data is divided into 100 sec bins |
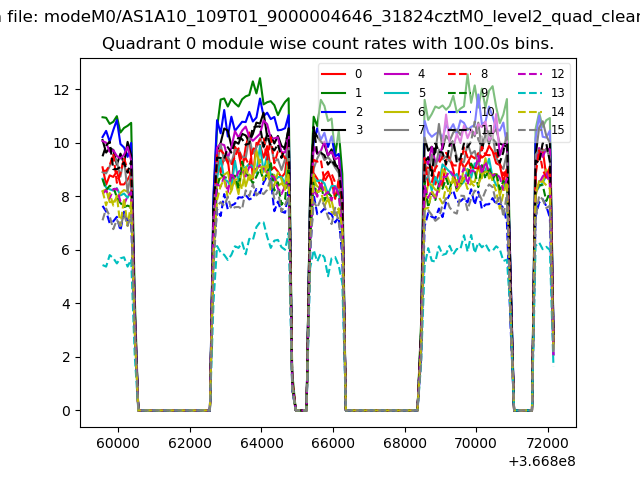 |
 |
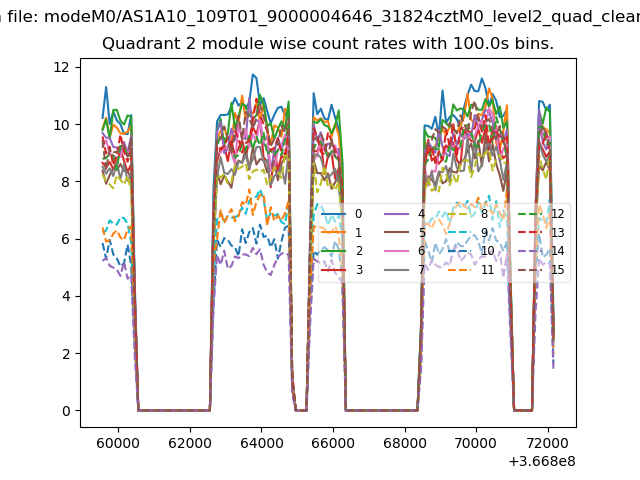
| Module-wise count rates for Quadrant B Data is divided into 100 sec bins |
 |
 |
| Module-wise count rates for Quadrant C Data is divided into 100 sec bins |
 |
 |
| Module-wise count rates for Quadrant D Data is divided into 100 sec bins |
 |
 |
| Parameter | Plot |
|---|---|
| CZT HV Monitor | 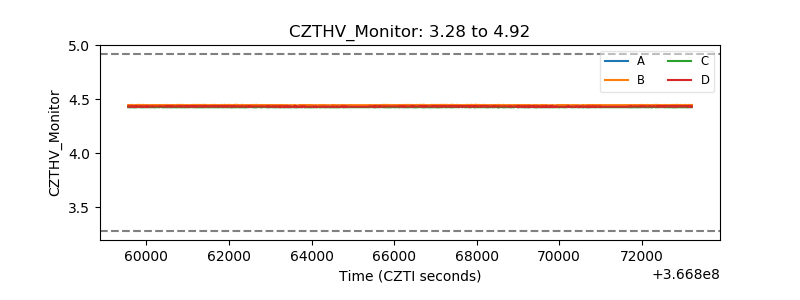 |
| D_VDD | 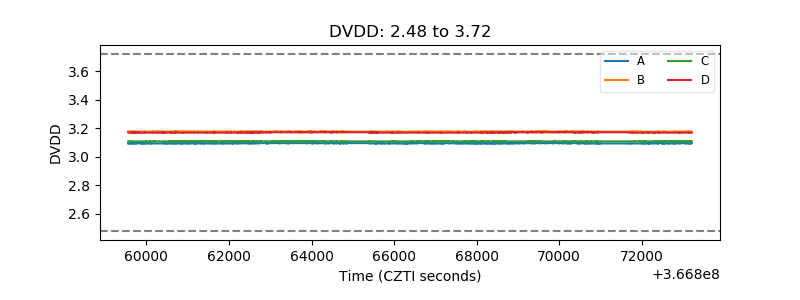 |
| Temperature 1 | 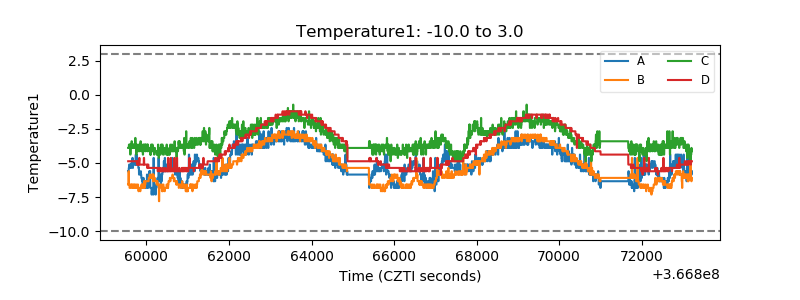 |
| Veto HV Monitor | 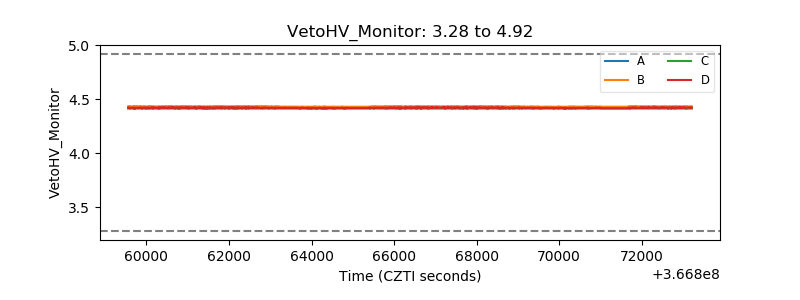 |
| Veto LLD | 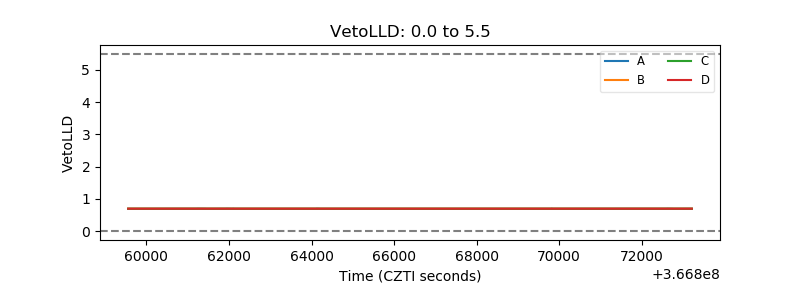 |
| Alpha Counter | 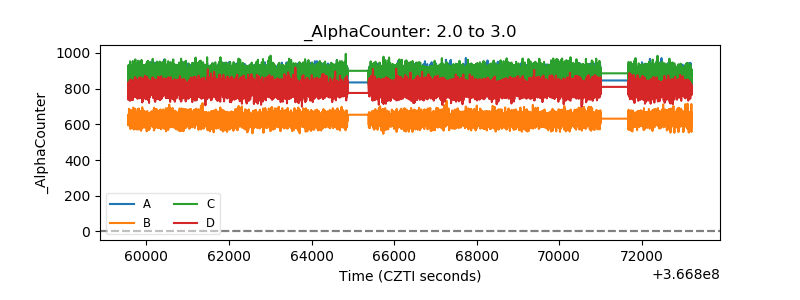 |
| _CPM_Rate | 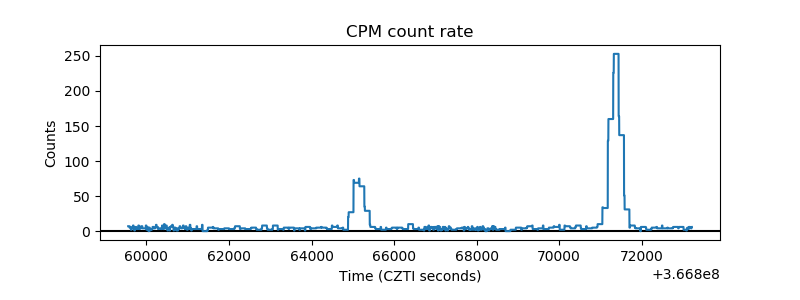 |
| CZT Counter | 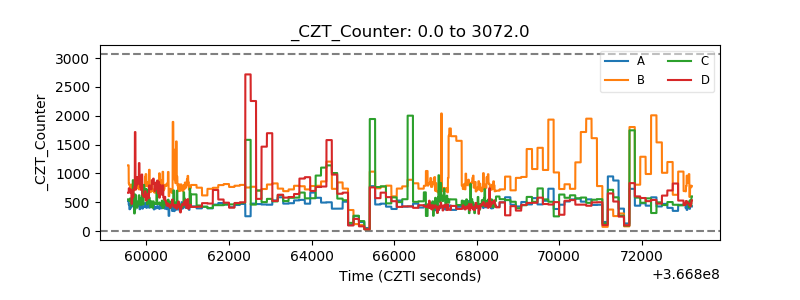 |
| +2.5 Volts monitor |  |
| +5 Volts monitor |  |
| _ROLL_ROT | 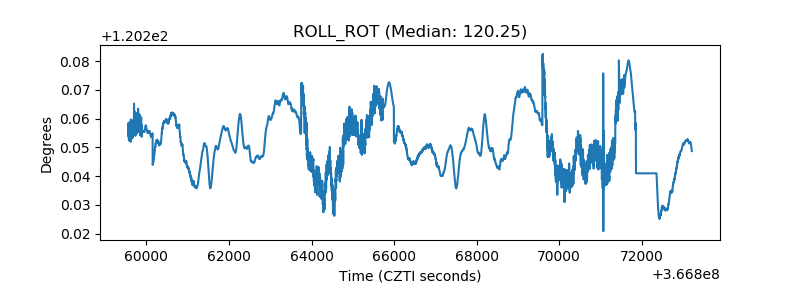 |
| _Roll_DEC | 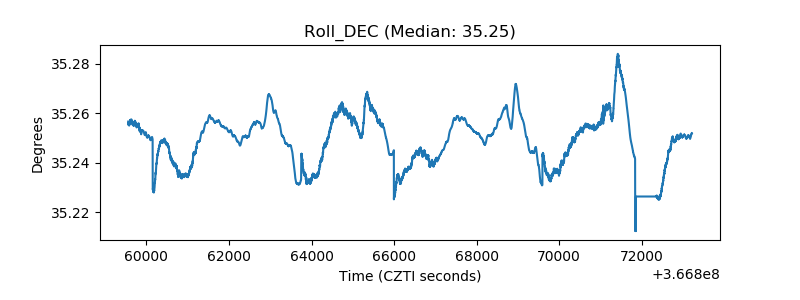 |
| _Roll_RA | 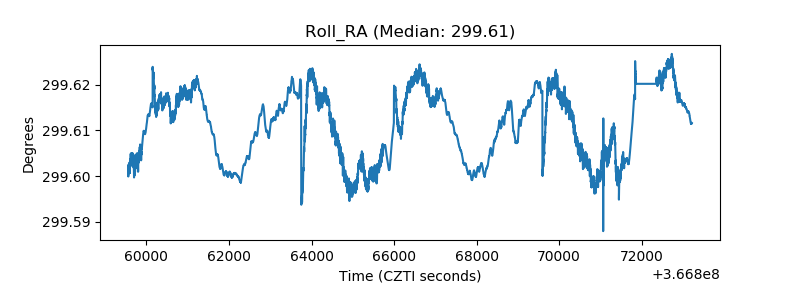 |
| Veto Counter | 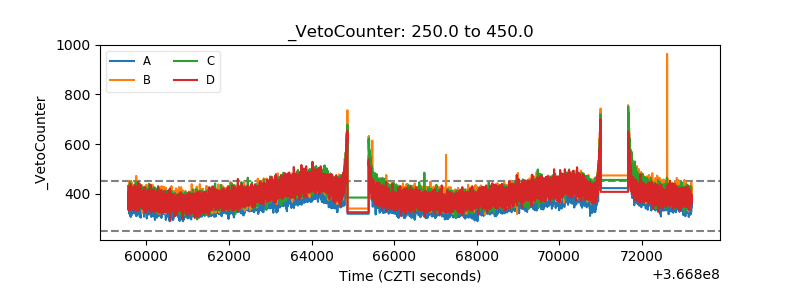 |