| Param | Original file | Final file |
|---|---|---|
| Filename | modeM0/AS1A10_109T01_9000004646_31829cztM0_level2.evt | modeM0/AS1A10_109T01_9000004646_31829cztM0_level2_quad_clean.evt |
| Size (bytes) | 618,451,200 | 102,188,160 |
| Size | 589.8 MB | 97.5 MB |
| Events in quadrant A | 3,710,454 | 690,409 |
| Events in quadrant B | 5,706,625 | 673,275 |
| Events in quadrant C | 4,703,984 | 638,976 |
| Events in quadrant D | 4,167,753 | 636,789 |
| Mode SS | |||
|---|---|---|---|
| Quadrant | BADHDUFLAG | Total packets | Discarded packets |
| A | 0 | 134 | 0 |
| B | 0 | 134 | 0 |
| C | 0 | 134 | 0 |
| D | 0 | 134 | 0 |
| Mode M0 | |||
|---|---|---|---|
| Quadrant | BADHDUFLAG | Total packets | Discarded packets |
| A | 0 | 15241 | 2 |
| B | 0 | 21515 | 2 |
| C | 0 | 18321 | 2 |
| D | 0 | 16666 | 2 |
| Mode M9 | |||
|---|---|---|---|
| Quadrant | BADHDUFLAG | Total packets | Discarded packets |
| A | 0 | 24 | 0 |
| B | 0 | 24 | 0 |
| C | 0 | 24 | 0 |
| D | 0 | 24 | 0 |
| Quadrant | Total seconds | Saturated seconds | Saturation percentage |
|---|---|---|---|
| A | 6530 | 112 | 1.715161% |
| B | 6530 | 278 | 4.257274% |
| C | 6530 | 445 | 6.814701% |
| D | 6531 | 94 | 1.439290% |
Noise dominated data is calculated using 1-second bins in cleaned event files. If a bin has >2000 counts, and if more than 50% of those come from <1% of pixels, then it is considered to be noise-dominated and hence unusable.
| Quadrant | # 1 sec bins | Bins with >0 counts | Bins with >2000 counts | High rate bins dominated by noise | Noise dominated (total time) | Noise dominated (detector-on time) | Marked lightcurve |
|---|---|---|---|---|---|---|---|
| A | 8895 | 6532 | 0 | 0 | 0.00% | 0.00% | 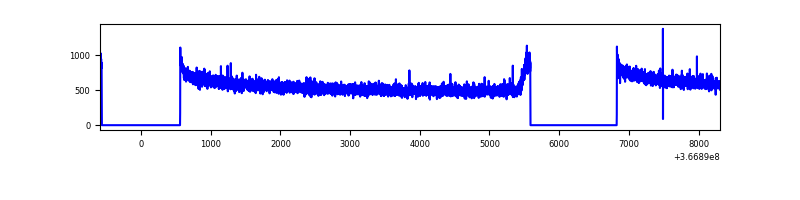 |
| B | 8895 | 6532 | 52 | 52 | 0.58% | 0.80% | 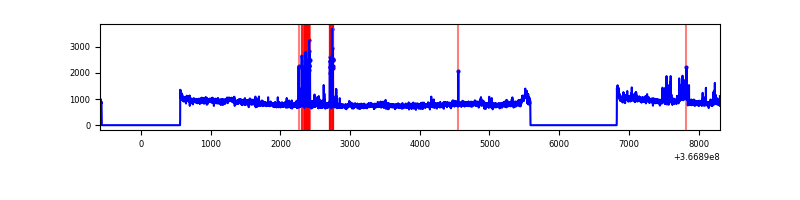 |
| C | 8895 | 6532 | 135 | 135 | 1.52% | 2.07% | 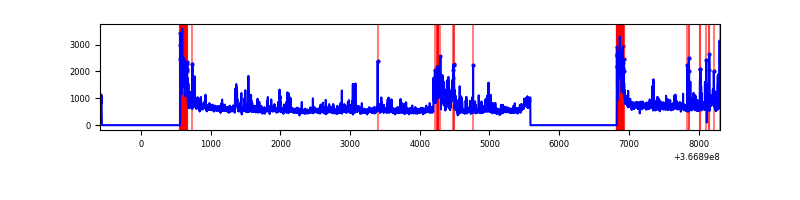 |
| D | 8896 | 6533 | 9 | 9 | 0.10% | 0.14% | 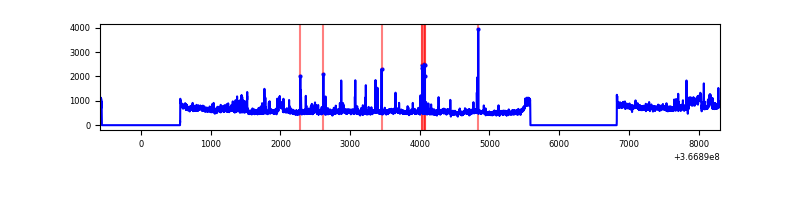 |
Top three noisy pixels from each quadrant. If the there are fewer than three noisy pixels in the level2.evt file, extra rows are filled as -1
| Pixel properties | Quadrant properties | ||||||
|---|---|---|---|---|---|---|---|
| Quadrant | DetID | PixID | Counts | Sigma | Mean | Median | Sigma |
| A | 13 | 254 | 10860 | 52.6 | 960 | 948 | 188.5 |
| A | 3 | 137 | 8836 | 41.86 | 960 | 948 | 188.5 |
| A | 0 | 226 | 8179 | 38.37 | 960 | 948 | 188.5 |
| B | 6 | 159 | 1716277 | 9909.73 | 925 | 906 | 173.1 |
| B | 10 | 245 | 287092 | 1653.3 | 925 | 906 | 173.1 |
| B | 0 | 183 | 67953 | 387.33 | 925 | 906 | 173.1 |
| C | 0 | 10 | 574219 | 2857.42 | 875 | 885 | 200.6 |
| C | 3 | 233 | 484179 | 2408.67 | 875 | 885 | 200.6 |
| C | 14 | 238 | 159895 | 792.48 | 875 | 885 | 200.6 |
| D | 8 | 195 | 517074 | 2432.26 | 915 | 896 | 212.2 |
| D | 2 | 250 | 85857 | 400.34 | 915 | 896 | 212.2 |
| D | 13 | 174 | 60807 | 282.3 | 915 | 896 | 212.2 |
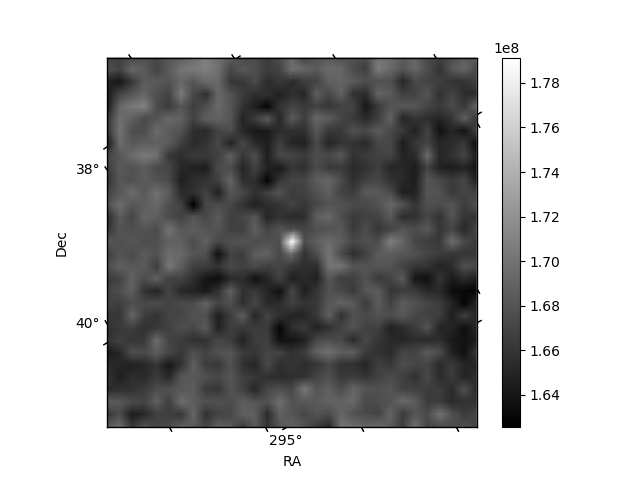
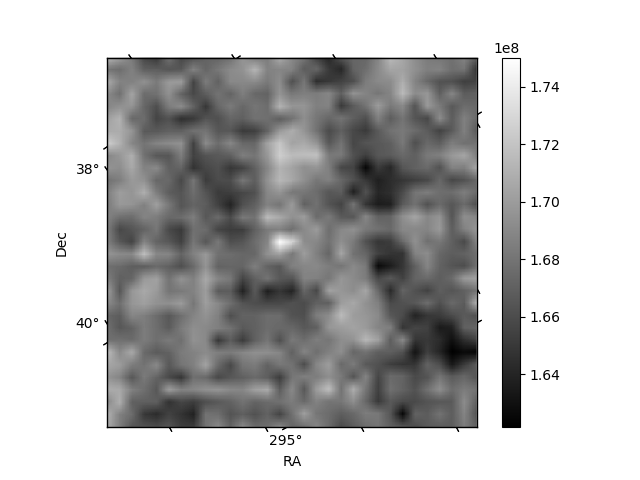
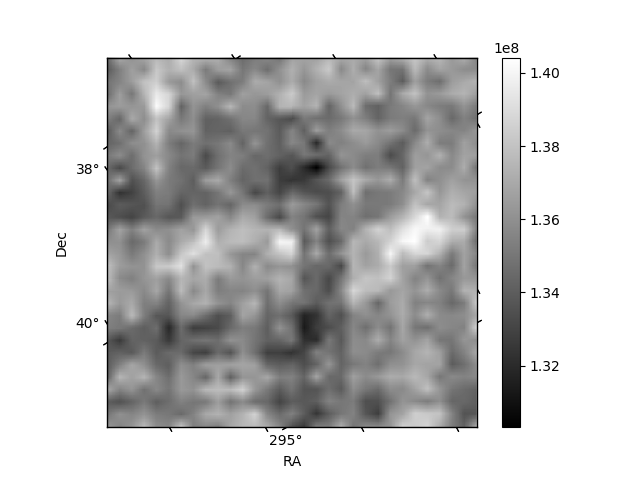
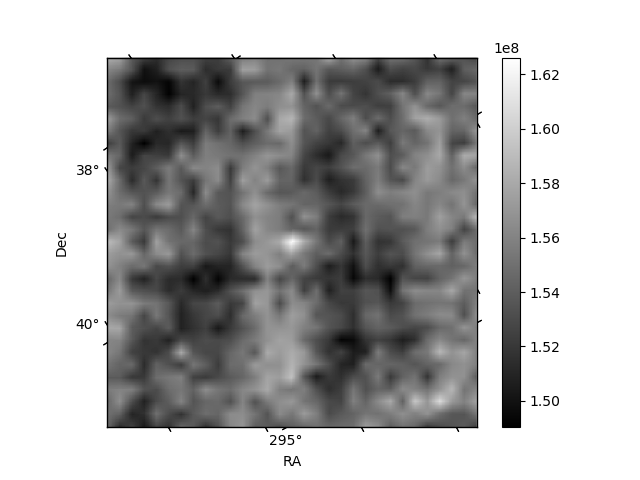
Histogram calculated using DETX and DETY for each event in the final _common_clean file
| Quadrant A | 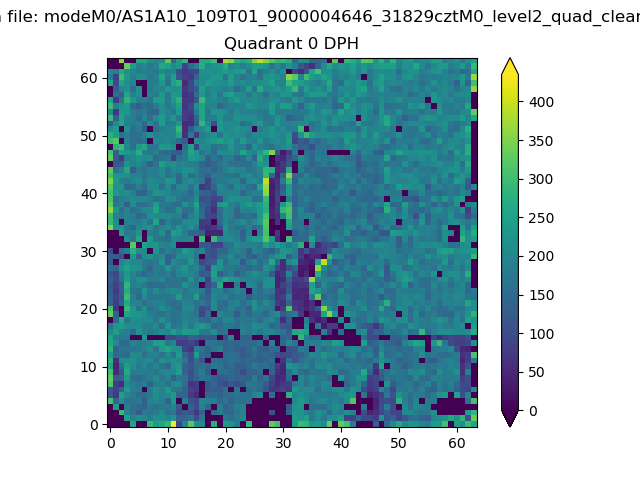 |
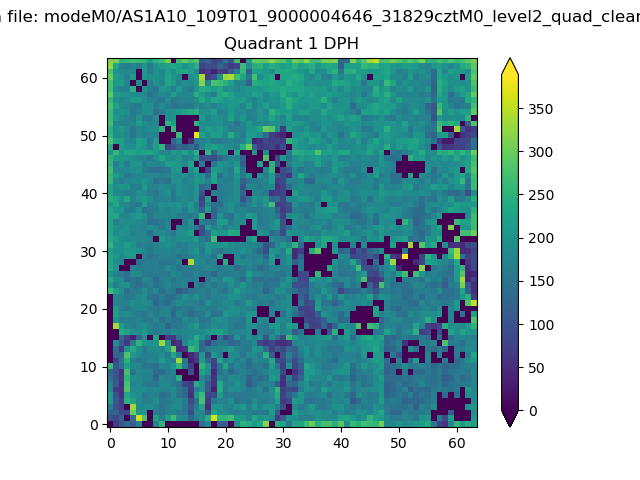 |
Quadrant B |
|---|---|---|---|
| Quadrant D | 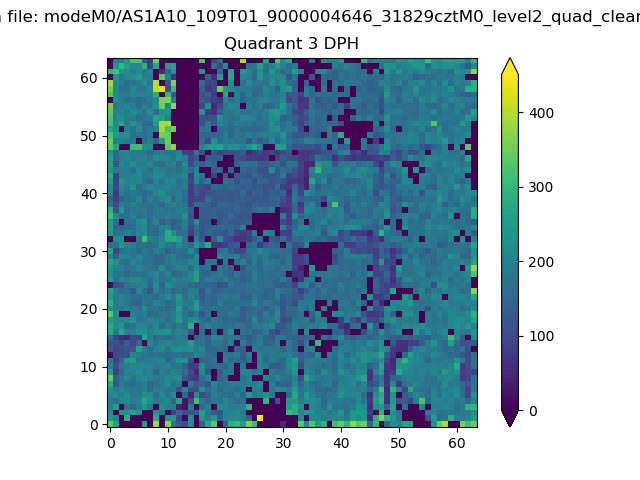 |
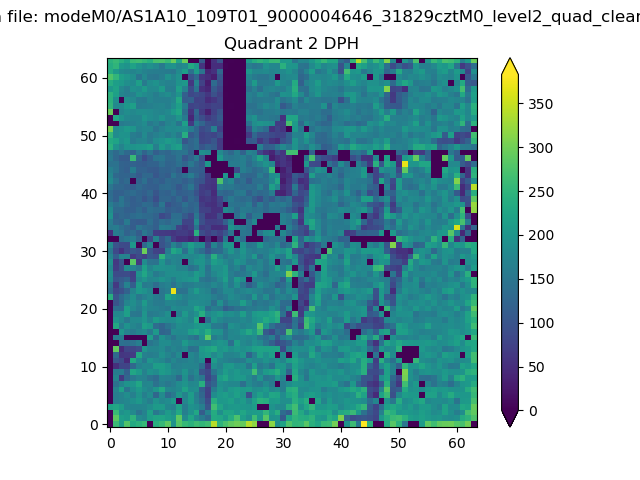 |
Quadrant C |
| Plot type | Count rate plots | Images |
|---|---|---|
| Comparison with Poisson distribution Blue bars denote a histogram of data divided into 1 sec bins. Red curve is a Poisson curve with rate = median count rate of data. |
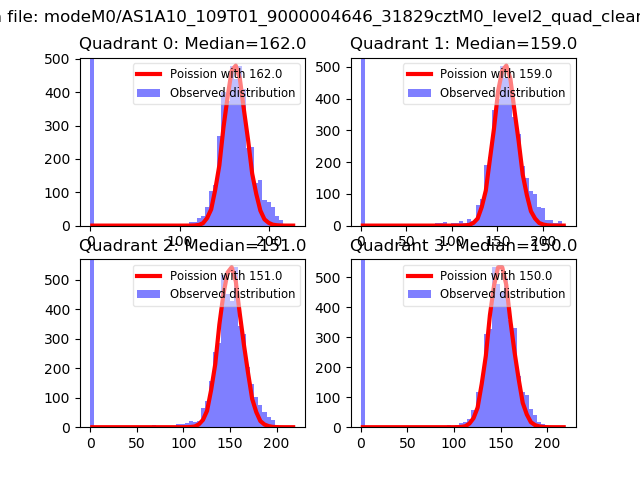 |
 |
| Quadrant-wise count rates Data is divided into 100 sec bins |
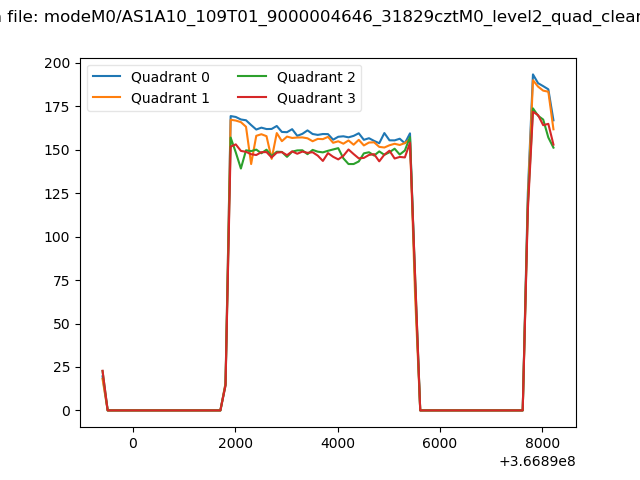 |
|
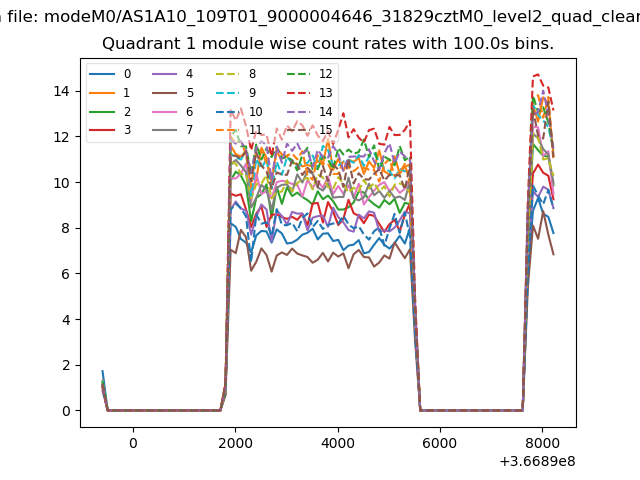
| Module-wise count rates for Quadrant A Data is divided into 100 sec bins |
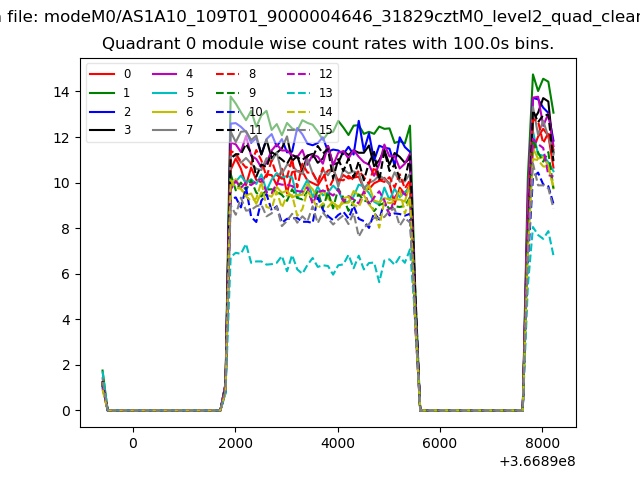 |
 |
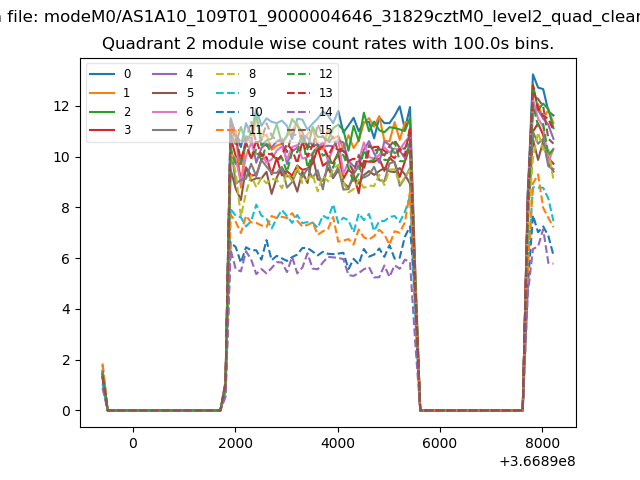
| Module-wise count rates for Quadrant B Data is divided into 100 sec bins |
 |
 |
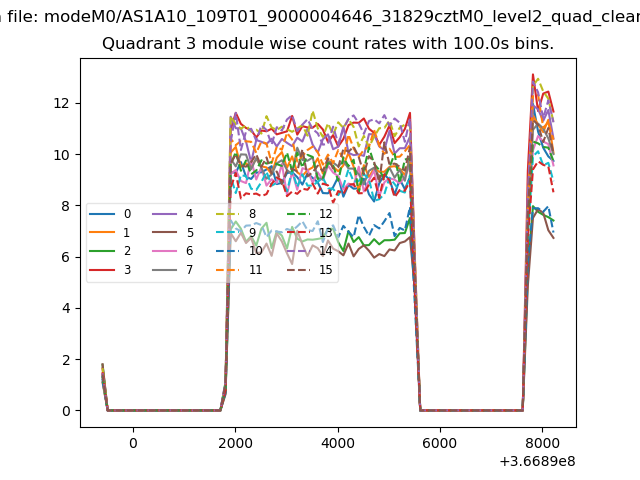
| Module-wise count rates for Quadrant C Data is divided into 100 sec bins |
 |
 |
| Module-wise count rates for Quadrant D Data is divided into 100 sec bins |
 |
 |
| Parameter | Plot |
|---|---|
| CZT HV Monitor | 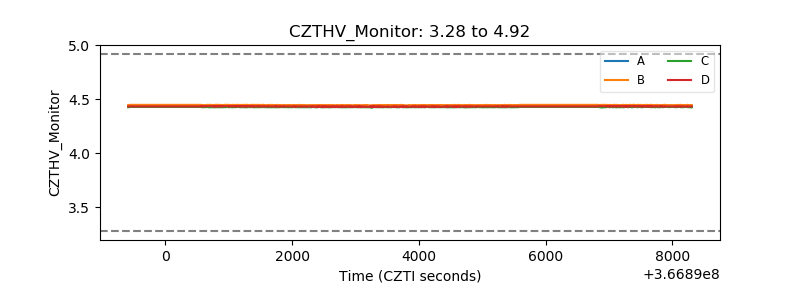 |
| D_VDD | 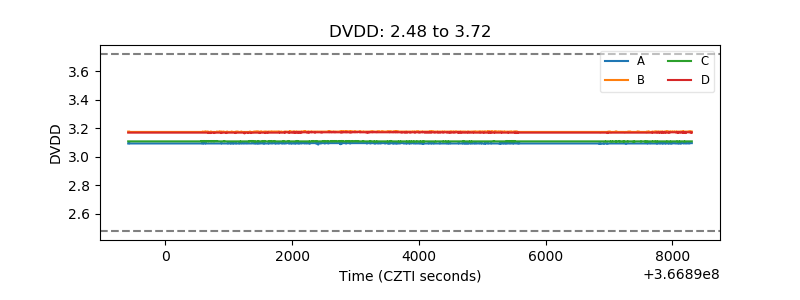 |
| Temperature 1 | 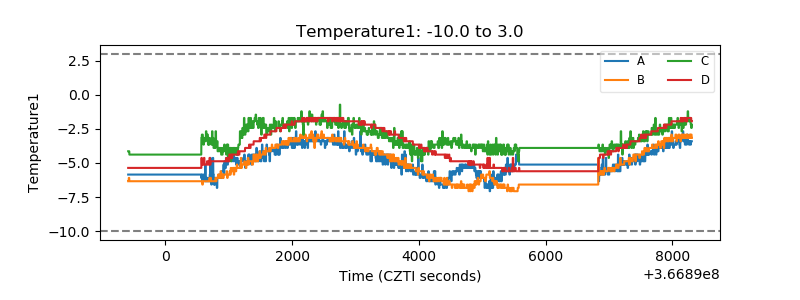 |
| Veto HV Monitor | 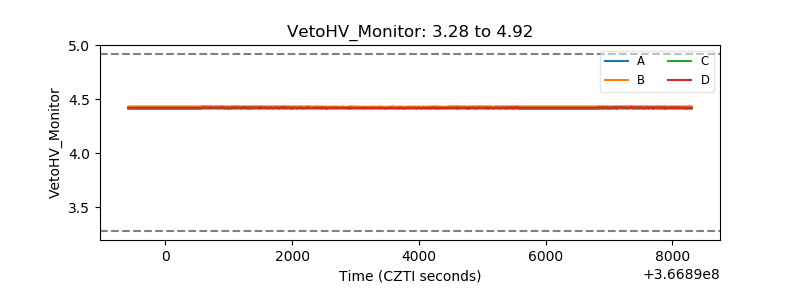 |
| Veto LLD | 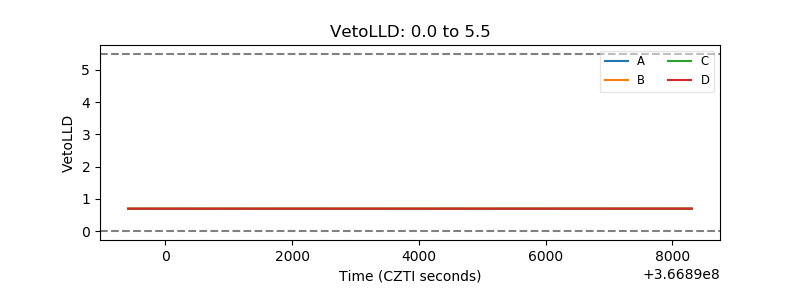 |
| Alpha Counter | 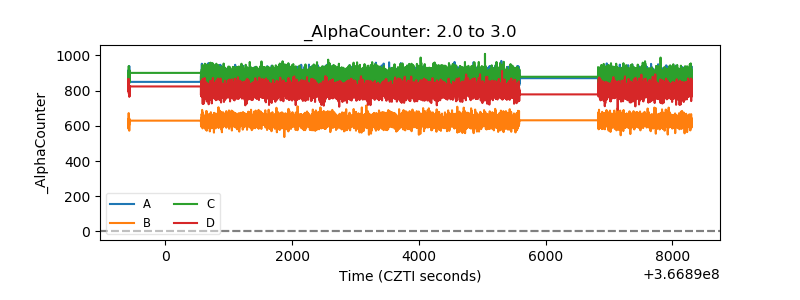 |
| _CPM_Rate | 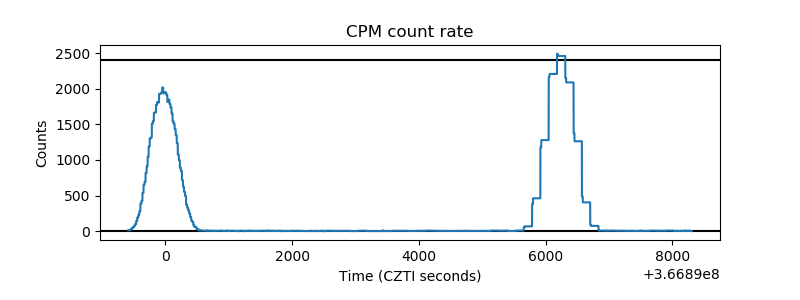 |
| CZT Counter | 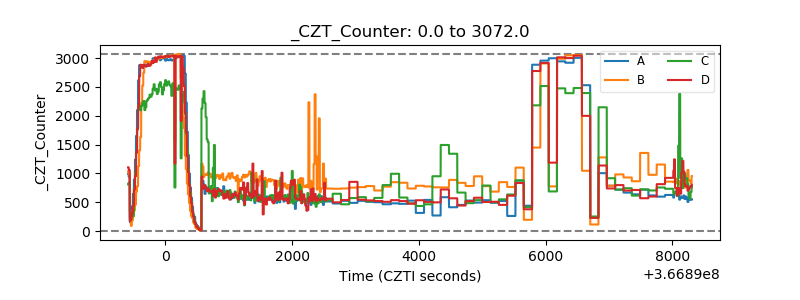 |
| +2.5 Volts monitor | 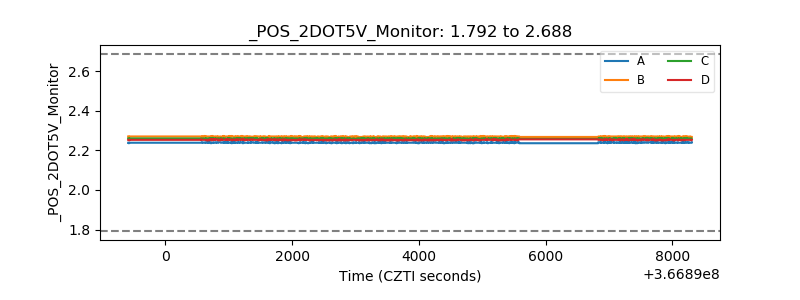 |
| +5 Volts monitor |  |
| _ROLL_ROT | 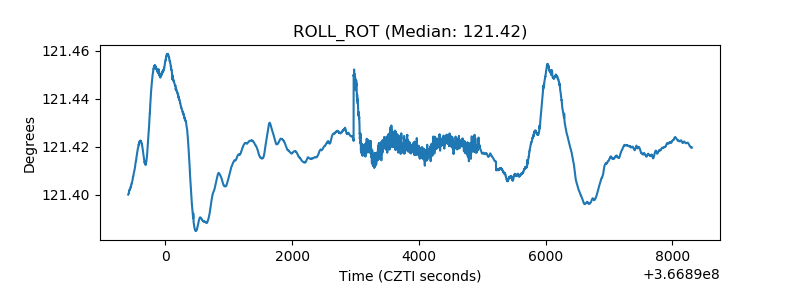 |
| _Roll_DEC | 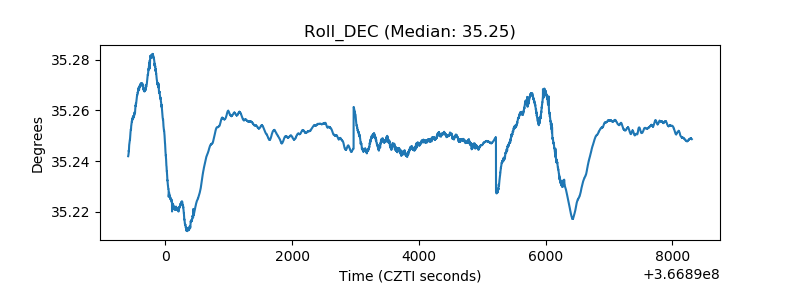 |
| _Roll_RA | 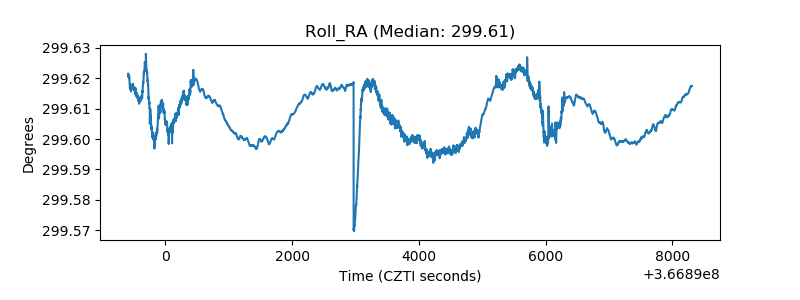 |
| Veto Counter | 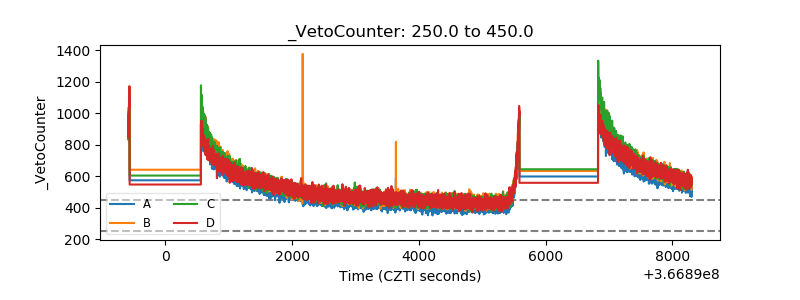 |