| Param | Original file | Final file |
|---|---|---|
| Filename | modeM0/AS1A10_109T01_9000004646_31830cztM0_level2.evt | modeM0/AS1A10_109T01_9000004646_31830cztM0_level2_quad_clean.evt |
| Size (bytes) | 629,239,680 | 116,971,200 |
| Size | 600.1 MB | 111.6 MB |
| Events in quadrant A | 3,635,311 | 812,883 |
| Events in quadrant B | 5,576,419 | 794,628 |
| Events in quadrant C | 4,694,671 | 754,769 |
| Events in quadrant D | 4,727,295 | 743,168 |
| Mode SS | |||
|---|---|---|---|
| Quadrant | BADHDUFLAG | Total packets | Discarded packets |
| A | 0 | 128 | 0 |
| B | 0 | 128 | 0 |
| C | 0 | 128 | 0 |
| D | 0 | 128 | 0 |
| Mode M0 | |||
|---|---|---|---|
| Quadrant | BADHDUFLAG | Total packets | Discarded packets |
| A | 0 | 14970 | 1 |
| B | 0 | 20681 | 1 |
| C | 0 | 18770 | 1 |
| D | 0 | 18571 | 2 |
| Mode M9 | |||
|---|---|---|---|
| Quadrant | BADHDUFLAG | Total packets | Discarded packets |
| A | 0 | 13 | 0 |
| B | 0 | 13 | 0 |
| C | 0 | 13 | 0 |
| D | 0 | 13 | 0 |
| Quadrant | Total seconds | Saturated seconds | Saturation percentage |
|---|---|---|---|
| A | 6261 | 110 | 1.756908% |
| B | 6261 | 207 | 3.306181% |
| C | 6261 | 392 | 6.260981% |
| D | 6261 | 129 | 2.060374% |
Noise dominated data is calculated using 1-second bins in cleaned event files. If a bin has >2000 counts, and if more than 50% of those come from <1% of pixels, then it is considered to be noise-dominated and hence unusable.
| Quadrant | # 1 sec bins | Bins with >0 counts | Bins with >2000 counts | High rate bins dominated by noise | Noise dominated (total time) | Noise dominated (detector-on time) | Marked lightcurve |
|---|---|---|---|---|---|---|---|
| A | 7561 | 6262 | 0 | 0 | 0.00% | 0.00% | 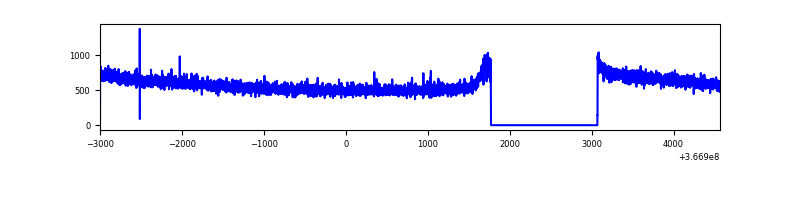 |
| B | 7561 | 6262 | 23 | 23 | 0.30% | 0.37% | 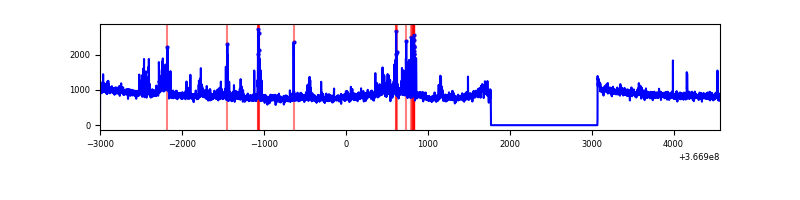 |
| C | 7561 | 6262 | 83 | 83 | 1.10% | 1.33% | 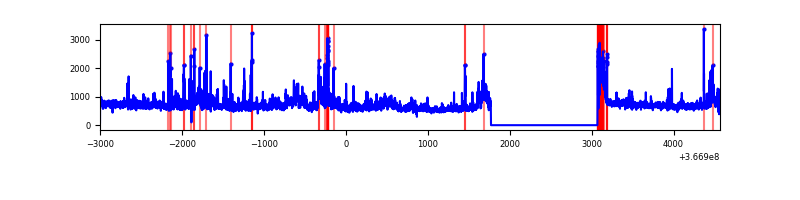 |
| D | 7561 | 6262 | 47 | 47 | 0.62% | 0.75% | 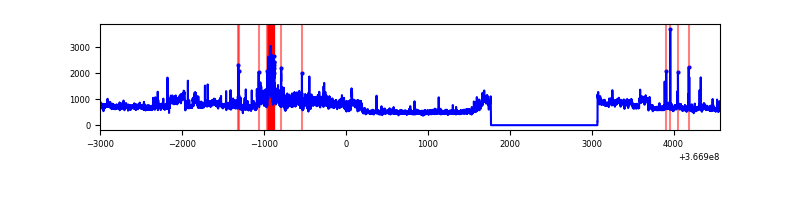 |
Top three noisy pixels from each quadrant. If the there are fewer than three noisy pixels in the level2.evt file, extra rows are filled as -1
| Pixel properties | Quadrant properties | ||||||
|---|---|---|---|---|---|---|---|
| Quadrant | DetID | PixID | Counts | Sigma | Mean | Median | Sigma |
| A | 13 | 254 | 10850 | 53.85 | 942 | 931 | 184.2 |
| A | 3 | 137 | 8468 | 40.92 | 942 | 931 | 184.2 |
| A | 0 | 226 | 8089 | 38.86 | 942 | 931 | 184.2 |
| B | 6 | 159 | 1611089 | 9546.74 | 905 | 887 | 168.7 |
| B | 10 | 245 | 376022 | 2224.14 | 905 | 887 | 168.7 |
| B | 0 | 183 | 26800 | 153.64 | 905 | 887 | 168.7 |
| C | 3 | 233 | 657617 | 3280.4 | 872 | 884 | 200.2 |
| C | 0 | 10 | 432612 | 2156.5 | 872 | 884 | 200.2 |
| C | 14 | 238 | 160289 | 796.23 | 872 | 884 | 200.2 |
| D | 8 | 195 | 1099827 | 5238.74 | 901 | 886 | 209.8 |
| D | 12 | 233 | 168455 | 798.81 | 901 | 886 | 209.8 |
| D | 2 | 250 | 44834 | 209.5 | 901 | 886 | 209.8 |
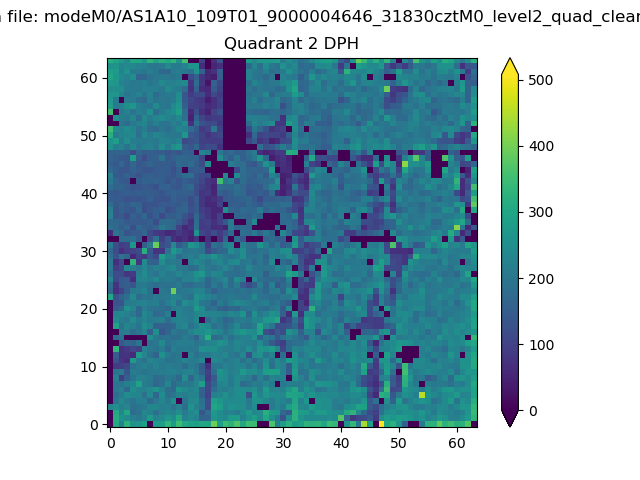
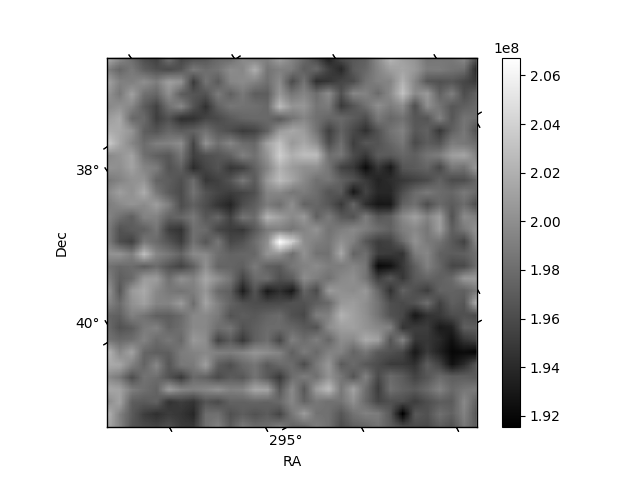
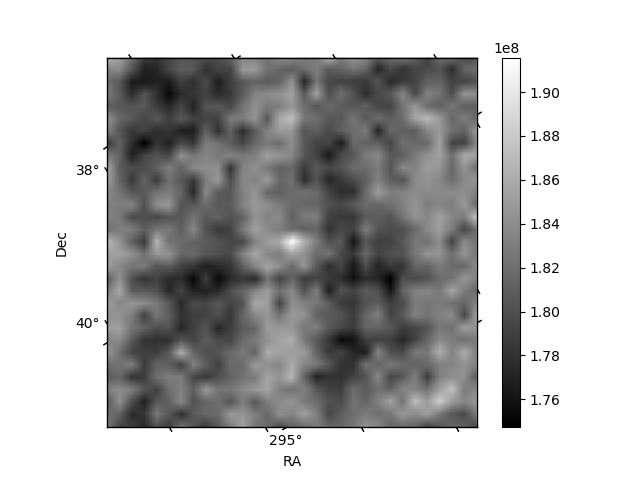
Histogram calculated using DETX and DETY for each event in the final _common_clean file
| Quadrant A | 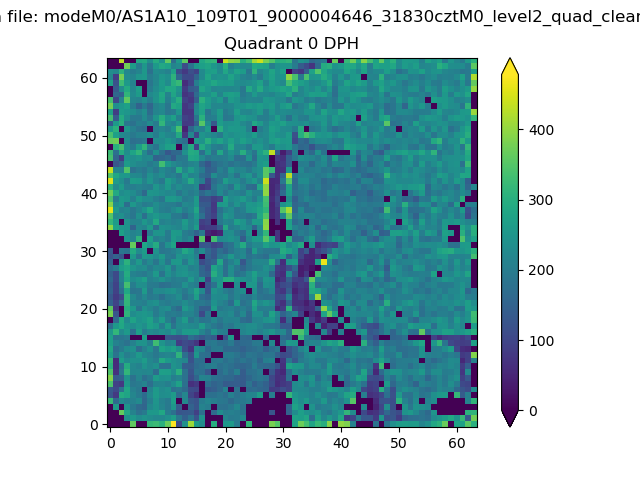 |
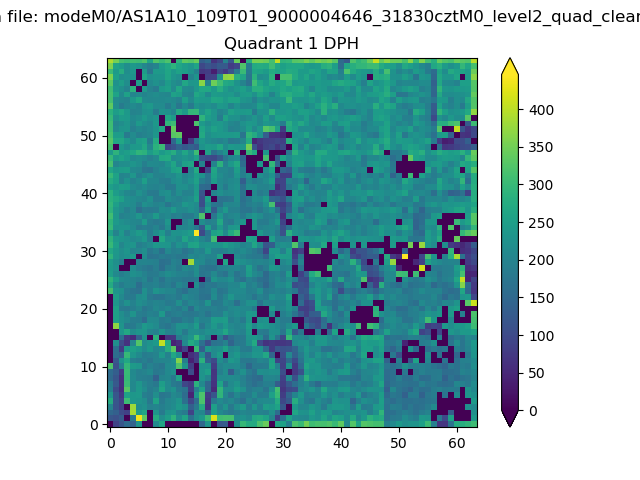 |
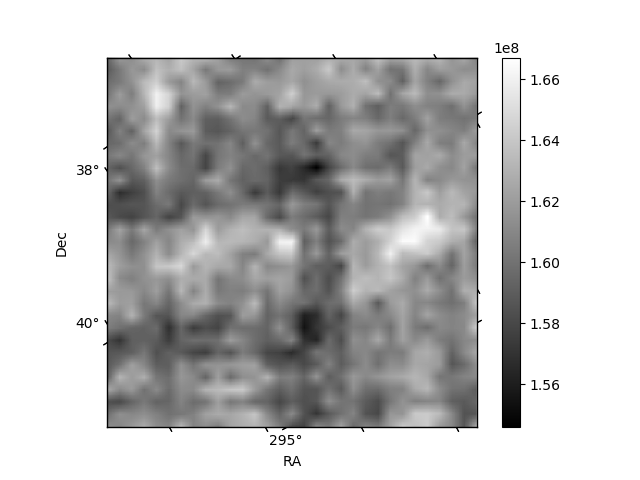
Quadrant B |
|---|---|---|---|
| Quadrant D | 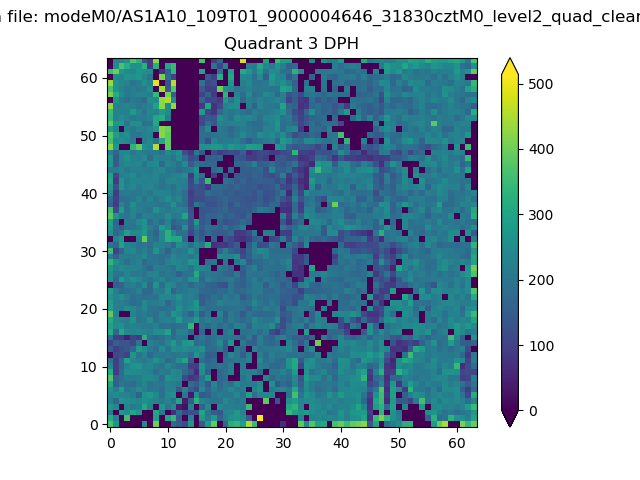 |
 |
Quadrant C |
| Plot type | Count rate plots | Images |
|---|---|---|
| Comparison with Poisson distribution Blue bars denote a histogram of data divided into 1 sec bins. Red curve is a Poisson curve with rate = median count rate of data. |
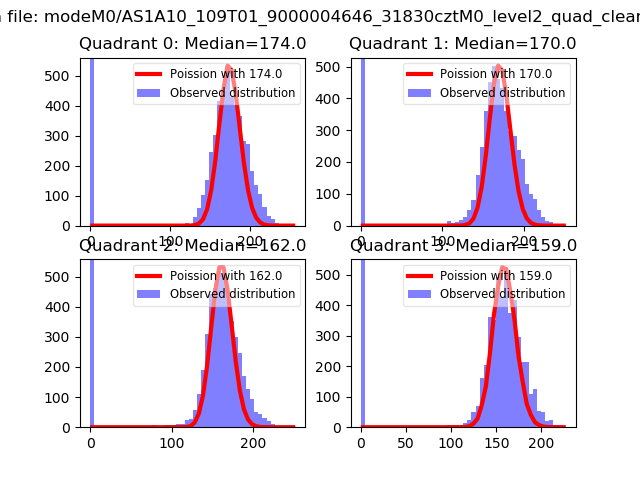 |
 |
| Quadrant-wise count rates Data is divided into 100 sec bins |
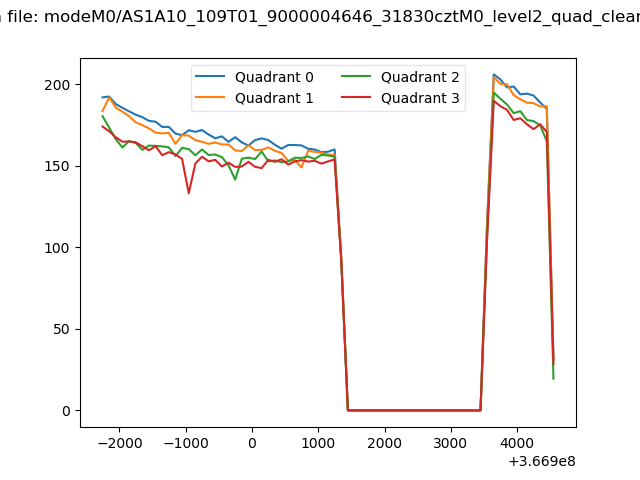 |
|
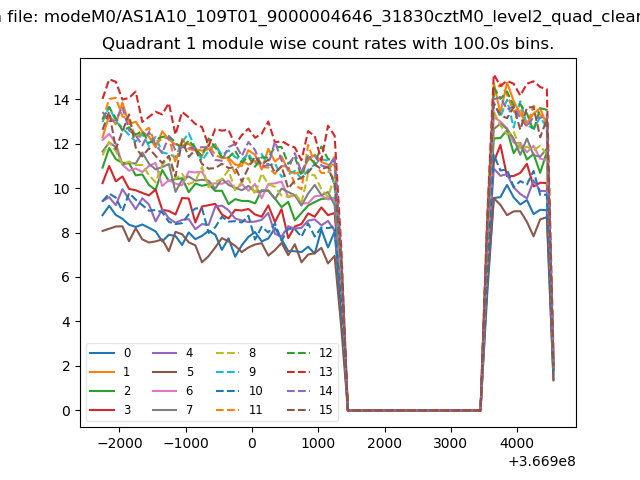
| Module-wise count rates for Quadrant A Data is divided into 100 sec bins |
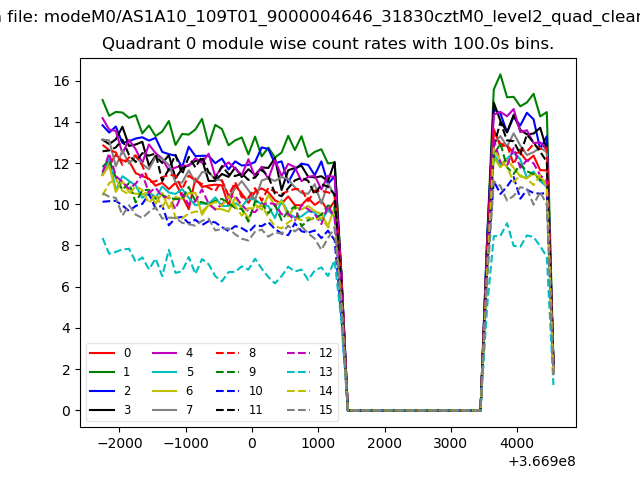 |
 |
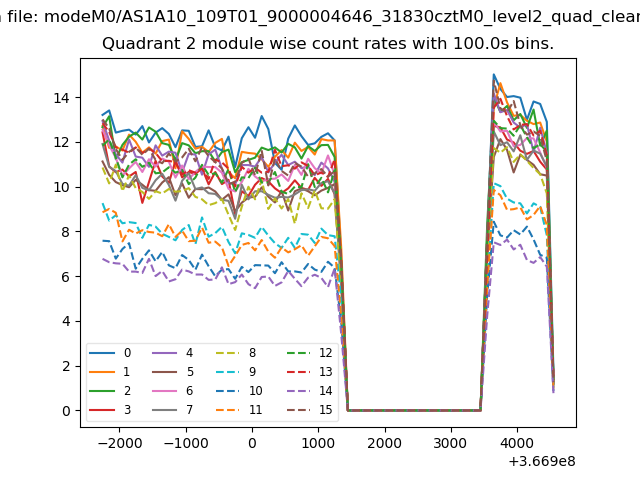
| Module-wise count rates for Quadrant B Data is divided into 100 sec bins |
 |
 |
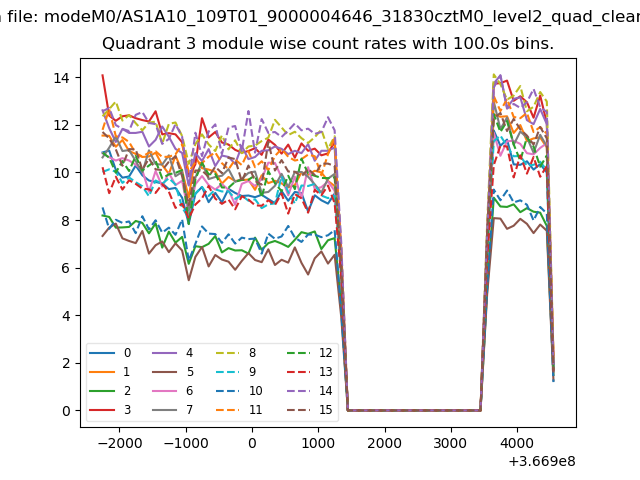
| Module-wise count rates for Quadrant C Data is divided into 100 sec bins |
 |
 |
| Module-wise count rates for Quadrant D Data is divided into 100 sec bins |
 |
 |
| Parameter | Plot |
|---|---|
| CZT HV Monitor | 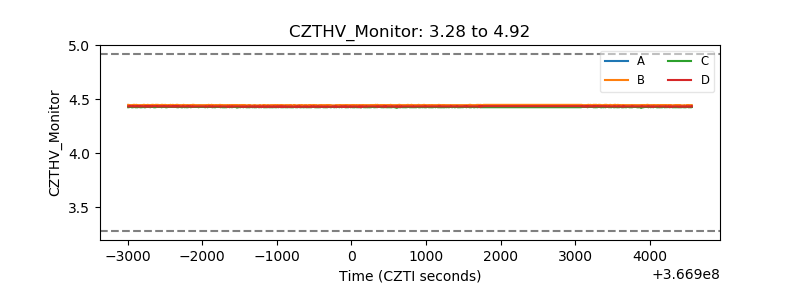 |
| D_VDD | 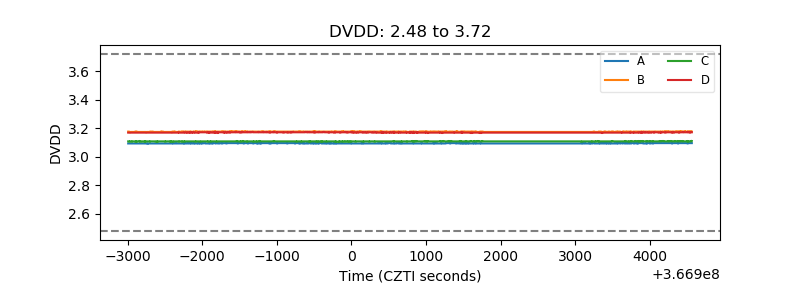 |
| Temperature 1 | 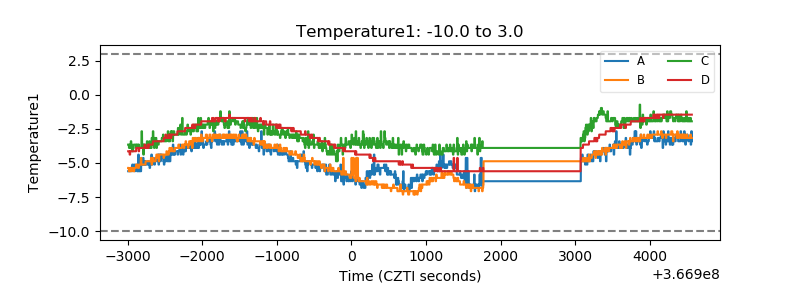 |
| Veto HV Monitor | 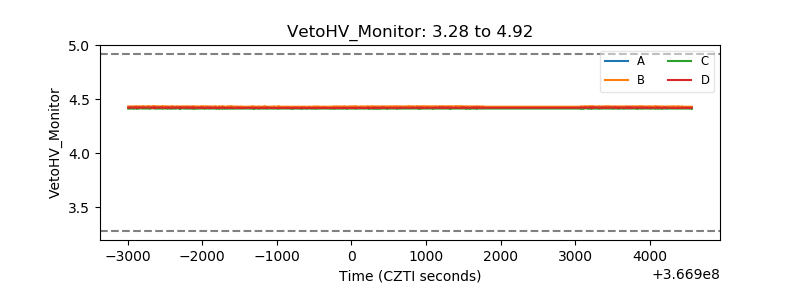 |
| Veto LLD | 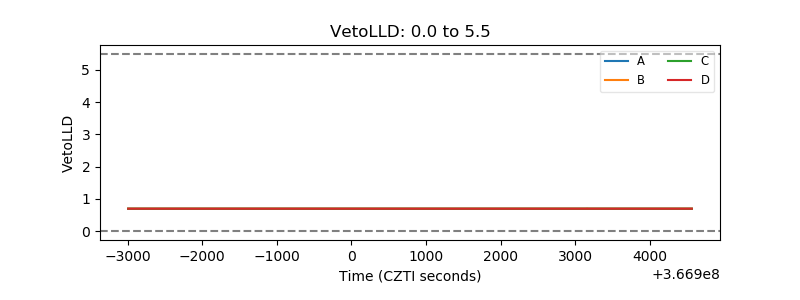 |
| Alpha Counter | 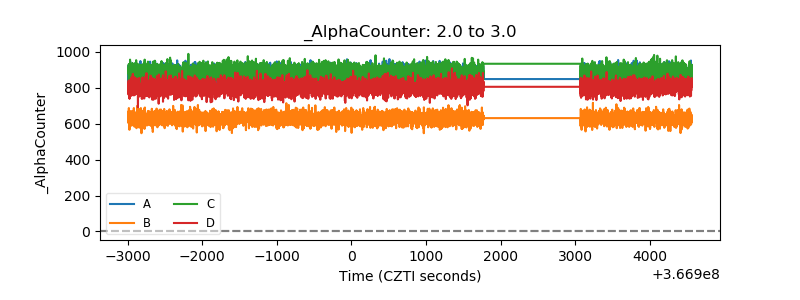 |
| _CPM_Rate | 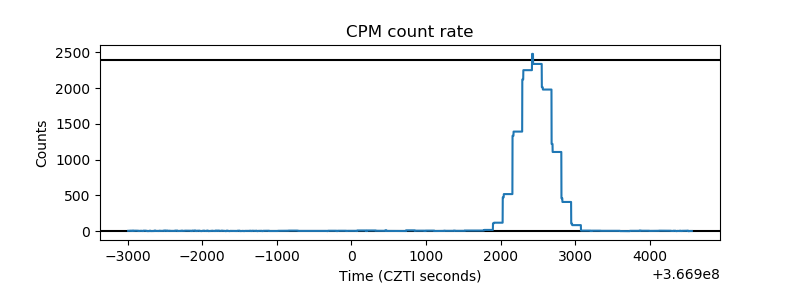 |
| CZT Counter |  |
| +2.5 Volts monitor |  |
| +5 Volts monitor |  |
| _ROLL_ROT | 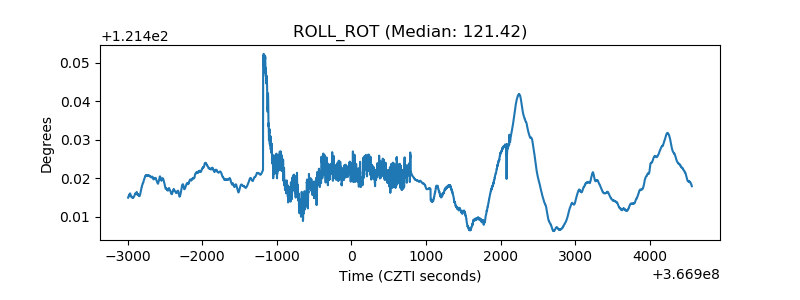 |
| _Roll_DEC |  |
| _Roll_RA |  |
| Veto Counter | 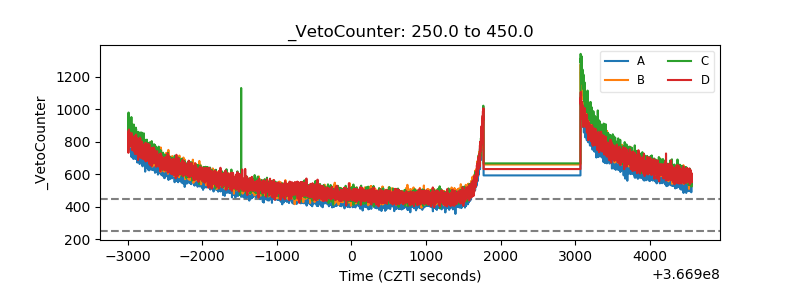 |