| Param | Original file | Final file |
|---|---|---|
| Filename | modeM0/AS1A10_109T01_9000004646_31831cztM0_level2.evt | modeM0/AS1A10_109T01_9000004646_31831cztM0_level2_quad_clean.evt |
| Size (bytes) | 485,400,960 | 102,228,480 |
| Size | 462.9 MB | 97.5 MB |
| Events in quadrant A | 2,749,172 | 715,383 |
| Events in quadrant B | 3,971,870 | 704,430 |
| Events in quadrant C | 3,664,395 | 673,909 |
| Events in quadrant D | 3,980,071 | 655,529 |
| Mode SS | |||
|---|---|---|---|
| Quadrant | BADHDUFLAG | Total packets | Discarded packets |
| A | 0 | 102 | 2 |
| B | 0 | 102 | 0 |
| C | 0 | 103 | 3 |
| D | 0 | 103 | 1 |
| Mode M0 | |||
|---|---|---|---|
| Quadrant | BADHDUFLAG | Total packets | Discarded packets |
| A | 0 | 11327 | 154 |
| B | 0 | 15388 | 201 |
| C | 0 | 14547 | 217 |
| D | 0 | 15423 | 190 |
| Mode M9 | |||
|---|---|---|---|
| Quadrant | BADHDUFLAG | Total packets | Discarded packets |
| A | 0 | 13 | 0 |
| B | 0 | 13 | 0 |
| C | 0 | 13 | 0 |
| D | 0 | 13 | 0 |
| Quadrant | Total seconds | Saturated seconds | Saturation percentage |
|---|---|---|---|
| A | 4946 | 108 | 2.183583% |
| B | 4947 | 178 | 3.598140% |
| C | 4948 | 371 | 7.497979% |
| D | 4947 | 131 | 2.648070% |
Noise dominated data is calculated using 1-second bins in cleaned event files. If a bin has >2000 counts, and if more than 50% of those come from <1% of pixels, then it is considered to be noise-dominated and hence unusable.
| Quadrant | # 1 sec bins | Bins with >0 counts | Bins with >2000 counts | High rate bins dominated by noise | Noise dominated (total time) | Noise dominated (detector-on time) | Marked lightcurve |
|---|---|---|---|---|---|---|---|
| A | 6300 | 4956 | 0 | 0 | 0.00% | 0.00% | 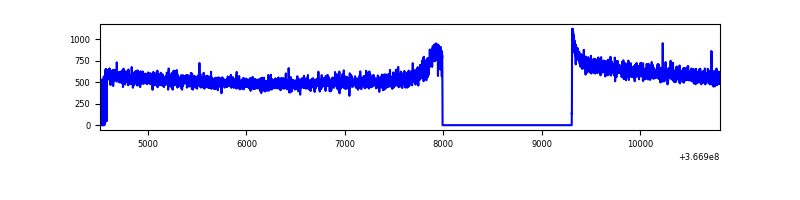 |
| B | 6269 | 4952 | 1 | 1 | 0.02% | 0.02% | 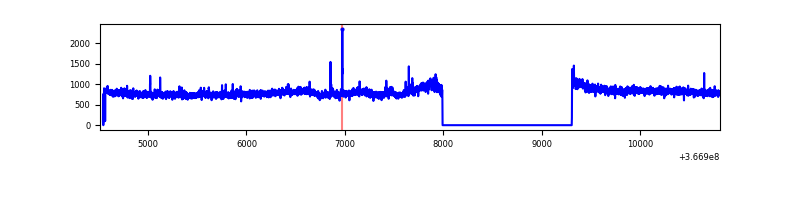 |
| C | 6272 | 4954 | 73 | 73 | 1.16% | 1.47% | 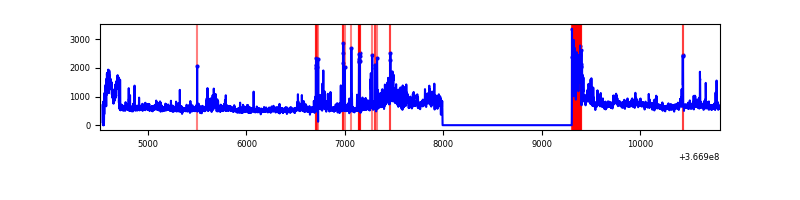 |
| D | 6275 | 4955 | 32 | 32 | 0.51% | 0.65% | 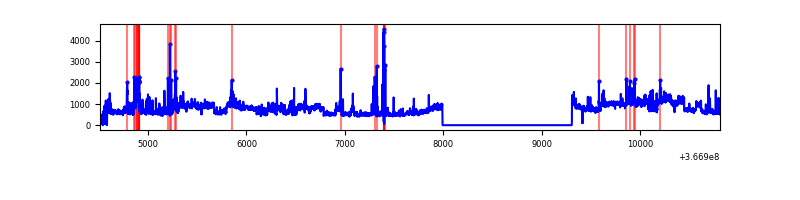 |
Top three noisy pixels from each quadrant. If the there are fewer than three noisy pixels in the level2.evt file, extra rows are filled as -1
| Pixel properties | Quadrant properties | ||||||
|---|---|---|---|---|---|---|---|
| Quadrant | DetID | PixID | Counts | Sigma | Mean | Median | Sigma |
| A | 13 | 254 | 8319 | 53.97 | 711 | 701 | 141.1 |
| A | 3 | 137 | 6478 | 40.93 | 711 | 701 | 141.1 |
| A | 13 | 6 | 6177 | 38.79 | 711 | 701 | 141.1 |
| B | 6 | 159 | 1250897 | 9662.6 | 688 | 673 | 129.4 |
| B | 10 | 245 | 17837 | 132.66 | 688 | 673 | 129.4 |
| B | 12 | 111 | 14804 | 109.21 | 688 | 673 | 129.4 |
| C | 3 | 233 | 542912 | 3519.77 | 664 | 672 | 154.1 |
| C | 0 | 10 | 373318 | 2418.91 | 664 | 672 | 154.1 |
| C | 14 | 238 | 122776 | 792.6 | 664 | 672 | 154.1 |
| D | 8 | 195 | 1044810 | 6485.42 | 687 | 673 | 161.0 |
| D | 12 | 218 | 106474 | 657.16 | 687 | 673 | 161.0 |
| D | 12 | 233 | 83779 | 516.19 | 687 | 673 | 161.0 |
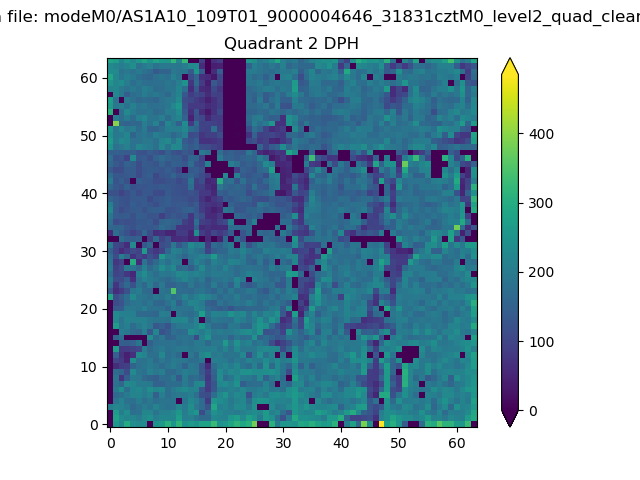
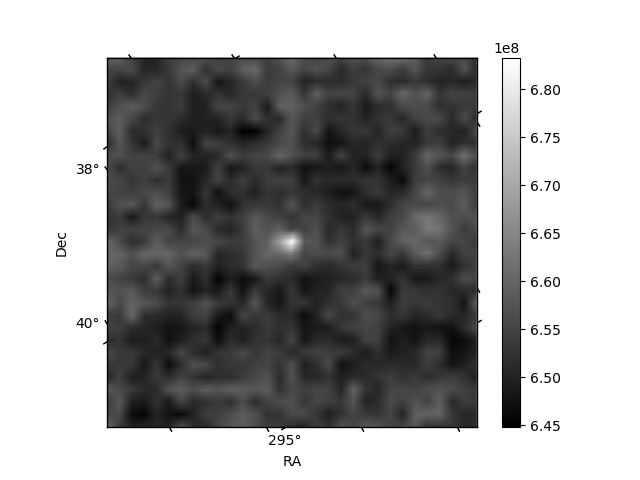
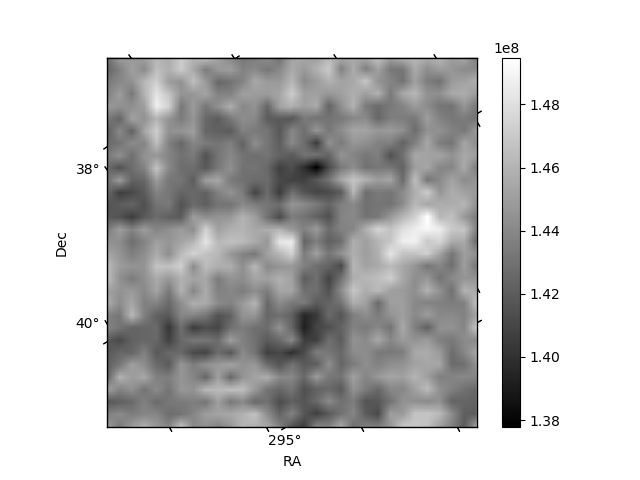
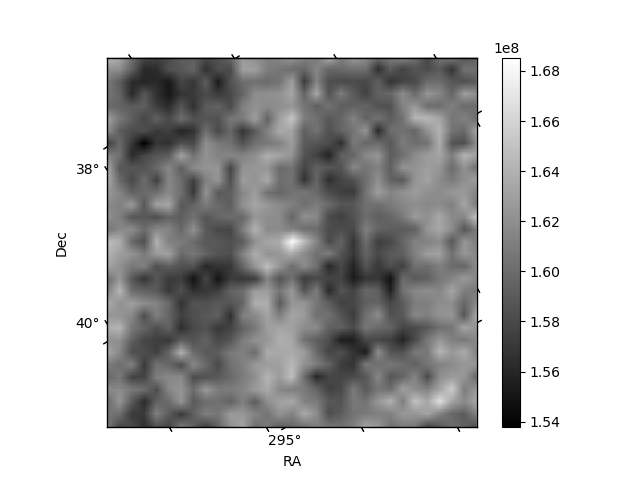
Histogram calculated using DETX and DETY for each event in the final _common_clean file
| Quadrant A | 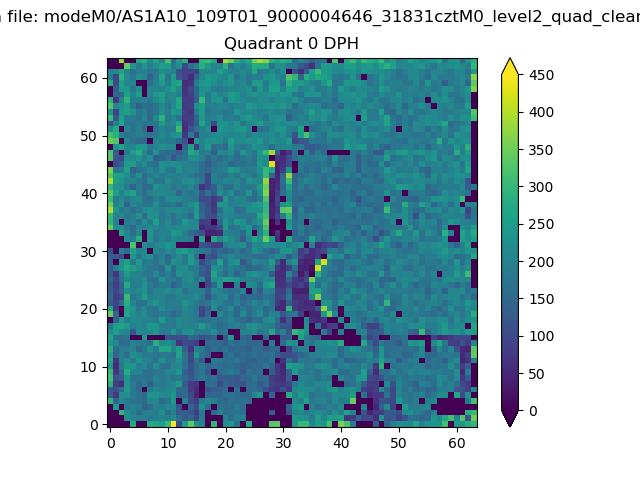 |
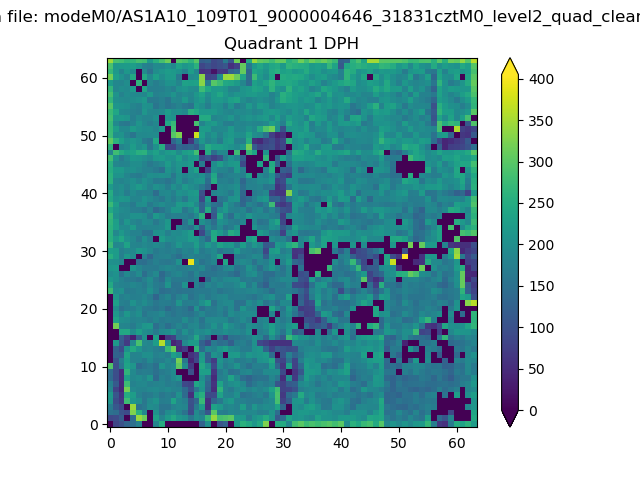 |
Quadrant B |
|---|---|---|---|
| Quadrant D | 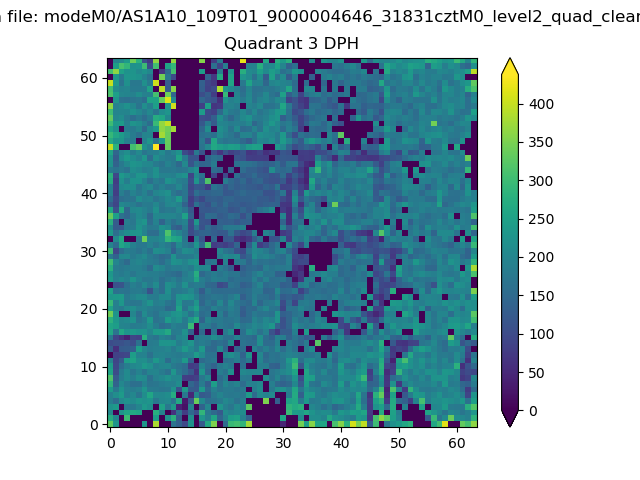 |
 |
Quadrant C |
| Plot type | Count rate plots | Images |
|---|---|---|
| Comparison with Poisson distribution Blue bars denote a histogram of data divided into 1 sec bins. Red curve is a Poisson curve with rate = median count rate of data. |
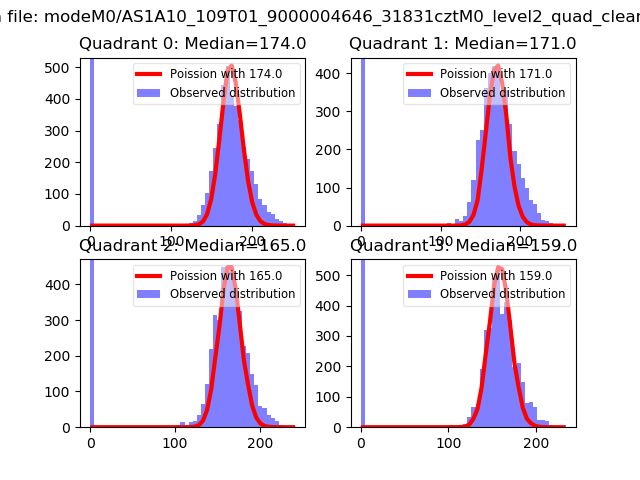 |
 |
| Quadrant-wise count rates Data is divided into 100 sec bins |
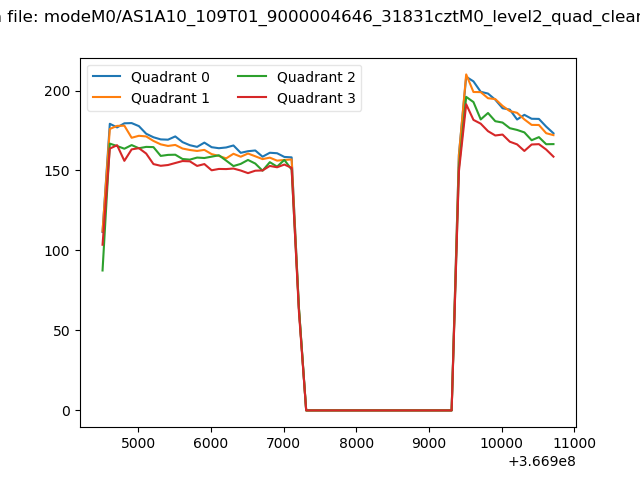 |
|
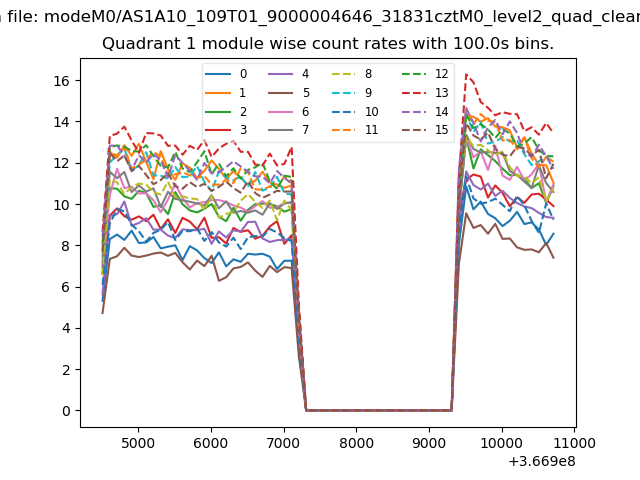
| Module-wise count rates for Quadrant A Data is divided into 100 sec bins |
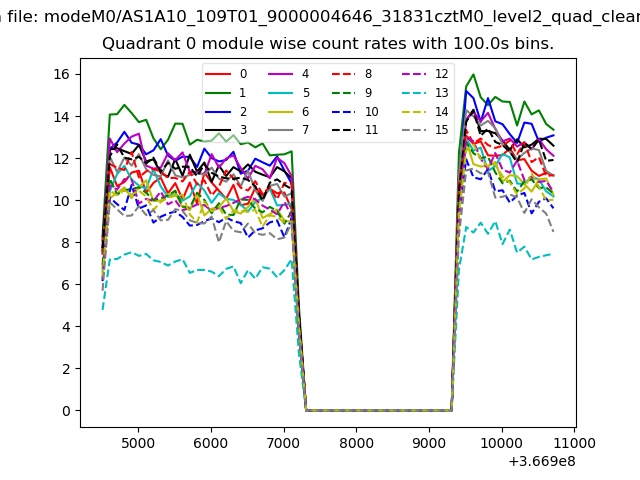 |
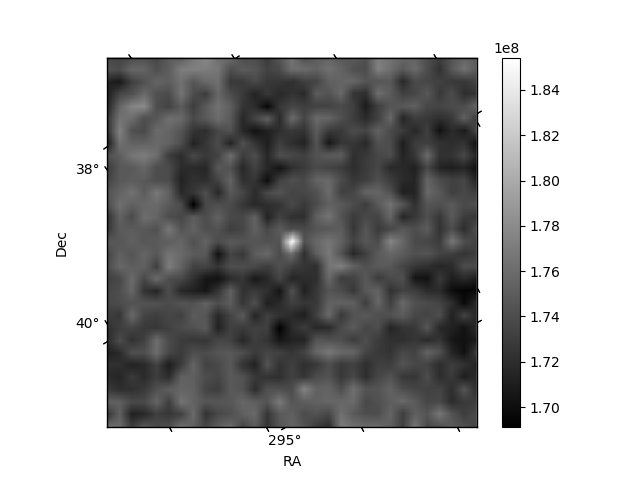 |
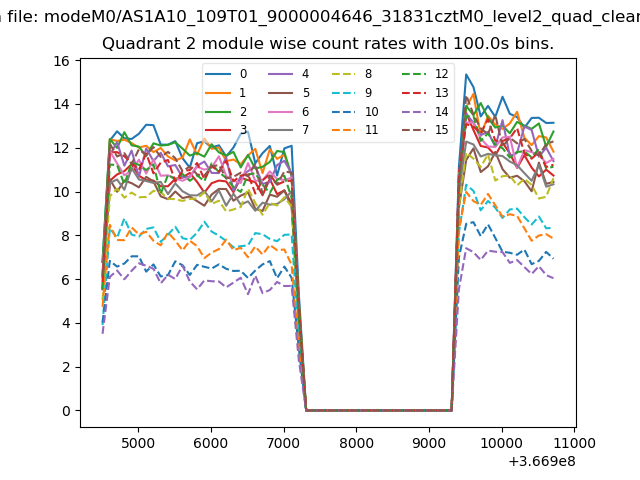
| Module-wise count rates for Quadrant B Data is divided into 100 sec bins |
 |
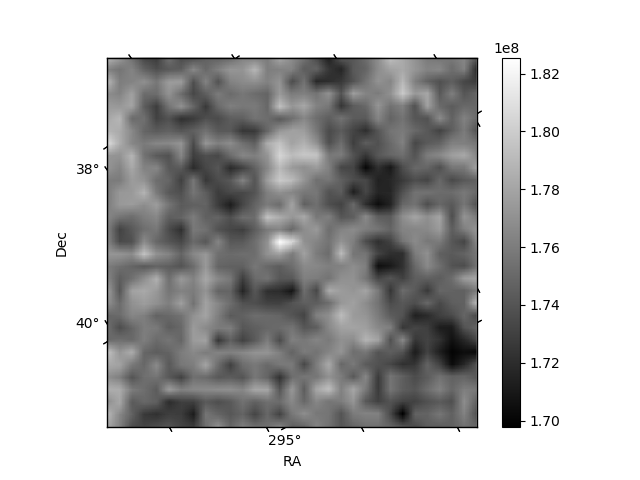 |
| Module-wise count rates for Quadrant C Data is divided into 100 sec bins |
 |
 |
| Module-wise count rates for Quadrant D Data is divided into 100 sec bins |
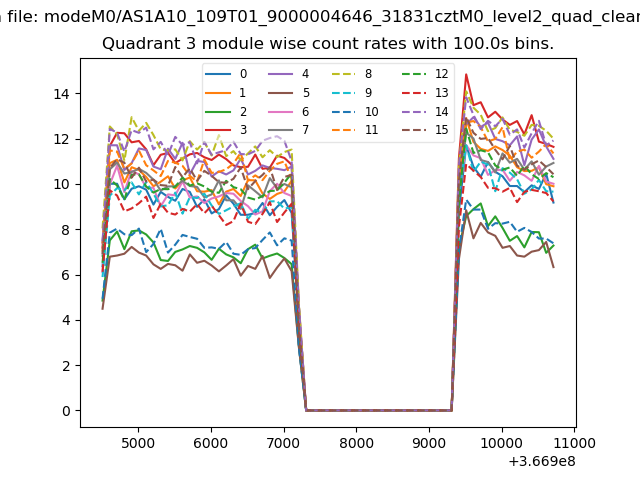 |
 |
| Parameter | Plot |
|---|---|
| CZT HV Monitor | 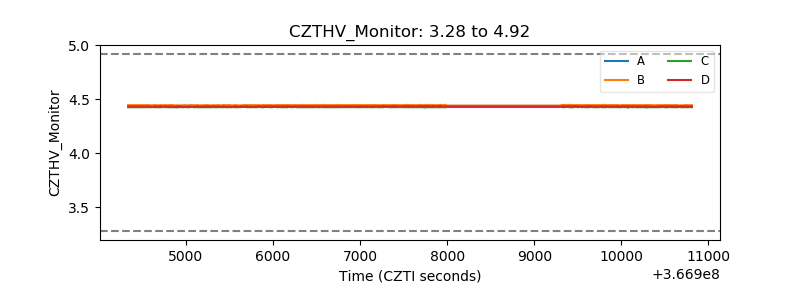 |
| D_VDD | 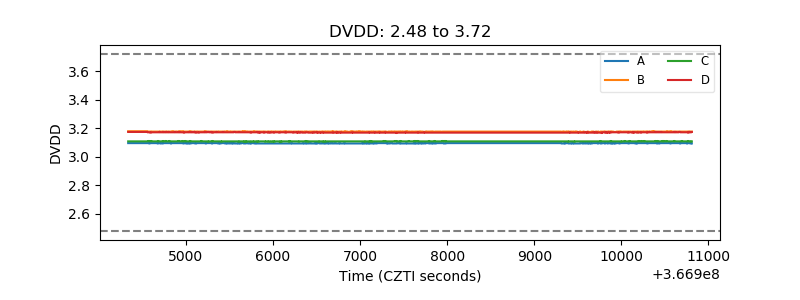 |
| Temperature 1 | 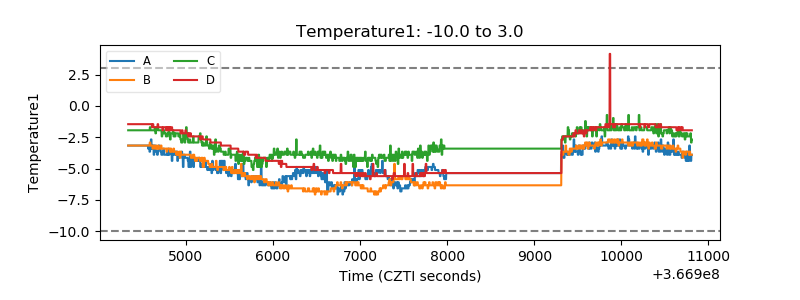 |
| Veto HV Monitor | 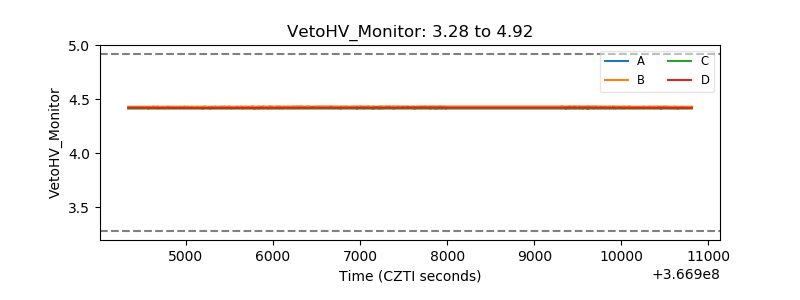 |
| Veto LLD | 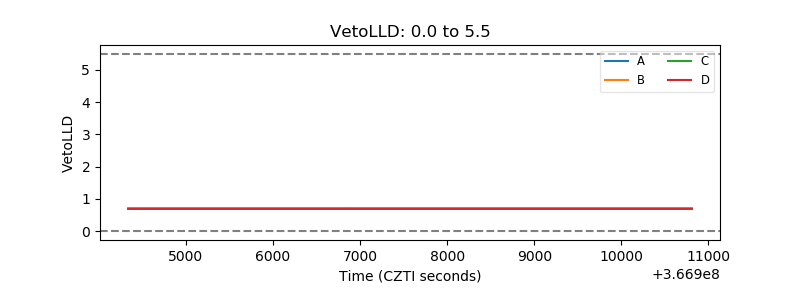 |
| Alpha Counter | 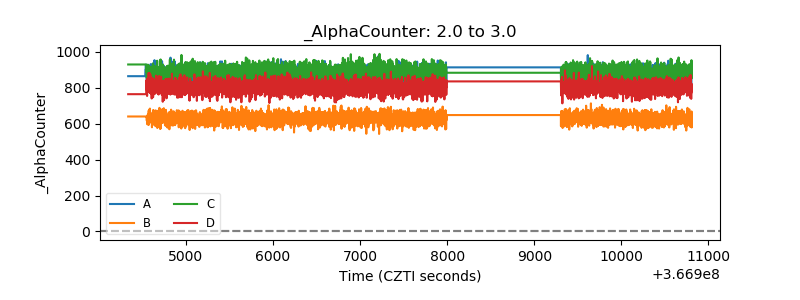 |
| _CPM_Rate | 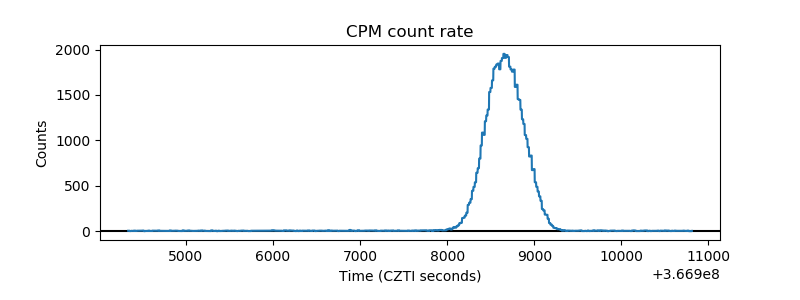 |
| CZT Counter | 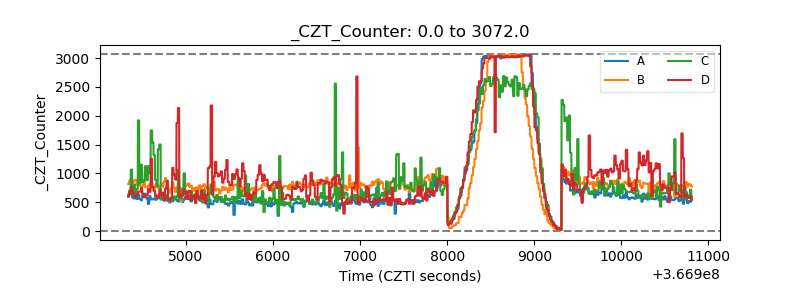 |
| +2.5 Volts monitor | 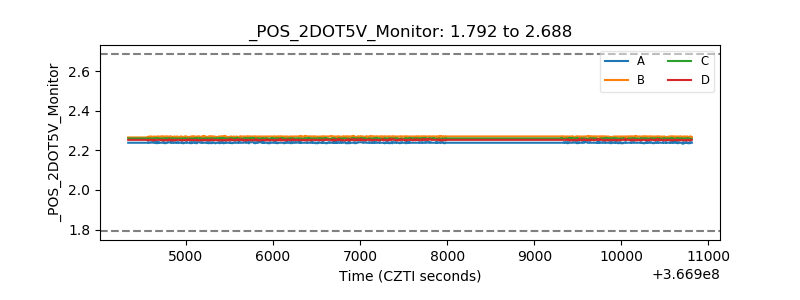 |
| +5 Volts monitor |  |
| _ROLL_ROT | 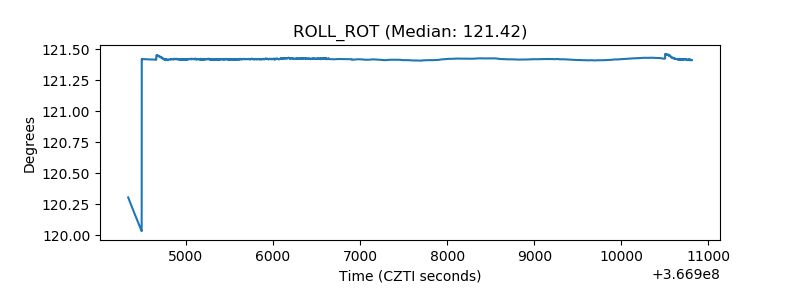 |
| _Roll_DEC | 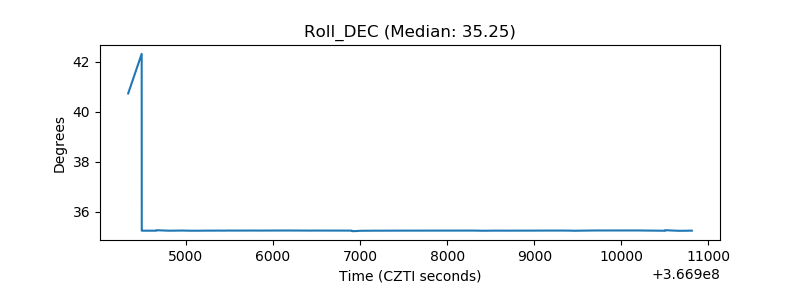 |
| _Roll_RA | 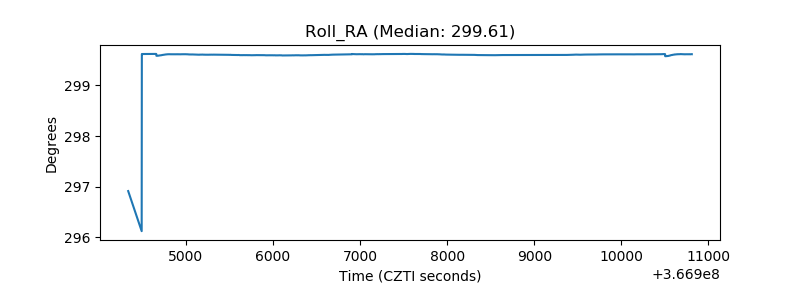 |
| Veto Counter | 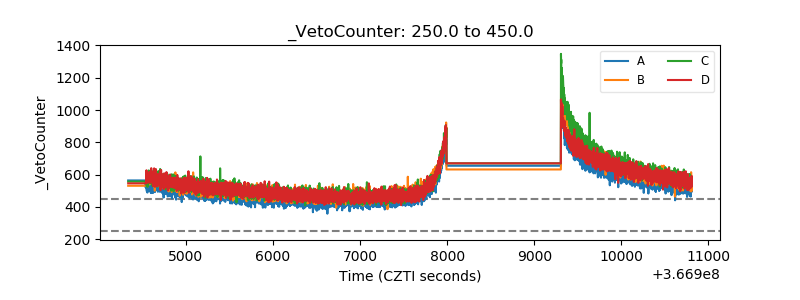 |