| Param | Original file | Final file |
|---|---|---|
| Filename | modeM0/AS1A10_109T01_9000004646_31832cztM0_level2.evt | modeM0/AS1A10_109T01_9000004646_31832cztM0_level2_quad_clean.evt |
| Size (bytes) | 924,004,800 | 193,285,440 |
| Size | 881.2 MB | 184.3 MB |
| Events in quadrant A | 5,386,189 | 1,342,404 |
| Events in quadrant B | 7,906,698 | 1,323,746 |
| Events in quadrant C | 7,044,754 | 1,256,573 |
| Events in quadrant D | 6,974,716 | 1,242,189 |
| Mode SS | |||
|---|---|---|---|
| Quadrant | BADHDUFLAG | Total packets | Discarded packets |
| A | 0 | 202 | 0 |
| B | 0 | 202 | 0 |
| C | 0 | 202 | 0 |
| D | 0 | 202 | 0 |
| Mode M0 | |||
|---|---|---|---|
| Quadrant | BADHDUFLAG | Total packets | Discarded packets |
| A | 0 | 22032 | 2 |
| B | 0 | 30448 | 4 |
| C | 0 | 27773 | 2 |
| D | 0 | 27397 | 2 |
| Mode M9 | |||
|---|---|---|---|
| Quadrant | BADHDUFLAG | Total packets | Discarded packets |
| A | 0 | 26 | 0 |
| B | 0 | 26 | 0 |
| C | 0 | 26 | 0 |
| D | 0 | 26 | 0 |
| Quadrant | Total seconds | Saturated seconds | Saturation percentage |
|---|---|---|---|
| A | 9958 | 228 | 2.289616% |
| B | 9957 | 371 | 3.726022% |
| C | 9958 | 701 | 7.039566% |
| D | 9958 | 248 | 2.490460% |
Noise dominated data is calculated using 1-second bins in cleaned event files. If a bin has >2000 counts, and if more than 50% of those come from <1% of pixels, then it is considered to be noise-dominated and hence unusable.
| Quadrant | # 1 sec bins | Bins with >0 counts | Bins with >2000 counts | High rate bins dominated by noise | Noise dominated (total time) | Noise dominated (detector-on time) | Marked lightcurve |
|---|---|---|---|---|---|---|---|
| A | 12533 | 9960 | 0 | 0 | 0.00% | 0.00% | 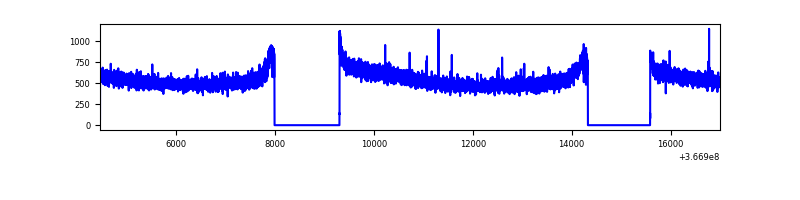 |
| B | 12532 | 9959 | 3 | 3 | 0.02% | 0.03% | 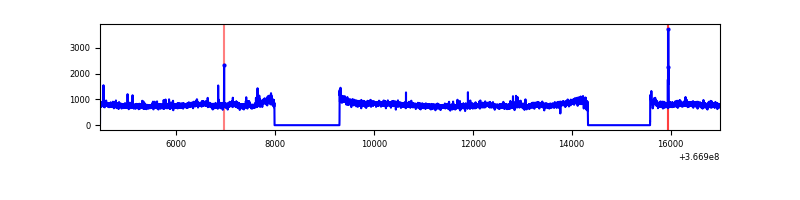 |
| C | 12533 | 9960 | 161 | 161 | 1.28% | 1.62% | 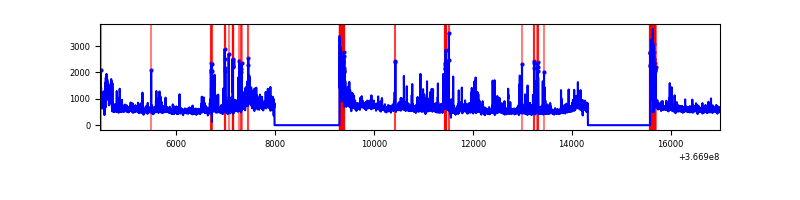 |
| D | 12533 | 9960 | 49 | 49 | 0.39% | 0.49% | 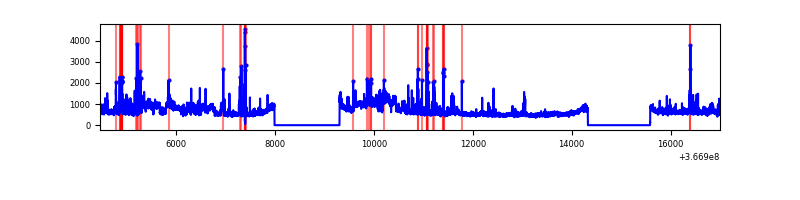 |
Top three noisy pixels from each quadrant. If the there are fewer than three noisy pixels in the level2.evt file, extra rows are filled as -1
| Pixel properties | Quadrant properties | ||||||
|---|---|---|---|---|---|---|---|
| Quadrant | DetID | PixID | Counts | Sigma | Mean | Median | Sigma |
| A | 13 | 254 | 17505 | 58.61 | 1393 | 1371 | 275.2 |
| A | 3 | 137 | 12847 | 41.69 | 1393 | 1371 | 275.2 |
| A | 0 | 226 | 11928 | 38.35 | 1393 | 1371 | 275.2 |
| B | 6 | 159 | 2548687 | 10063.72 | 1353 | 1322 | 253.1 |
| B | 12 | 111 | 29444 | 111.1 | 1353 | 1322 | 253.1 |
| B | 11 | 111 | 27537 | 103.57 | 1353 | 1322 | 253.1 |
| C | 0 | 10 | 844308 | 2799.35 | 1307 | 1322 | 301.1 |
| C | 3 | 233 | 792142 | 2626.12 | 1307 | 1322 | 301.1 |
| C | 14 | 238 | 231559 | 764.56 | 1307 | 1322 | 301.1 |
| D | 8 | 195 | 1326964 | 4192.47 | 1353 | 1324 | 316.2 |
| D | 12 | 218 | 140676 | 440.71 | 1353 | 1324 | 316.2 |
| D | 12 | 233 | 107359 | 335.35 | 1353 | 1324 | 316.2 |
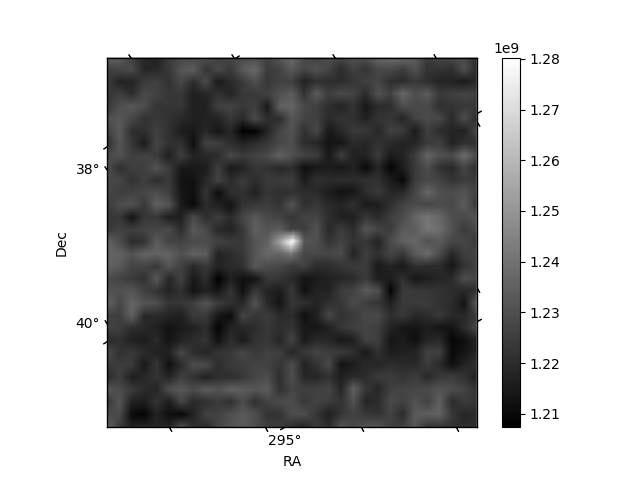
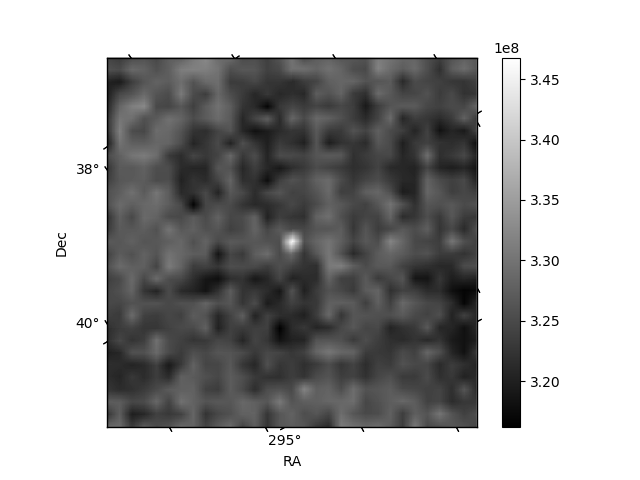
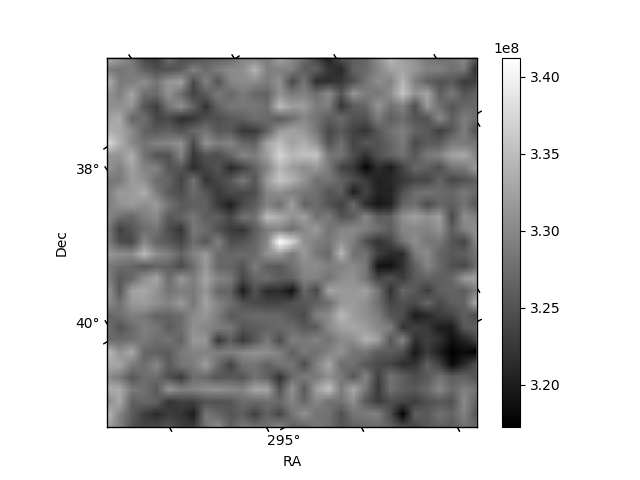
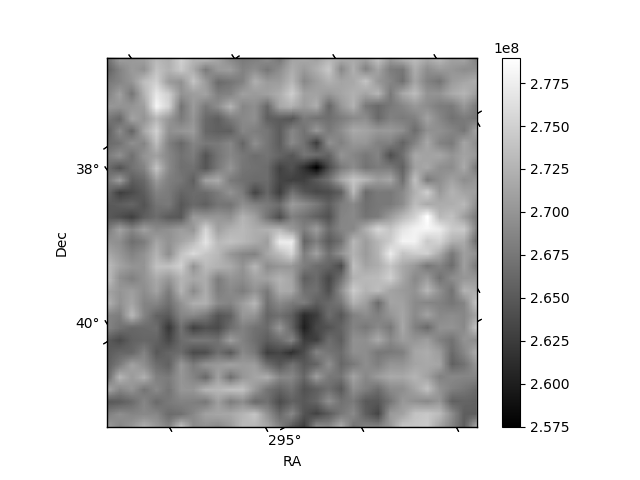
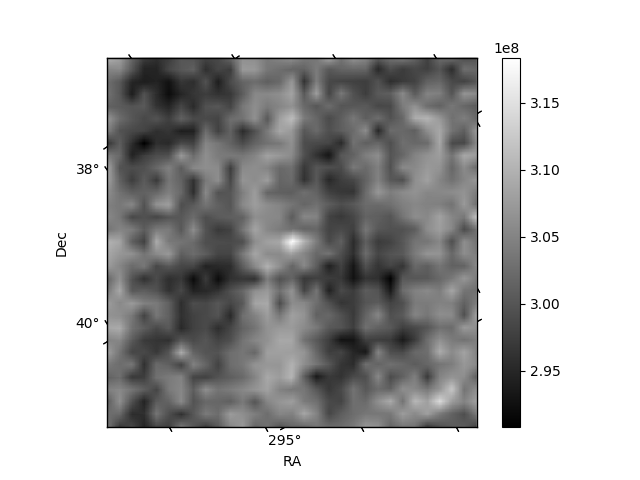
Histogram calculated using DETX and DETY for each event in the final _common_clean file
| Quadrant A | 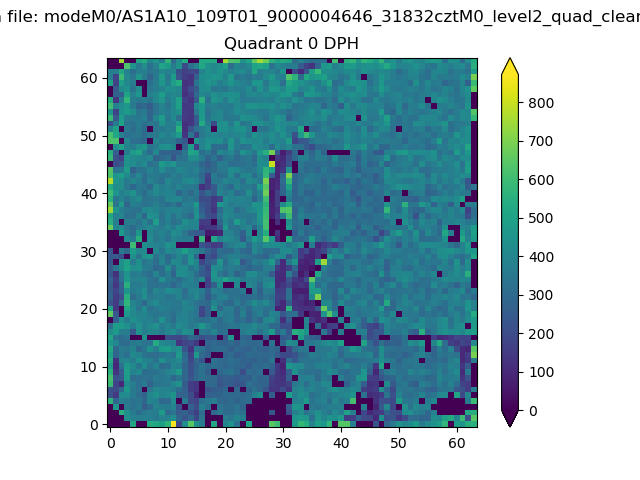 |
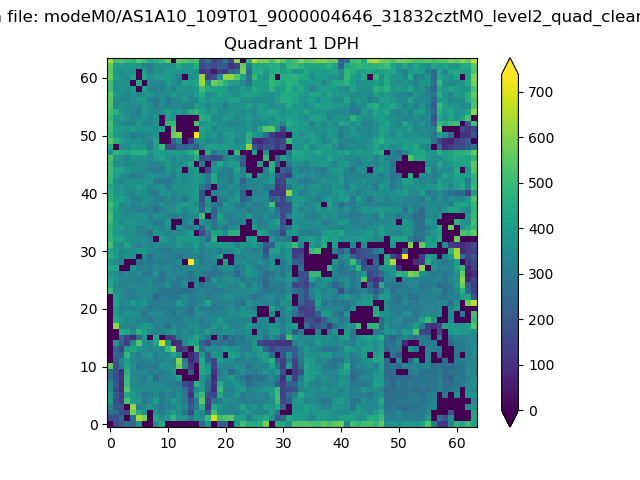 |
Quadrant B |
|---|---|---|---|
| Quadrant D | 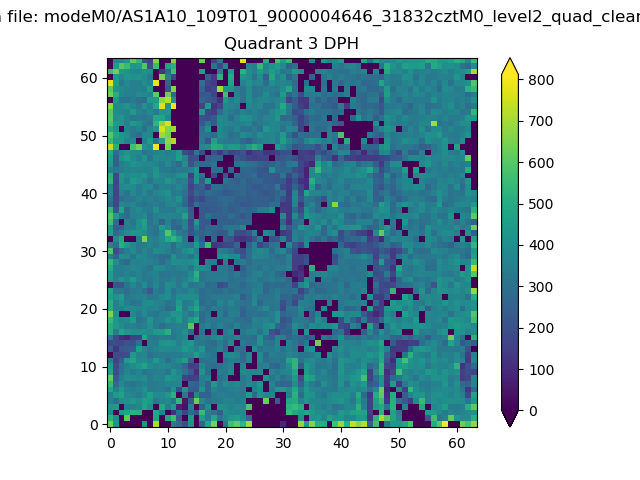 |
 |
Quadrant C |
| Plot type | Count rate plots | Images |
|---|---|---|
| Comparison with Poisson distribution Blue bars denote a histogram of data divided into 1 sec bins. Red curve is a Poisson curve with rate = median count rate of data. |
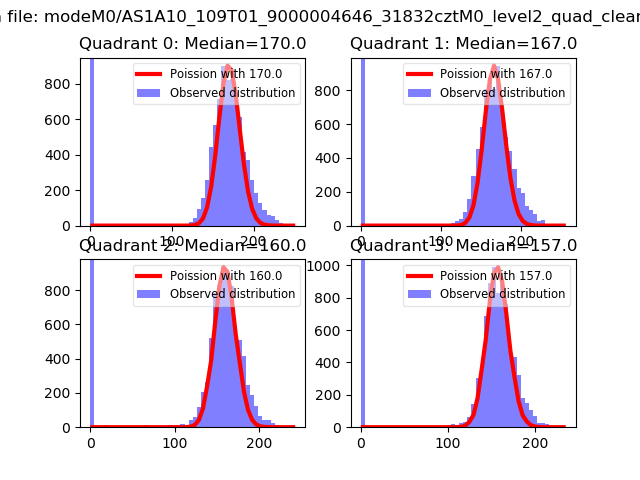 |
 |
| Quadrant-wise count rates Data is divided into 100 sec bins |
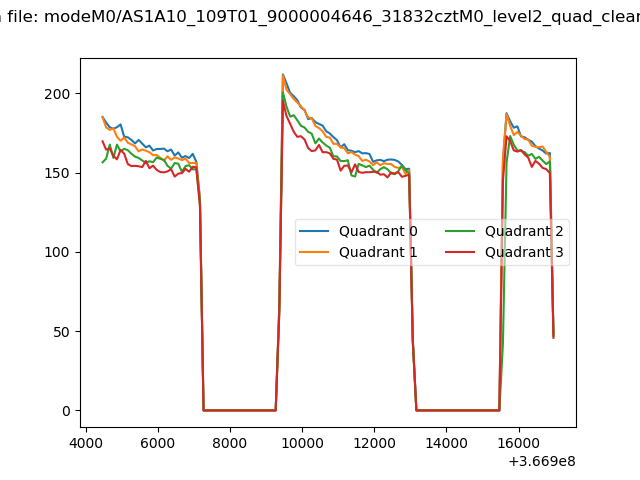 |
|
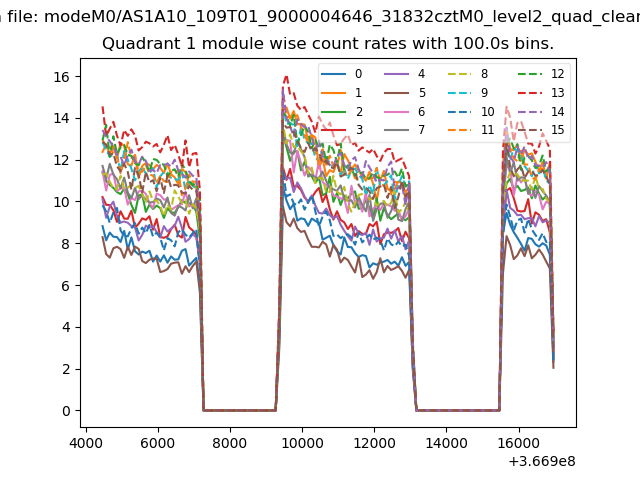
| Module-wise count rates for Quadrant A Data is divided into 100 sec bins |
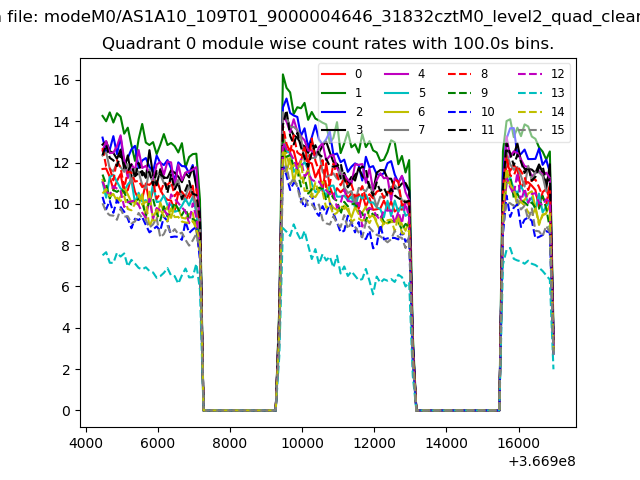 |
 |
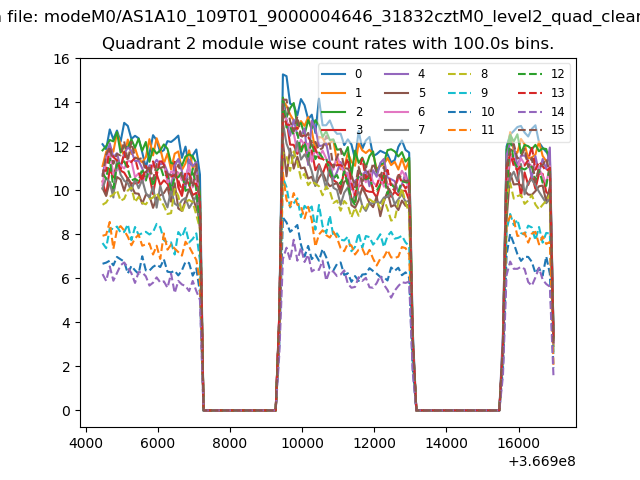
| Module-wise count rates for Quadrant B Data is divided into 100 sec bins |
 |
 |
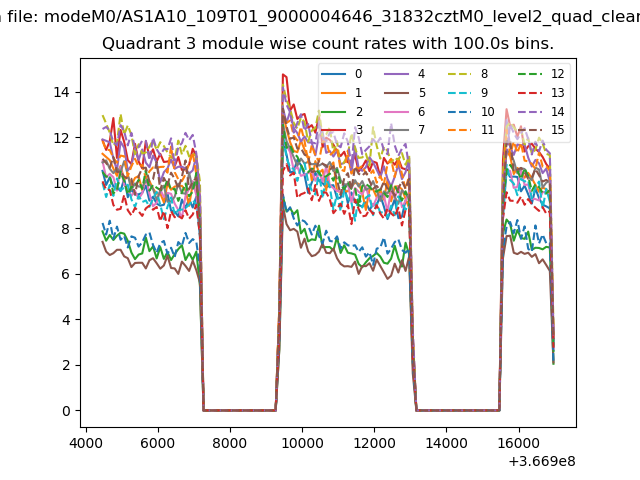
| Module-wise count rates for Quadrant C Data is divided into 100 sec bins |
 |
 |
| Module-wise count rates for Quadrant D Data is divided into 100 sec bins |
 |
 |
| Parameter | Plot |
|---|---|
| CZT HV Monitor | 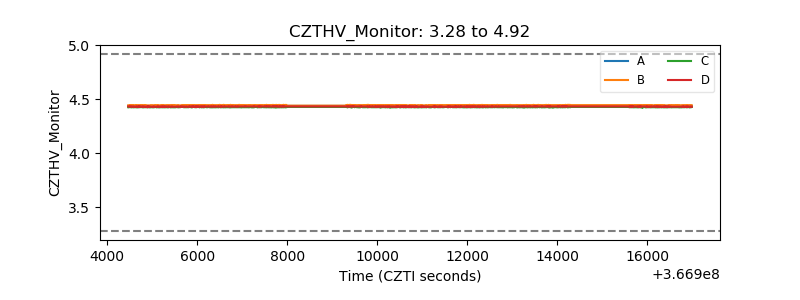 |
| D_VDD | 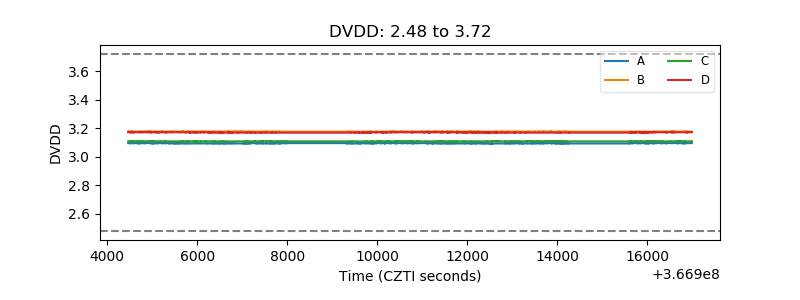 |
| Temperature 1 | 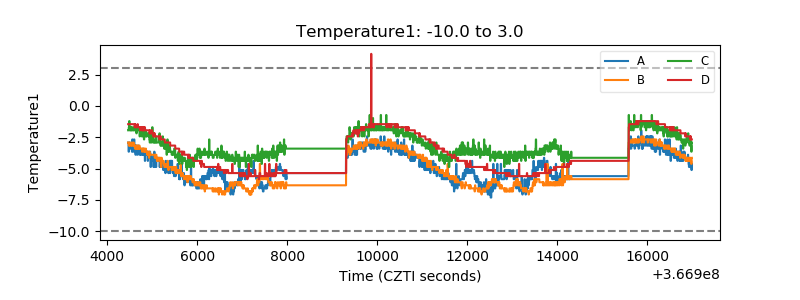 |
| Veto HV Monitor | 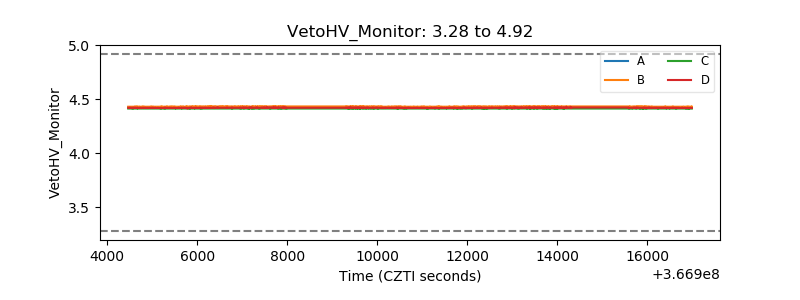 |
| Veto LLD | 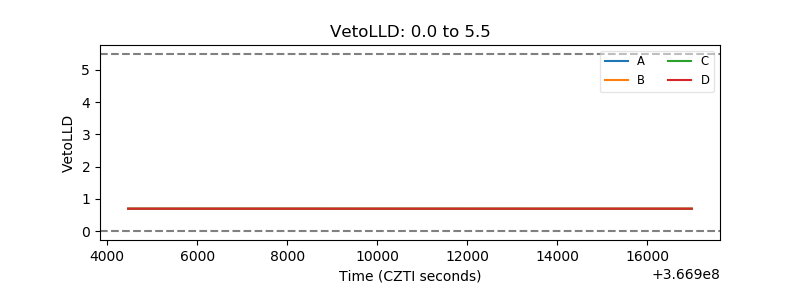 |
| Alpha Counter | 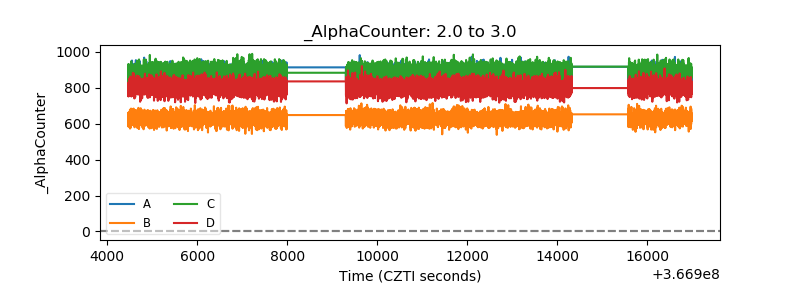 |
| _CPM_Rate | 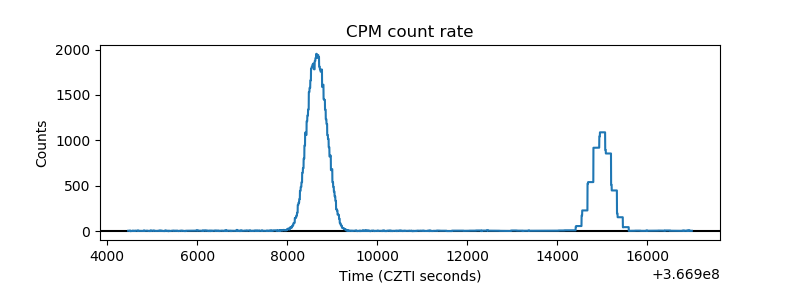 |
| CZT Counter | 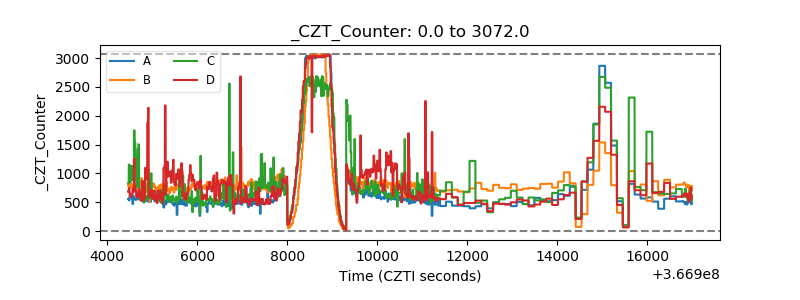 |
| +2.5 Volts monitor |  |
| +5 Volts monitor |  |
| _ROLL_ROT | 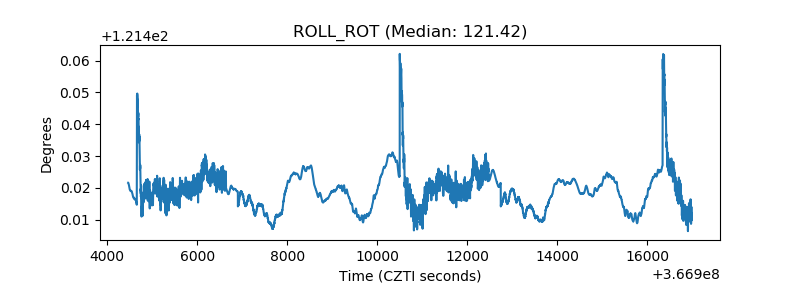 |
| _Roll_DEC | 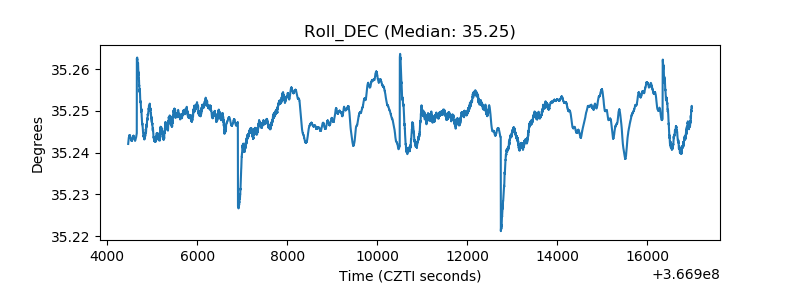 |
| _Roll_RA | 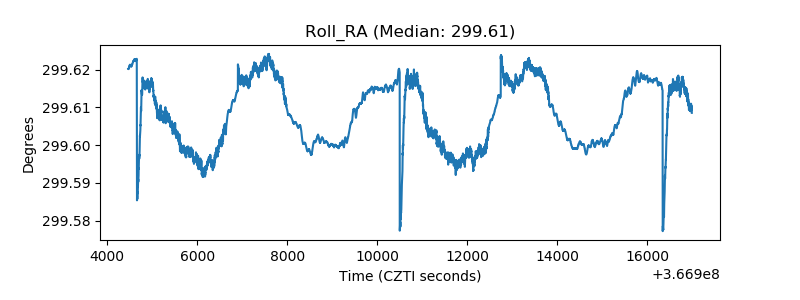 |
| Veto Counter | 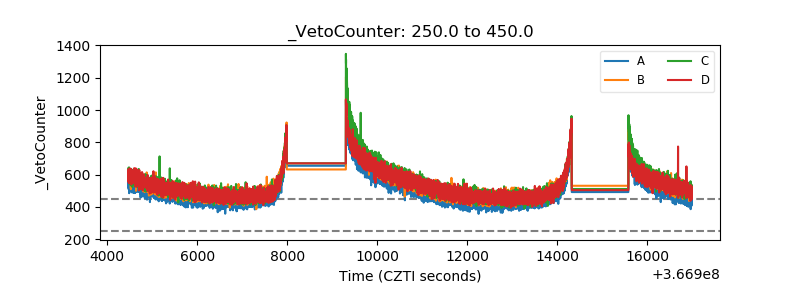 |