| Param | Original file | Final file |
|---|---|---|
| Filename | modeM0/AS1A10_109T01_9000004646_31833cztM0_level2.evt | modeM0/AS1A10_109T01_9000004646_31833cztM0_level2_quad_clean.evt |
| Size (bytes) | 544,032,000 | 103,438,080 |
| Size | 518.8 MB | 98.6 MB |
| Events in quadrant A | 3,166,514 | 697,681 |
| Events in quadrant B | 4,843,569 | 690,811 |
| Events in quadrant C | 4,338,254 | 659,410 |
| Events in quadrant D | 3,706,393 | 650,338 |
| Mode SS | |||
|---|---|---|---|
| Quadrant | BADHDUFLAG | Total packets | Discarded packets |
| A | 0 | 126 | 0 |
| B | 0 | 126 | 0 |
| C | 0 | 126 | 0 |
| D | 0 | 126 | 0 |
| Mode M0 | |||
|---|---|---|---|
| Quadrant | BADHDUFLAG | Total packets | Discarded packets |
| A | 0 | 13135 | 1 |
| B | 0 | 18877 | 3 |
| C | 0 | 17120 | 1 |
| D | 0 | 15108 | 1 |
| Mode M9 | |||
|---|---|---|---|
| Quadrant | BADHDUFLAG | Total packets | Discarded packets |
| A | 0 | 11 | 0 |
| B | 0 | 11 | 0 |
| C | 0 | 11 | 0 |
| D | 0 | 11 | 0 |
| Quadrant | Total seconds | Saturated seconds | Saturation percentage |
|---|---|---|---|
| A | 6226 | 39 | 0.626405% |
| B | 6226 | 86 | 1.381304% |
| C | 6226 | 230 | 3.694186% |
| D | 6226 | 103 | 1.654353% |
Noise dominated data is calculated using 1-second bins in cleaned event files. If a bin has >2000 counts, and if more than 50% of those come from <1% of pixels, then it is considered to be noise-dominated and hence unusable.
| Quadrant | # 1 sec bins | Bins with >0 counts | Bins with >2000 counts | High rate bins dominated by noise | Noise dominated (total time) | Noise dominated (detector-on time) | Marked lightcurve |
|---|---|---|---|---|---|---|---|
| A | 7291 | 6227 | 0 | 0 | 0.00% | 0.00% | 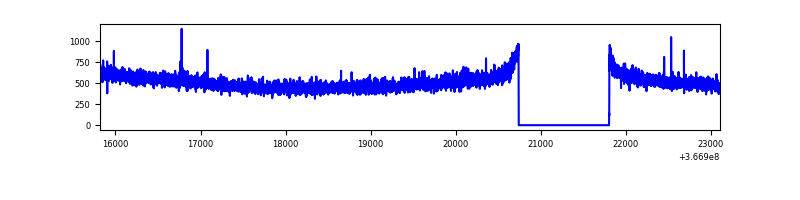 |
| B | 7291 | 6227 | 2 | 2 | 0.03% | 0.03% | 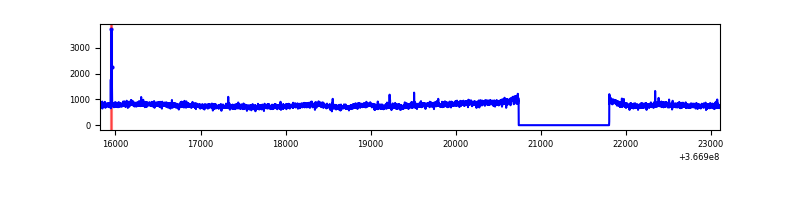 |
| C | 7291 | 6227 | 32 | 32 | 0.44% | 0.51% | 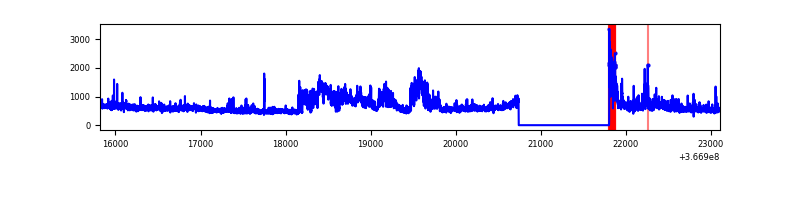 |
| D | 7291 | 6227 | 55 | 55 | 0.75% | 0.88% | 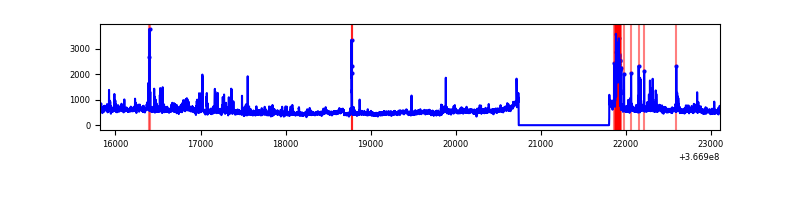 |
Top three noisy pixels from each quadrant. If the there are fewer than three noisy pixels in the level2.evt file, extra rows are filled as -1
| Pixel properties | Quadrant properties | ||||||
|---|---|---|---|---|---|---|---|
| Quadrant | DetID | PixID | Counts | Sigma | Mean | Median | Sigma |
| A | 13 | 254 | 11757 | 66.99 | 819 | 807 | 163.5 |
| A | 3 | 137 | 7892 | 43.34 | 819 | 807 | 163.5 |
| A | 0 | 226 | 6917 | 37.38 | 819 | 807 | 163.5 |
| B | 6 | 159 | 1656421 | 10870.3 | 802 | 783 | 152.3 |
| B | 12 | 111 | 17823 | 111.88 | 802 | 783 | 152.3 |
| B | 11 | 111 | 16909 | 105.88 | 802 | 783 | 152.3 |
| C | 10 | 22 | 697539 | 3821.06 | 784 | 793 | 182.3 |
| C | 0 | 10 | 203346 | 1110.83 | 784 | 793 | 182.3 |
| C | 3 | 233 | 192097 | 1049.14 | 784 | 793 | 182.3 |
| D | 8 | 195 | 372447 | 1997.58 | 793 | 774 | 186.1 |
| D | 2 | 250 | 162505 | 869.23 | 793 | 774 | 186.1 |
| D | 12 | 218 | 61314 | 325.38 | 793 | 774 | 186.1 |
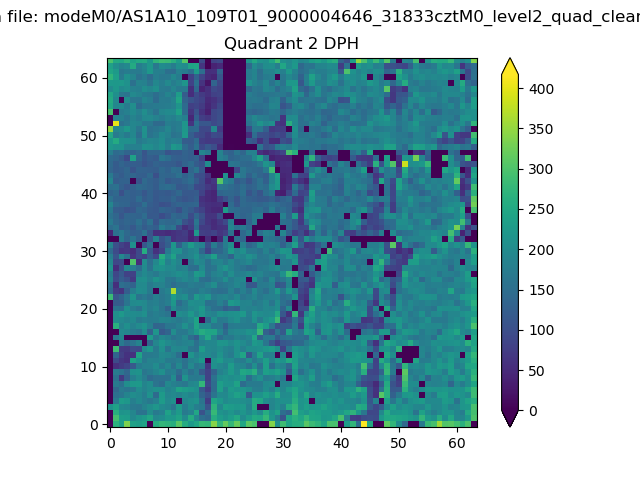
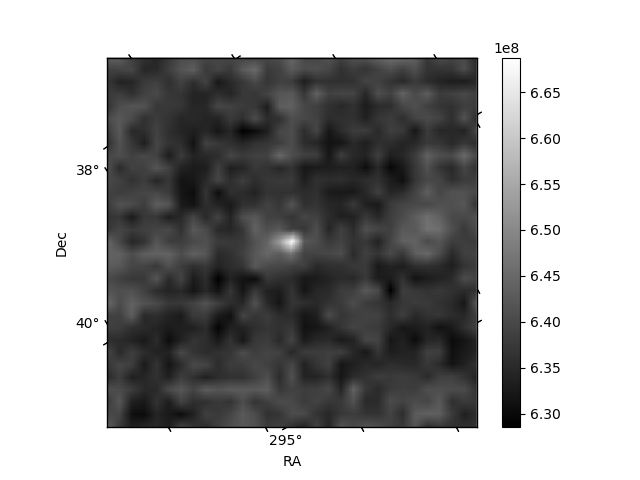
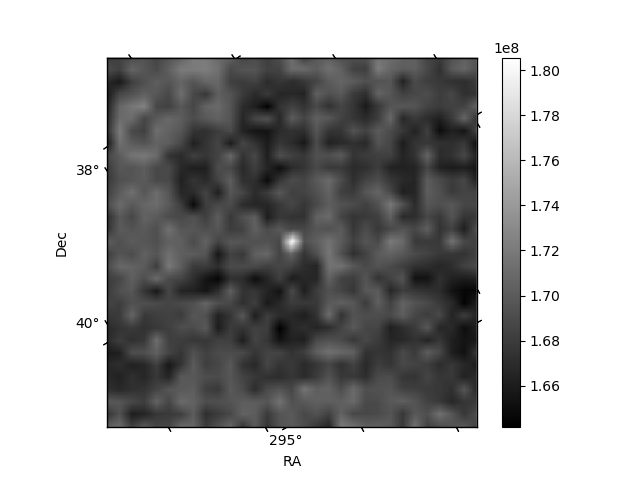
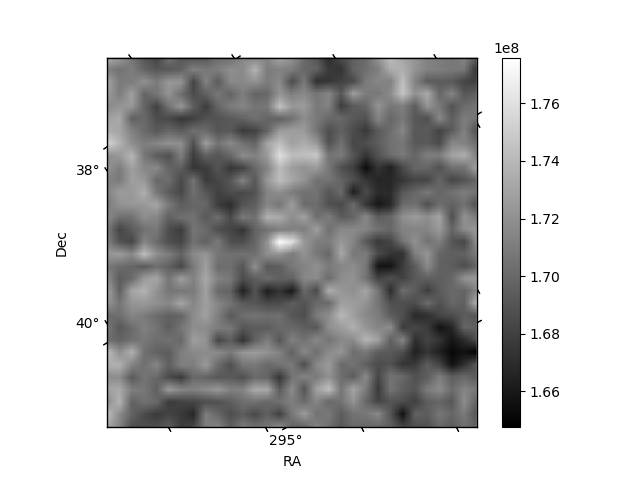
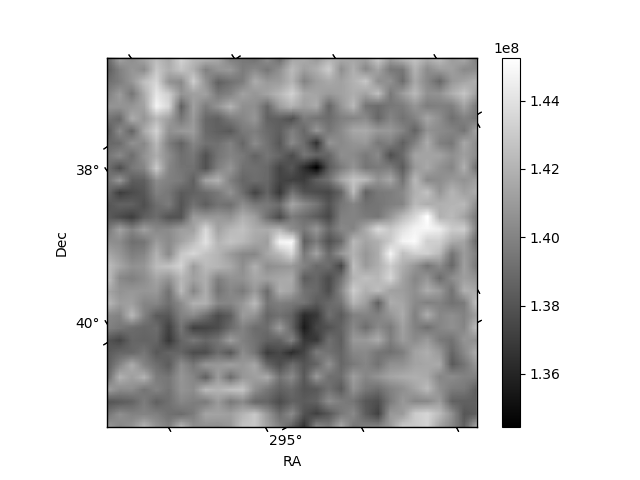
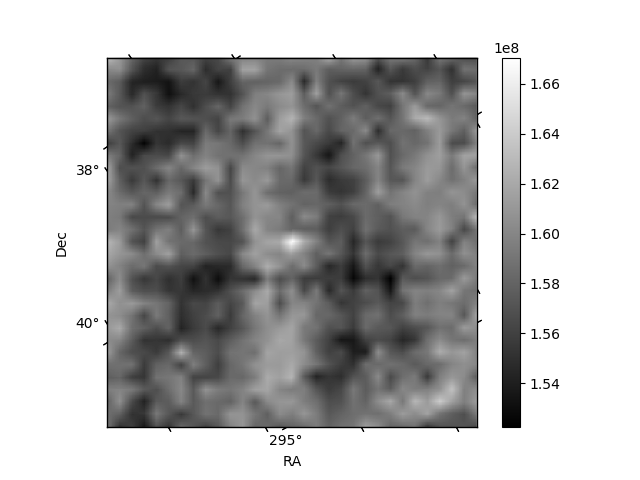
Histogram calculated using DETX and DETY for each event in the final _common_clean file
| Quadrant A | 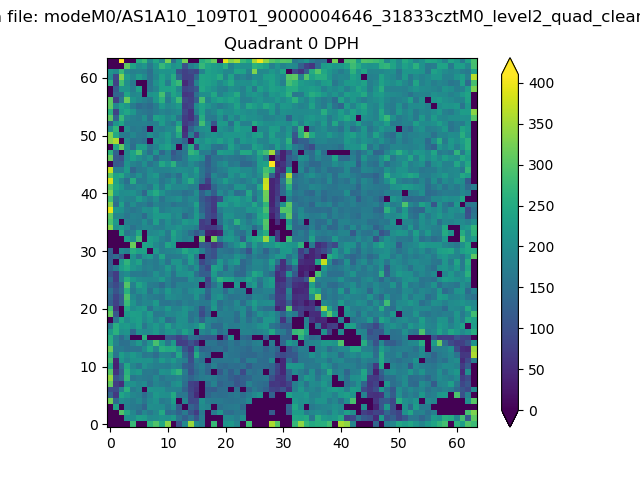 |
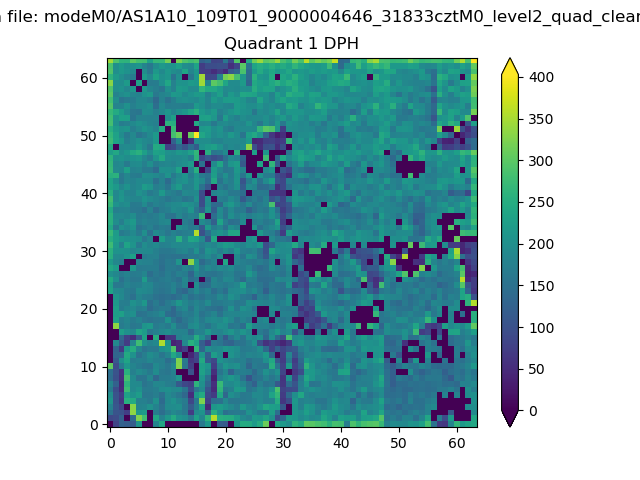 |
Quadrant B |
|---|---|---|---|
| Quadrant D | 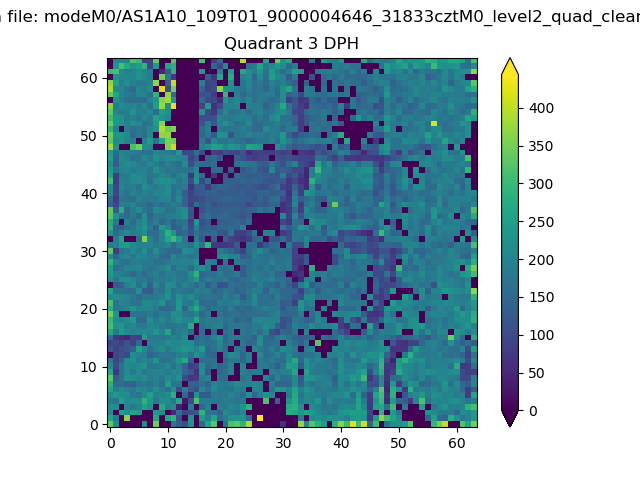 |
 |
Quadrant C |
| Plot type | Count rate plots | Images |
|---|---|---|
| Comparison with Poisson distribution Blue bars denote a histogram of data divided into 1 sec bins. Red curve is a Poisson curve with rate = median count rate of data. |
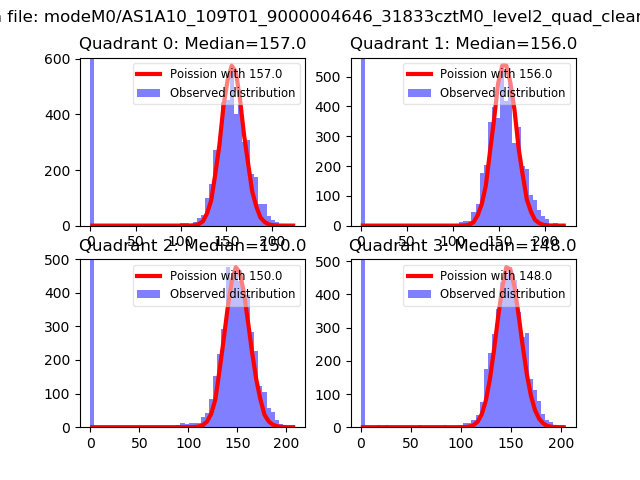 |
 |
| Quadrant-wise count rates Data is divided into 100 sec bins |
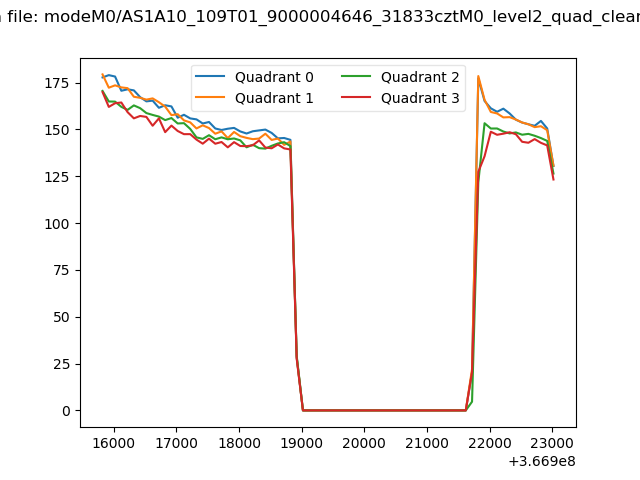 |
|
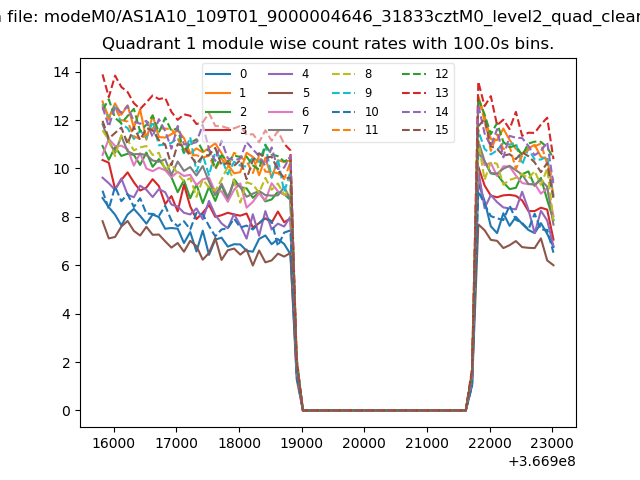
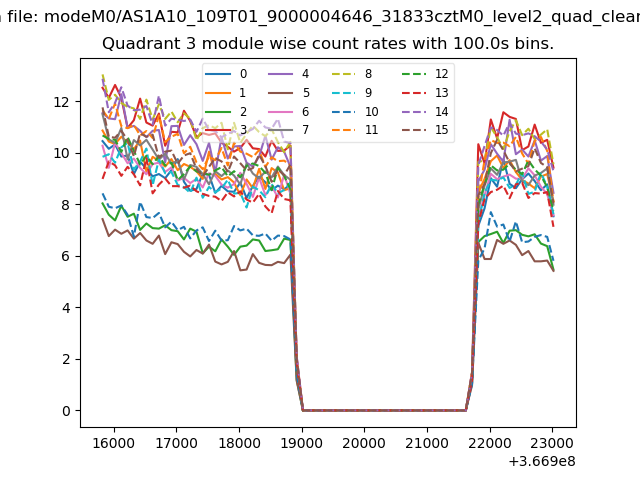
| Module-wise count rates for Quadrant A Data is divided into 100 sec bins |
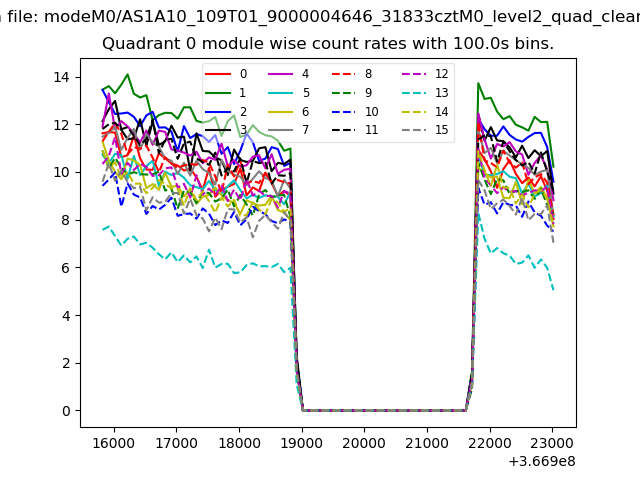 |
 |
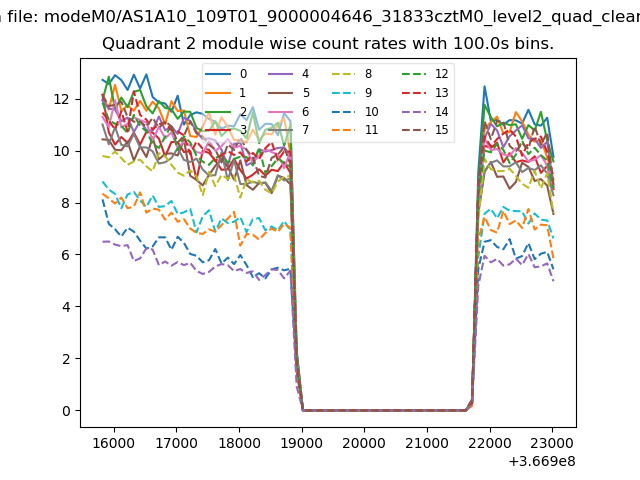
| Module-wise count rates for Quadrant B Data is divided into 100 sec bins |
 |
 |
| Module-wise count rates for Quadrant C Data is divided into 100 sec bins |
 |
 |
| Module-wise count rates for Quadrant D Data is divided into 100 sec bins |
 |
 |
| Parameter | Plot |
|---|---|
| CZT HV Monitor | 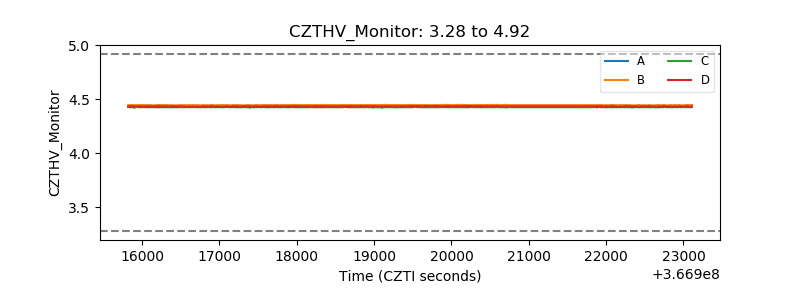 |
| D_VDD | 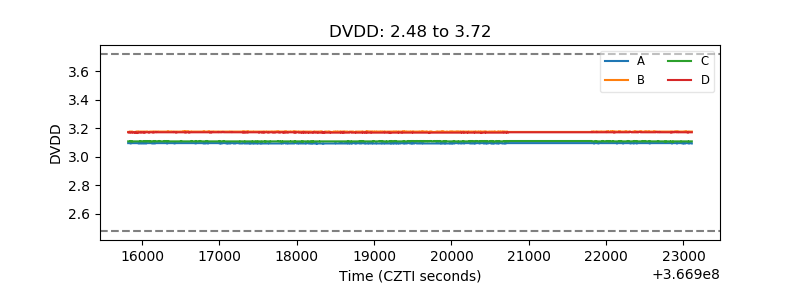 |
| Temperature 1 |  |
| Veto HV Monitor |  |
| Veto LLD | 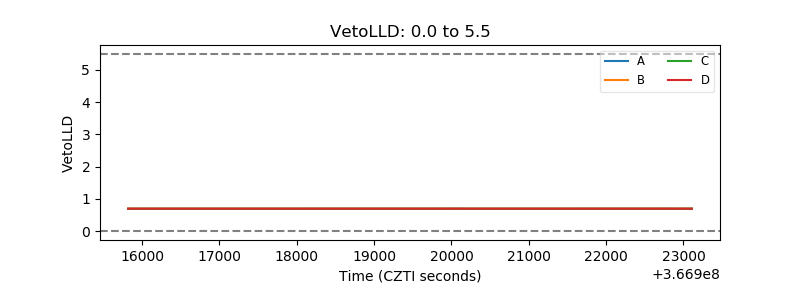 |
| Alpha Counter | 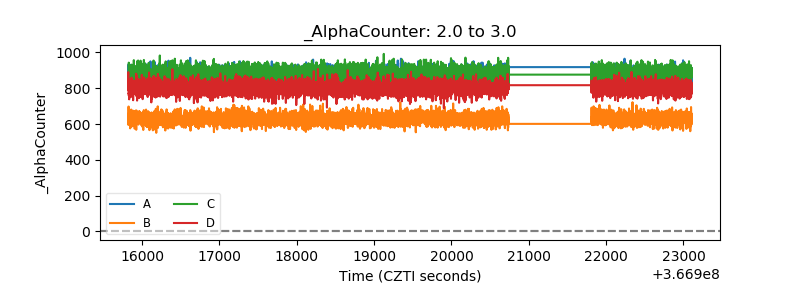 |
| _CPM_Rate | 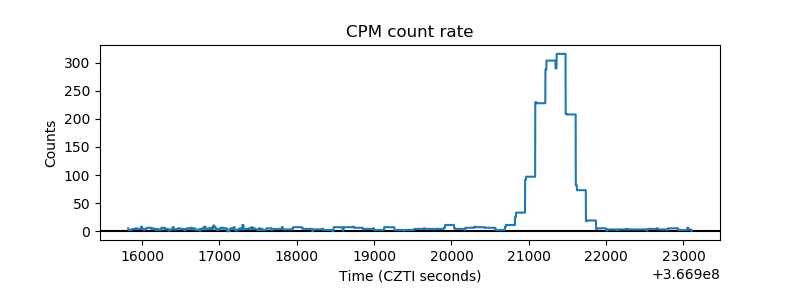 |
| CZT Counter | 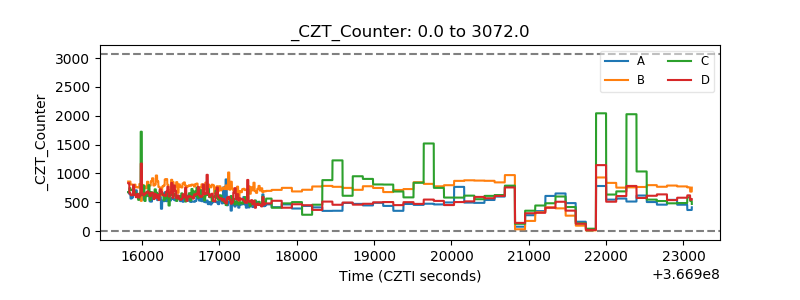 |
| +2.5 Volts monitor |  |
| +5 Volts monitor |  |
| _ROLL_ROT | 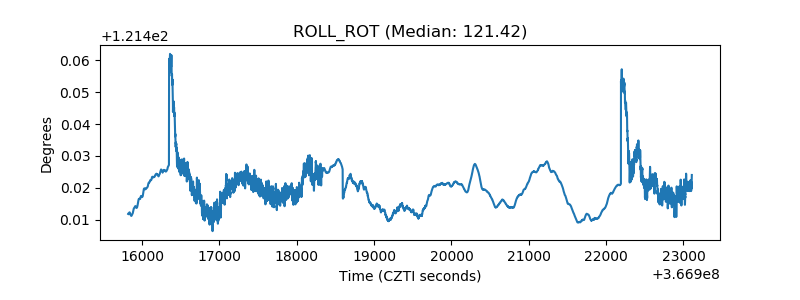 |
| _Roll_DEC | 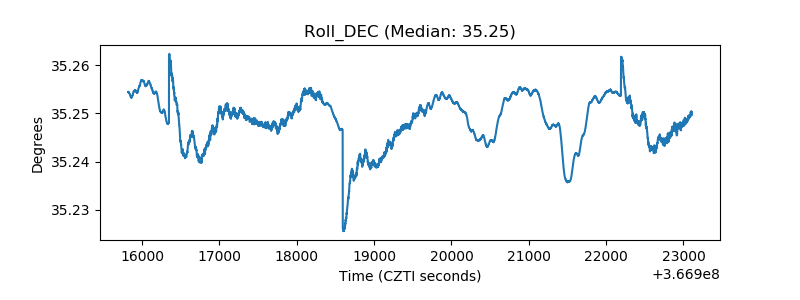 |
| _Roll_RA | 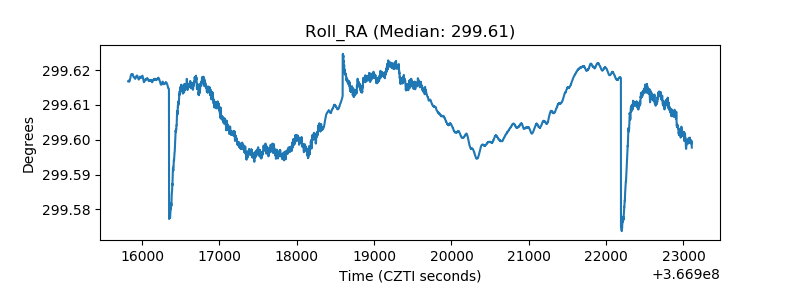 |
| Veto Counter | 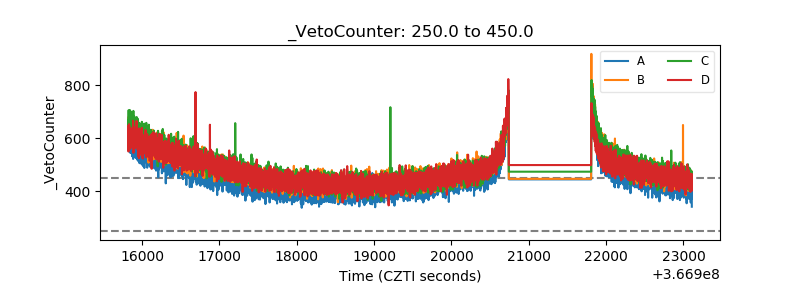 |