| Param | Original file | Final file |
|---|---|---|
| Filename | modeM0/AS1A10_109T01_9000004646_31834cztM0_level2.evt | modeM0/AS1A10_109T01_9000004646_31834cztM0_level2_quad_clean.evt |
| Size (bytes) | 592,254,720 | 108,132,480 |
| Size | 564.8 MB | 103.1 MB |
| Events in quadrant A | 3,485,090 | 721,878 |
| Events in quadrant B | 5,497,441 | 713,863 |
| Events in quadrant C | 4,313,881 | 675,951 |
| Events in quadrant D | 4,164,279 | 673,726 |
| Mode SS | |||
|---|---|---|---|
| Quadrant | BADHDUFLAG | Total packets | Discarded packets |
| A | 0 | 144 | 0 |
| B | 0 | 144 | 0 |
| C | 0 | 144 | 0 |
| D | 0 | 144 | 0 |
| Mode M0 | |||
|---|---|---|---|
| Quadrant | BADHDUFLAG | Total packets | Discarded packets |
| A | 0 | 14754 | 4 |
| B | 0 | 21569 | 3 |
| C | 0 | 17223 | 3 |
| D | 0 | 16935 | 3 |
| Mode M9 | |||
|---|---|---|---|
| Quadrant | BADHDUFLAG | Total packets | Discarded packets |
| A | 0 | 10 | 0 |
| B | 0 | 11 | 0 |
| C | 0 | 11 | 0 |
| D | 0 | 11 | 0 |
| Quadrant | Total seconds | Saturated seconds | Saturation percentage |
|---|---|---|---|
| A | 7022 | 49 | 0.697807% |
| B | 7022 | 132 | 1.879806% |
| C | 7022 | 320 | 4.557106% |
| D | 7022 | 138 | 1.965252% |
Noise dominated data is calculated using 1-second bins in cleaned event files. If a bin has >2000 counts, and if more than 50% of those come from <1% of pixels, then it is considered to be noise-dominated and hence unusable.
| Quadrant | # 1 sec bins | Bins with >0 counts | Bins with >2000 counts | High rate bins dominated by noise | Noise dominated (total time) | Noise dominated (detector-on time) | Marked lightcurve |
|---|---|---|---|---|---|---|---|
| A | 7687 | 7024 | 0 | 0 | 0.00% | 0.00% | 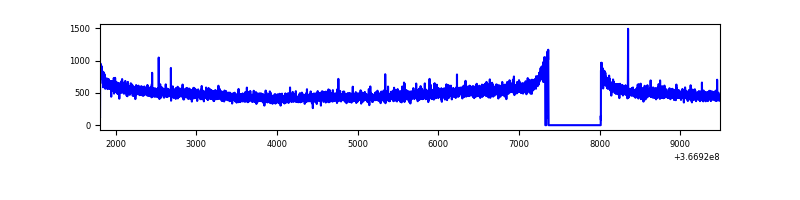 |
| B | 7687 | 7024 | 13 | 13 | 0.17% | 0.19% | 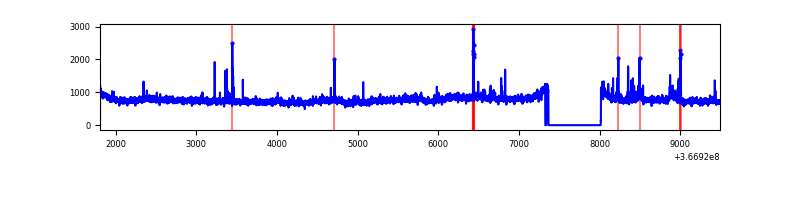 |
| C | 7687 | 7024 | 95 | 95 | 1.24% | 1.35% | 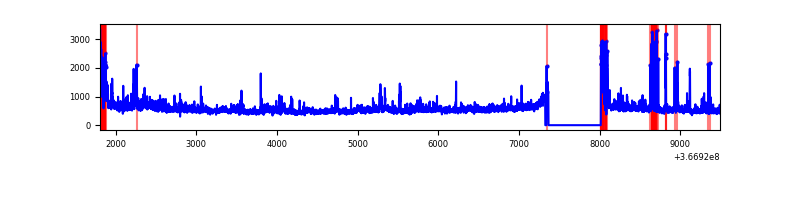 |
| D | 7687 | 7024 | 90 | 90 | 1.17% | 1.28% | 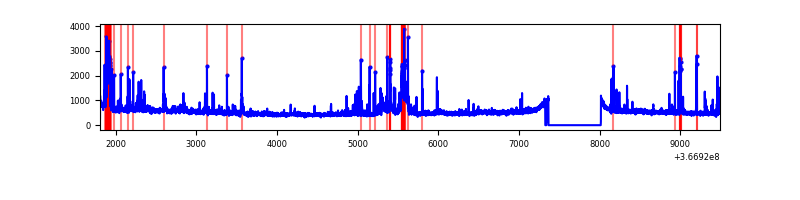 |
Top three noisy pixels from each quadrant. If the there are fewer than three noisy pixels in the level2.evt file, extra rows are filled as -1
| Pixel properties | Quadrant properties | ||||||
|---|---|---|---|---|---|---|---|
| Quadrant | DetID | PixID | Counts | Sigma | Mean | Median | Sigma |
| A | 13 | 254 | 13700 | 70.62 | 902 | 888 | 181.4 |
| A | 3 | 137 | 9001 | 44.72 | 902 | 888 | 181.4 |
| A | 0 | 226 | 7420 | 36.0 | 902 | 888 | 181.4 |
| B | 6 | 159 | 1810932 | 10618.51 | 886 | 864 | 170.5 |
| B | 0 | 229 | 113496 | 660.74 | 886 | 864 | 170.5 |
| B | 10 | 245 | 32729 | 186.93 | 886 | 864 | 170.5 |
| C | 0 | 10 | 463032 | 2309.5 | 851 | 860 | 200.1 |
| C | 3 | 233 | 333242 | 1660.93 | 851 | 860 | 200.1 |
| C | 14 | 238 | 150042 | 745.47 | 851 | 860 | 200.1 |
| D | 2 | 250 | 249059 | 1185.37 | 871 | 850 | 209.4 |
| D | 8 | 195 | 246564 | 1173.46 | 871 | 850 | 209.4 |
| D | 13 | 174 | 177030 | 841.38 | 871 | 850 | 209.4 |
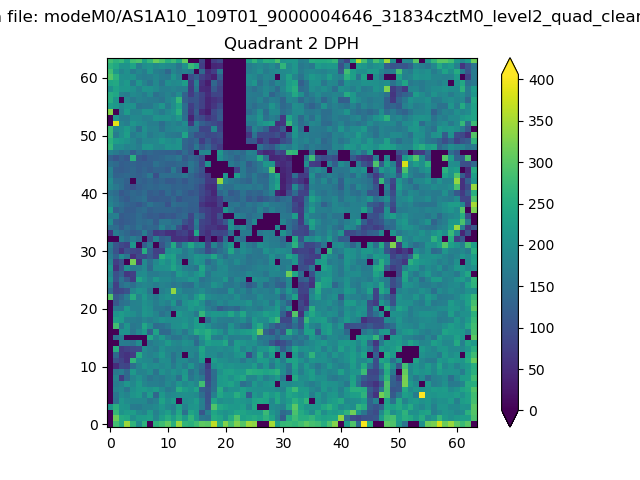
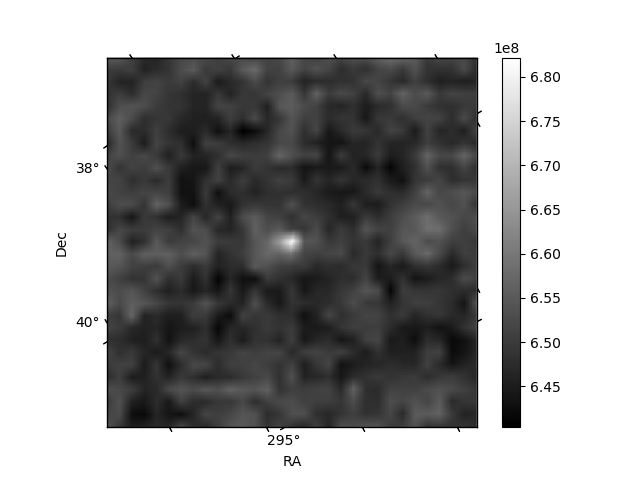
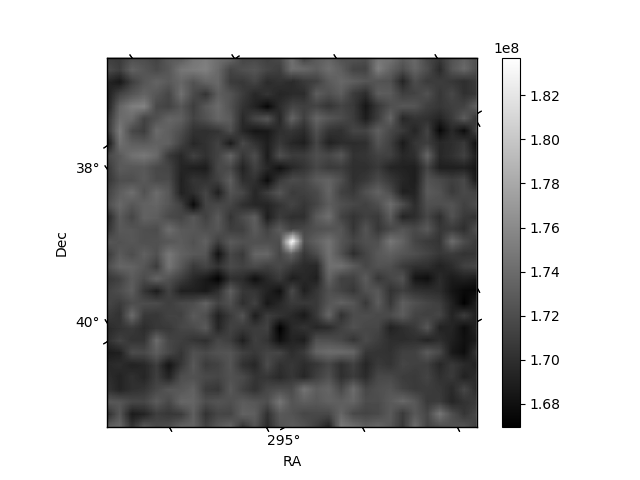
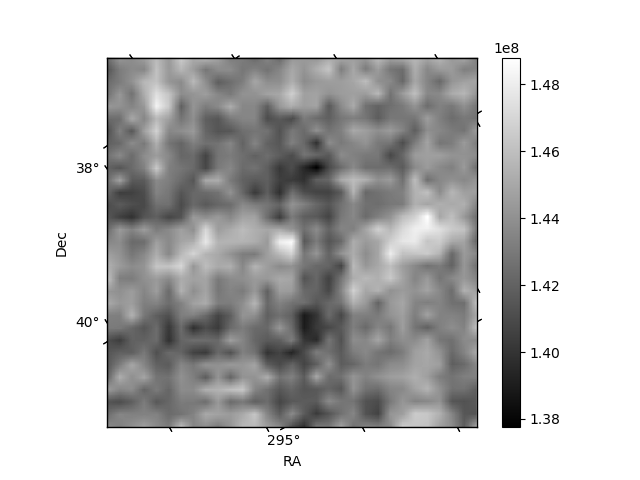
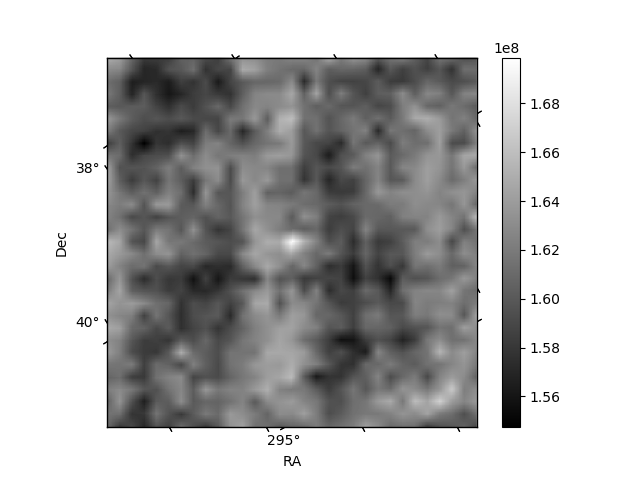
Histogram calculated using DETX and DETY for each event in the final _common_clean file
| Quadrant A | 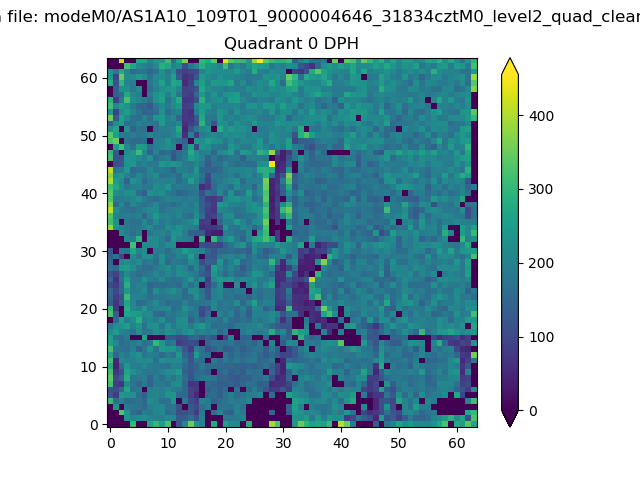 |
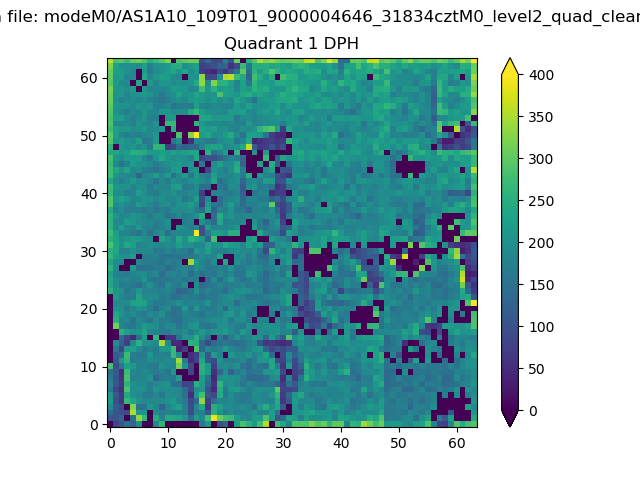 |
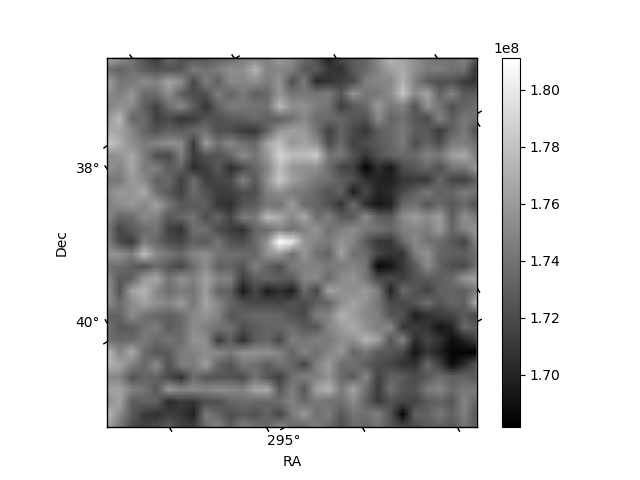
Quadrant B |
|---|---|---|---|
| Quadrant D | 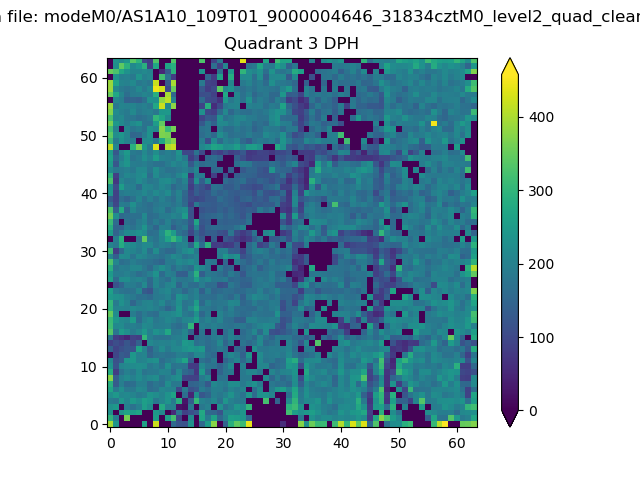 |
 |
Quadrant C |
| Plot type | Count rate plots | Images |
|---|---|---|
| Comparison with Poisson distribution Blue bars denote a histogram of data divided into 1 sec bins. Red curve is a Poisson curve with rate = median count rate of data. |
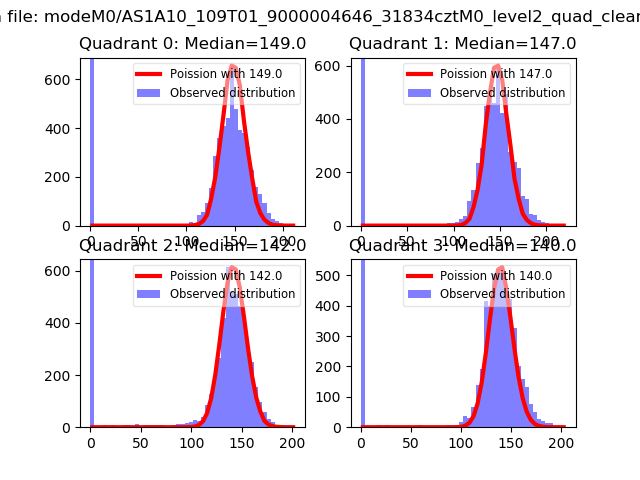 |
 |
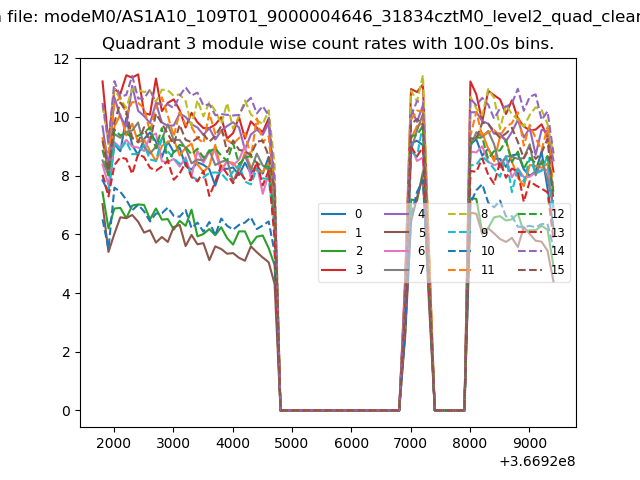
| Quadrant-wise count rates Data is divided into 100 sec bins |
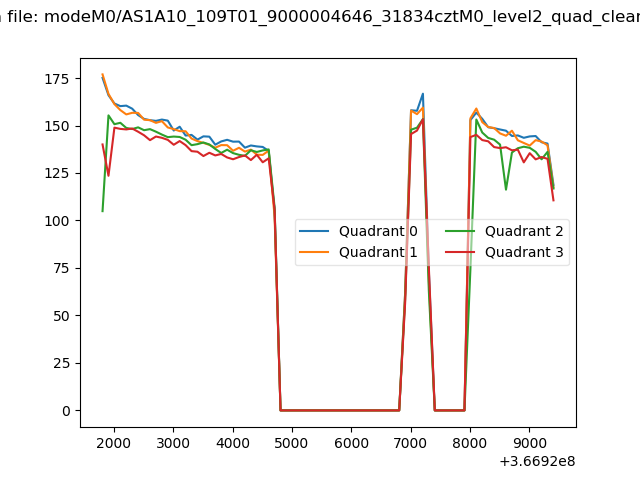 |
|
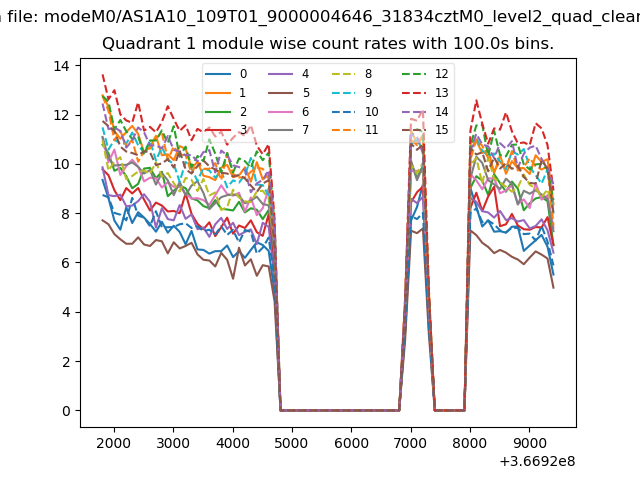
| Module-wise count rates for Quadrant A Data is divided into 100 sec bins |
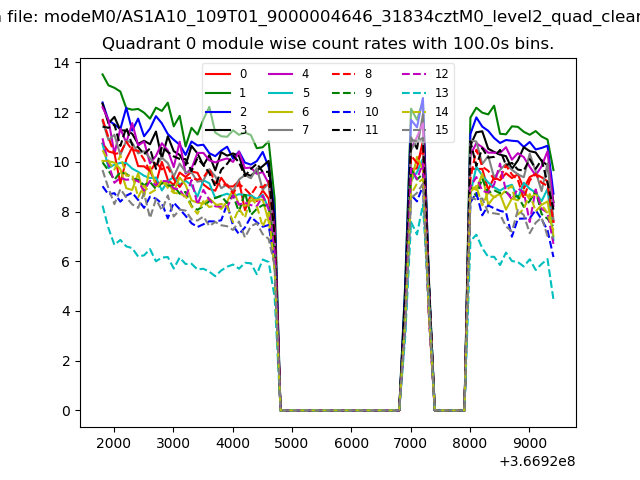 |
 |
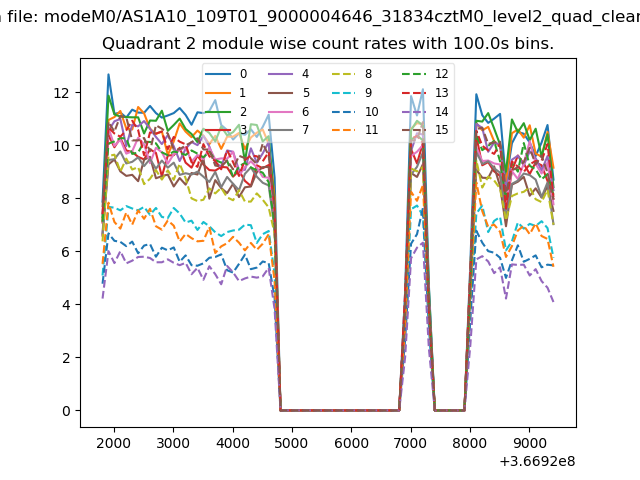
| Module-wise count rates for Quadrant B Data is divided into 100 sec bins |
 |
 |
| Module-wise count rates for Quadrant C Data is divided into 100 sec bins |
 |
 |
| Module-wise count rates for Quadrant D Data is divided into 100 sec bins |
 |
 |
| Parameter | Plot |
|---|---|
| CZT HV Monitor |  |
| D_VDD | 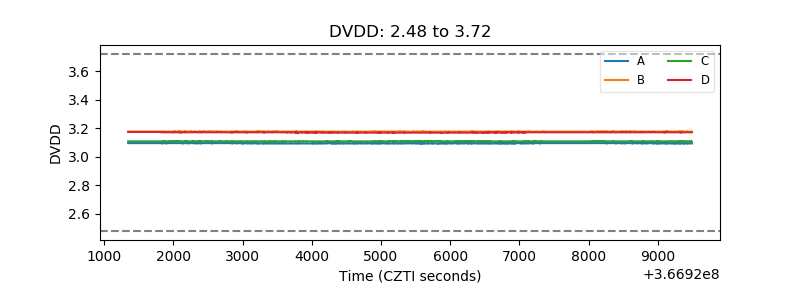 |
| Temperature 1 | 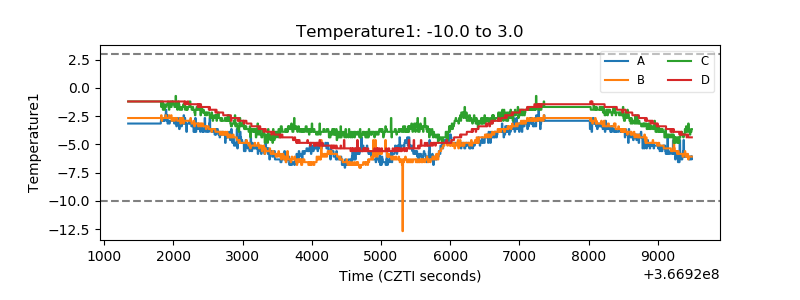 |
| Veto HV Monitor | 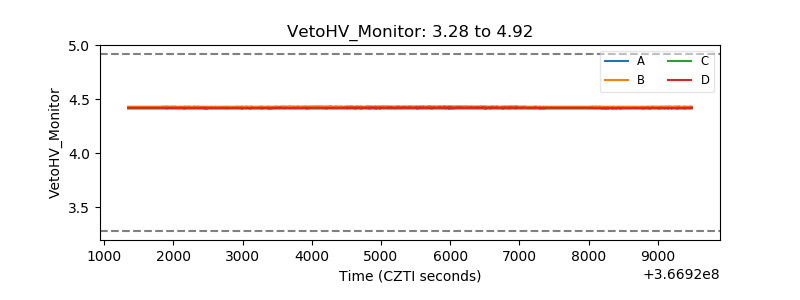 |
| Veto LLD | 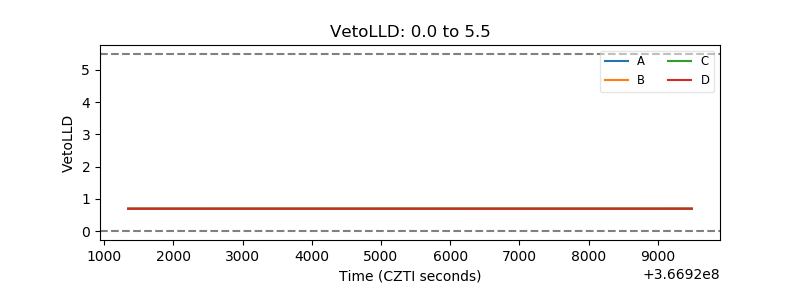 |
| Alpha Counter | 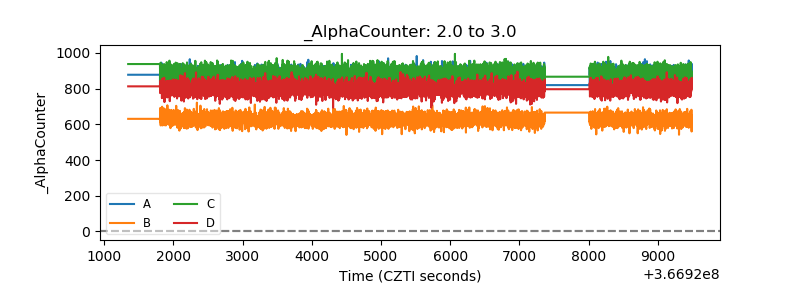 |
| _CPM_Rate | 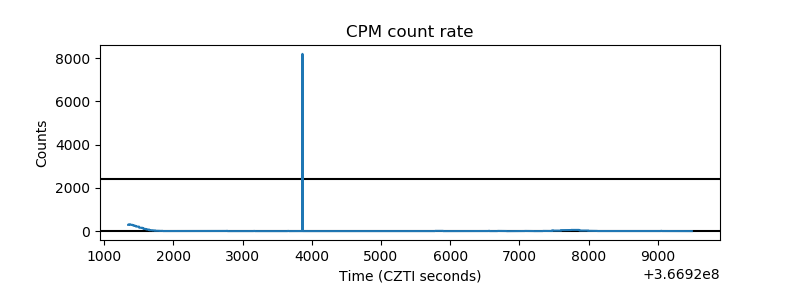 |
| CZT Counter | 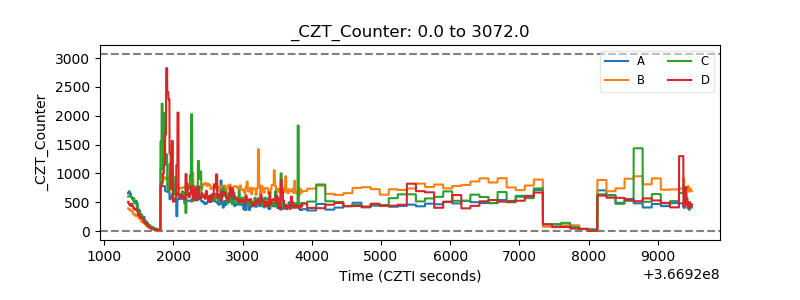 |
| +2.5 Volts monitor |  |
| +5 Volts monitor | 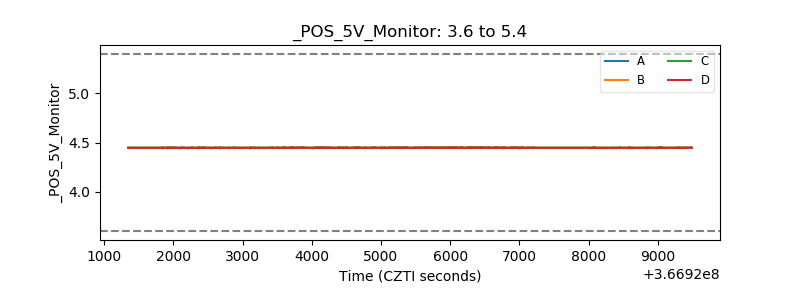 |
| _ROLL_ROT |  |
| _Roll_DEC | 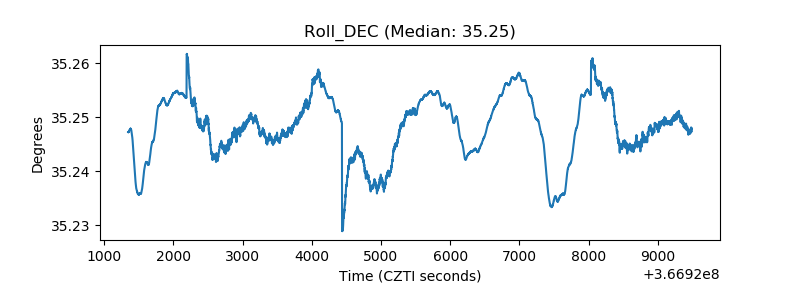 |
| _Roll_RA |  |
| Veto Counter | 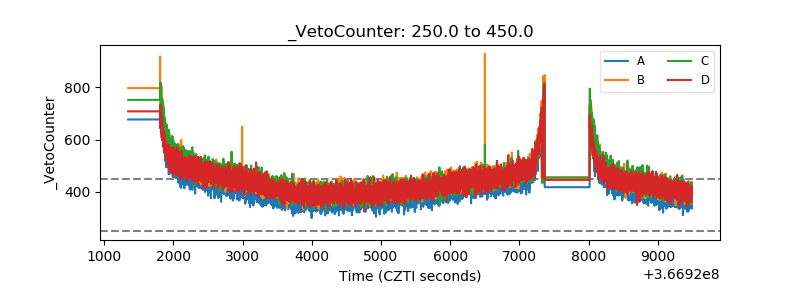 |