| Param | Original file | Final file |
|---|---|---|
| Filename | modeM0/AS1A10_109T01_9000004646_31835cztM0_level2.evt | modeM0/AS1A10_109T01_9000004646_31835cztM0_level2_quad_clean.evt |
| Size (bytes) | 577,474,560 | 111,093,120 |
| Size | 550.7 MB | 105.9 MB |
| Events in quadrant A | 3,516,082 | 735,383 |
| Events in quadrant B | 5,665,176 | 727,945 |
| Events in quadrant C | 4,031,463 | 699,655 |
| Events in quadrant D | 3,782,002 | 693,728 |
| Mode SS | |||
|---|---|---|---|
| Quadrant | BADHDUFLAG | Total packets | Discarded packets |
| A | 0 | 150 | 0 |
| B | 0 | 150 | 0 |
| C | 0 | 150 | 0 |
| D | 0 | 150 | 0 |
| Mode M0 | |||
|---|---|---|---|
| Quadrant | BADHDUFLAG | Total packets | Discarded packets |
| A | 0 | 15135 | 1 |
| B | 0 | 22318 | 1 |
| C | 0 | 16591 | 1 |
| D | 0 | 16010 | 1 |
| Mode M9 | |||
|---|---|---|---|
| Quadrant | BADHDUFLAG | Total packets | Discarded packets |
| A | 0 | 3 | 0 |
| B | 0 | 3 | 0 |
| C | 0 | 3 | 0 |
| D | 0 | 3 | 0 |
| Quadrant | Total seconds | Saturated seconds | Saturation percentage |
|---|---|---|---|
| A | 7294 | 28 | 0.383877% |
| B | 7295 | 98 | 1.343386% |
| C | 7295 | 236 | 3.235093% |
| D | 7295 | 49 | 0.671693% |
Noise dominated data is calculated using 1-second bins in cleaned event files. If a bin has >2000 counts, and if more than 50% of those come from <1% of pixels, then it is considered to be noise-dominated and hence unusable.
| Quadrant | # 1 sec bins | Bins with >0 counts | Bins with >2000 counts | High rate bins dominated by noise | Noise dominated (total time) | Noise dominated (detector-on time) | Marked lightcurve |
|---|---|---|---|---|---|---|---|
| A | 7624 | 7296 | 0 | 0 | 0.00% | 0.00% | 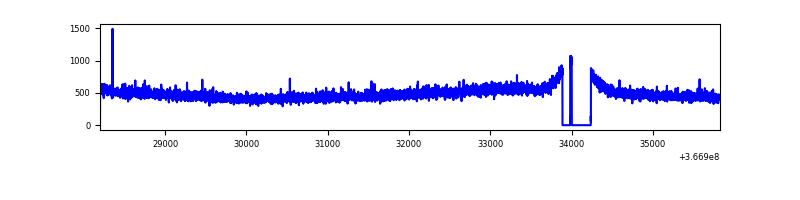 |
| B | 7625 | 7297 | 7 | 7 | 0.09% | 0.10% | 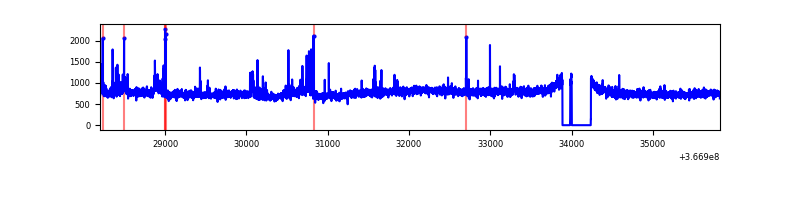 |
| C | 7625 | 7297 | 45 | 45 | 0.59% | 0.62% | 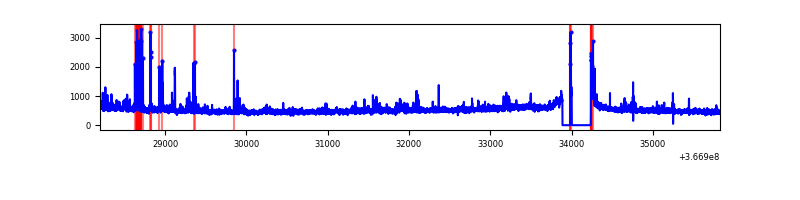 |
| D | 7625 | 7297 | 17 | 17 | 0.22% | 0.23% | 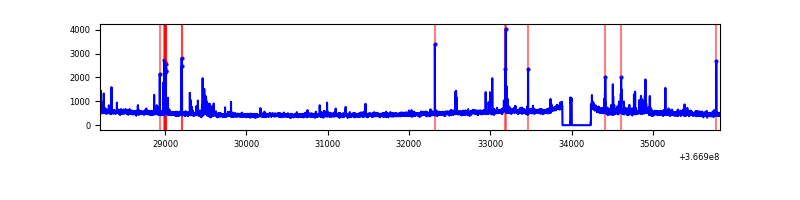 |
Top three noisy pixels from each quadrant. If the there are fewer than three noisy pixels in the level2.evt file, extra rows are filled as -1
| Pixel properties | Quadrant properties | ||||||
|---|---|---|---|---|---|---|---|
| Quadrant | DetID | PixID | Counts | Sigma | Mean | Median | Sigma |
| A | 13 | 254 | 14611 | 74.88 | 909 | 893 | 183.2 |
| A | 3 | 137 | 9137 | 45.0 | 909 | 893 | 183.2 |
| A | 0 | 226 | 7496 | 36.04 | 909 | 893 | 183.2 |
| B | 6 | 159 | 1954943 | 11410.91 | 894 | 870 | 171.2 |
| B | 10 | 245 | 77059 | 444.91 | 894 | 870 | 171.2 |
| B | 0 | 229 | 64728 | 372.9 | 894 | 870 | 171.2 |
| C | 0 | 10 | 267464 | 1300.72 | 870 | 878 | 205.0 |
| C | 14 | 238 | 169207 | 821.31 | 870 | 878 | 205.0 |
| C | 3 | 233 | 137265 | 665.46 | 870 | 878 | 205.0 |
| D | 8 | 195 | 236922 | 1125.72 | 883 | 864 | 209.7 |
| D | 12 | 218 | 64697 | 304.41 | 883 | 864 | 209.7 |
| D | 13 | 249 | 57497 | 270.07 | 883 | 864 | 209.7 |
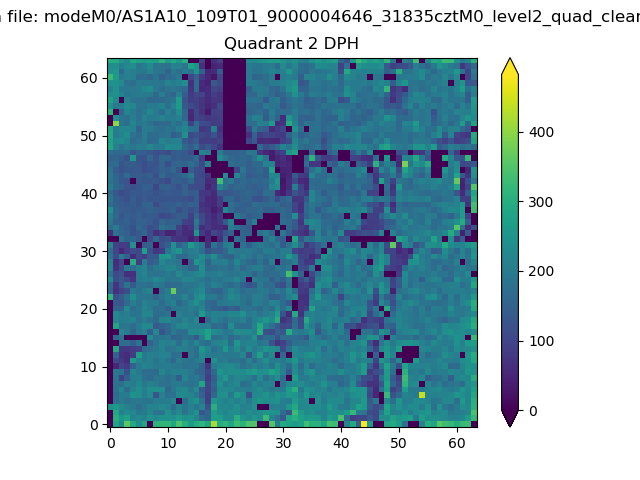
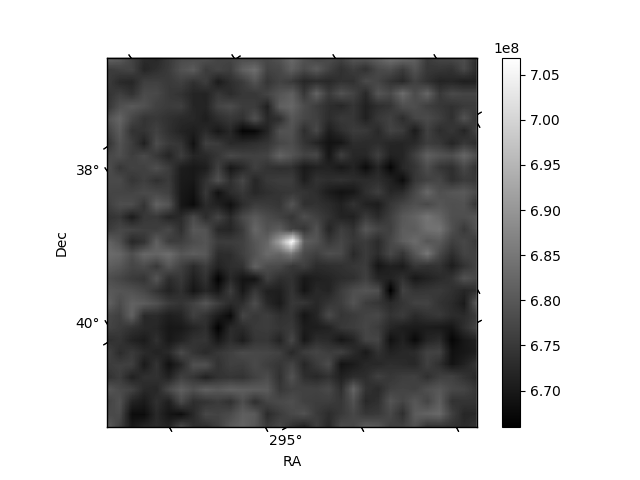
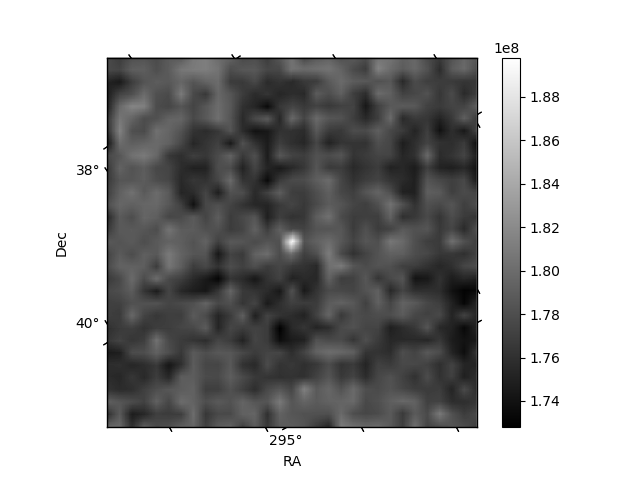
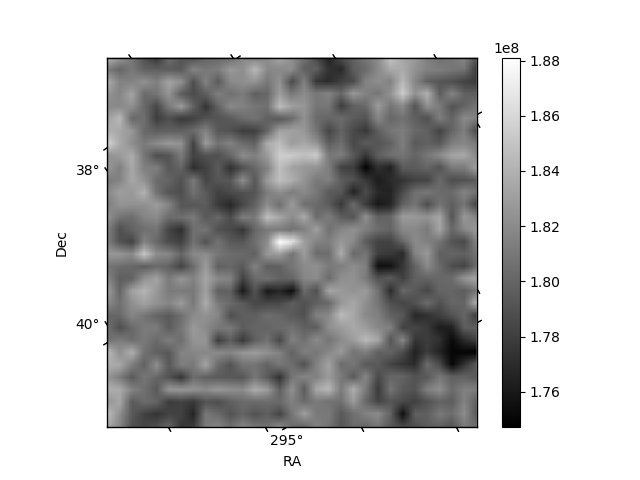
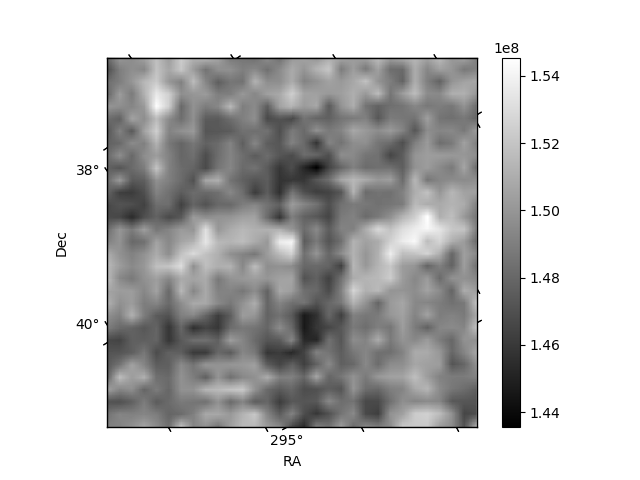
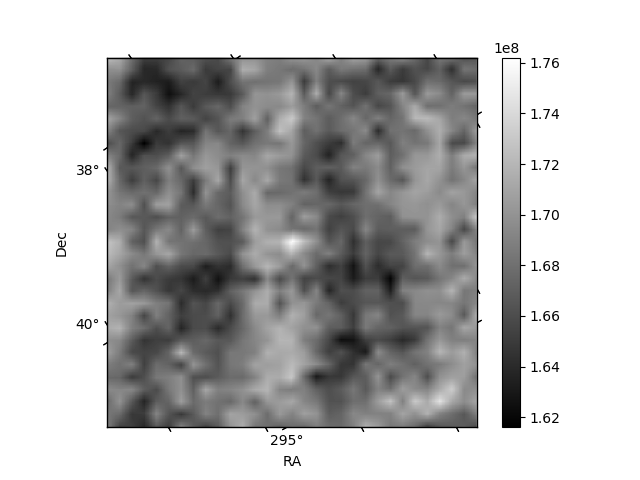
Histogram calculated using DETX and DETY for each event in the final _common_clean file
| Quadrant A | 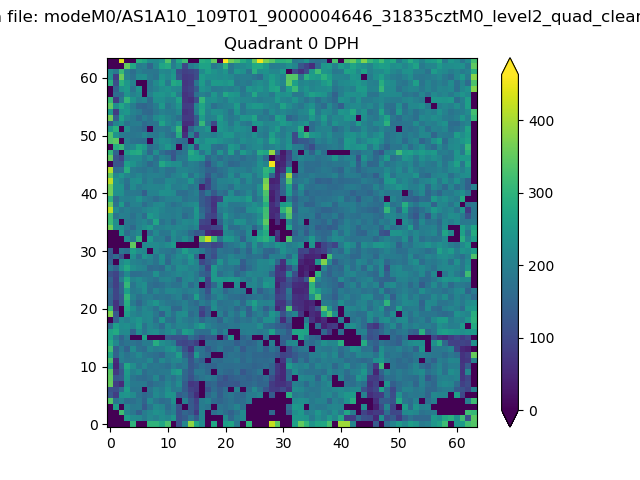 |
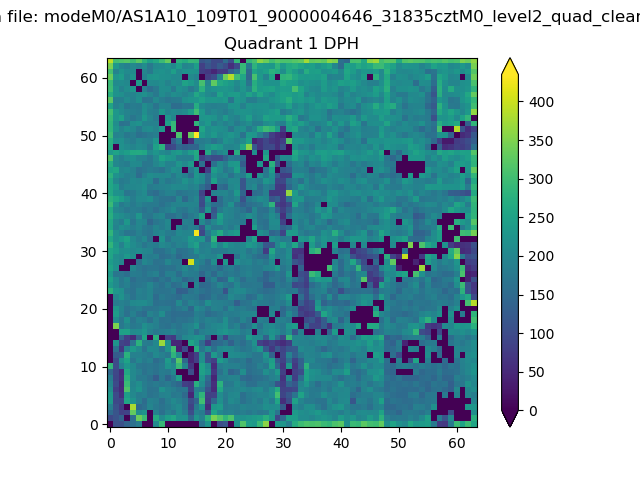 |
Quadrant B |
|---|---|---|---|
| Quadrant D | 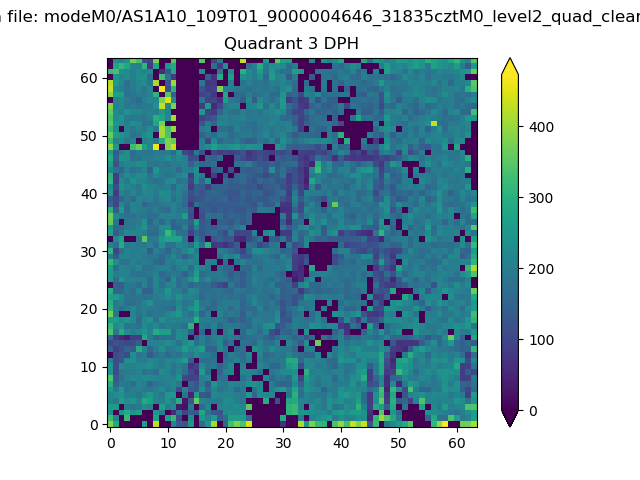 |
 |
Quadrant C |
| Plot type | Count rate plots | Images |
|---|---|---|
| Comparison with Poisson distribution Blue bars denote a histogram of data divided into 1 sec bins. Red curve is a Poisson curve with rate = median count rate of data. |
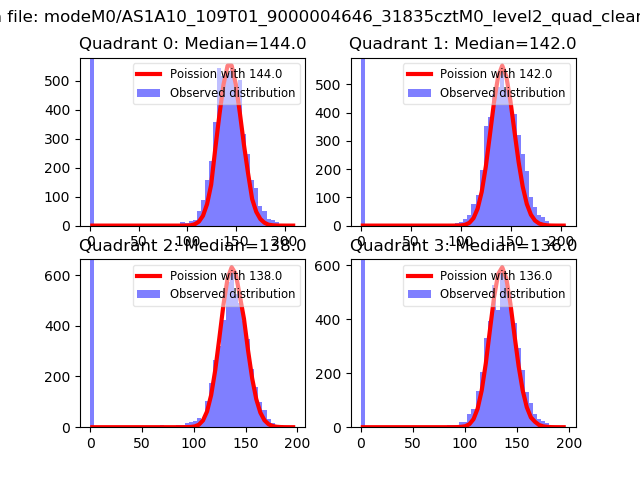 |
 |
| Quadrant-wise count rates Data is divided into 100 sec bins |
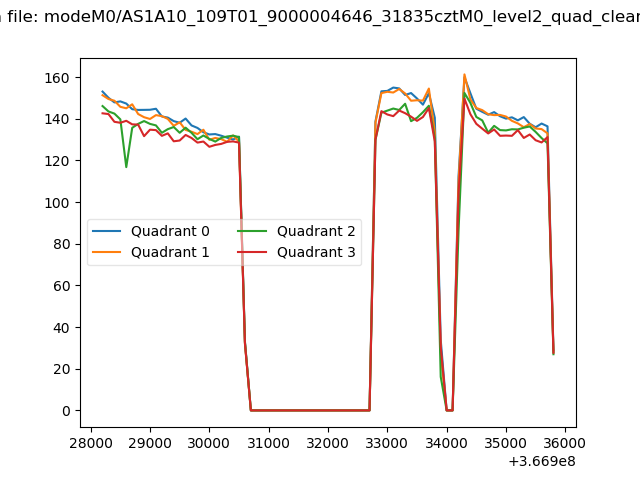 |
|
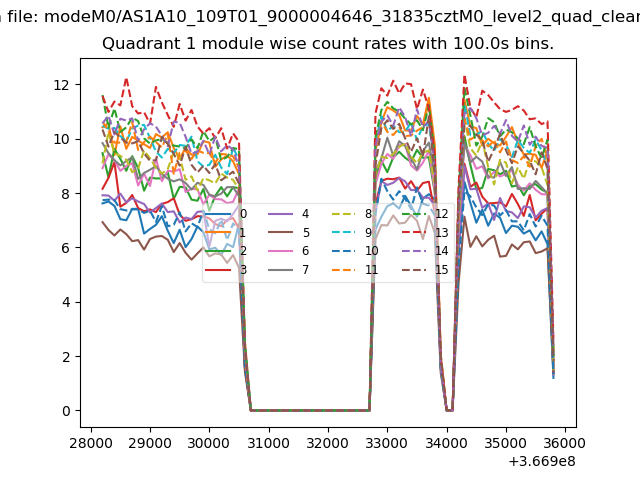
| Module-wise count rates for Quadrant A Data is divided into 100 sec bins |
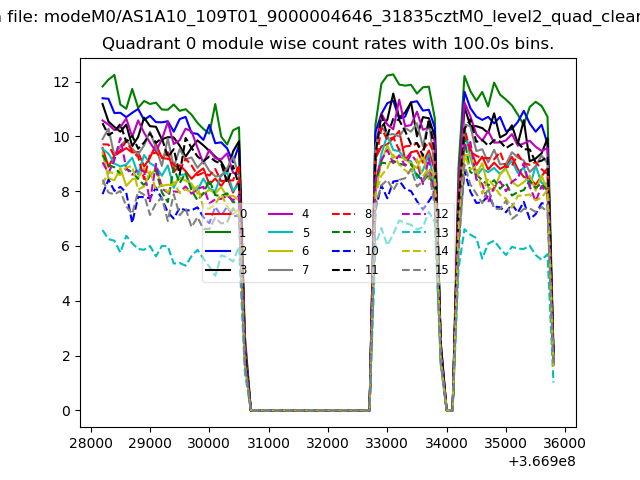 |
 |
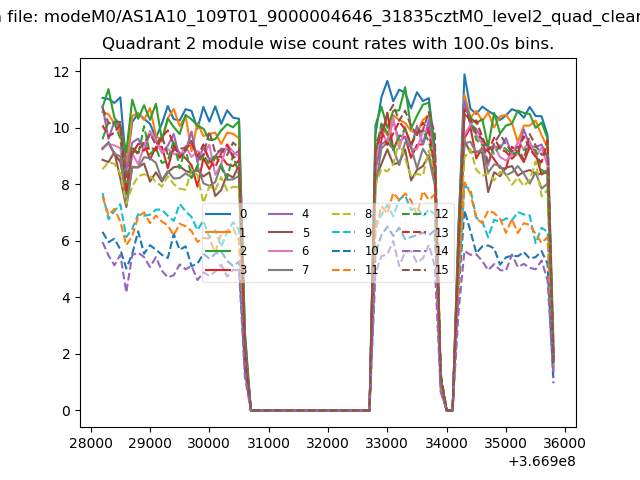
| Module-wise count rates for Quadrant B Data is divided into 100 sec bins |
 |
 |
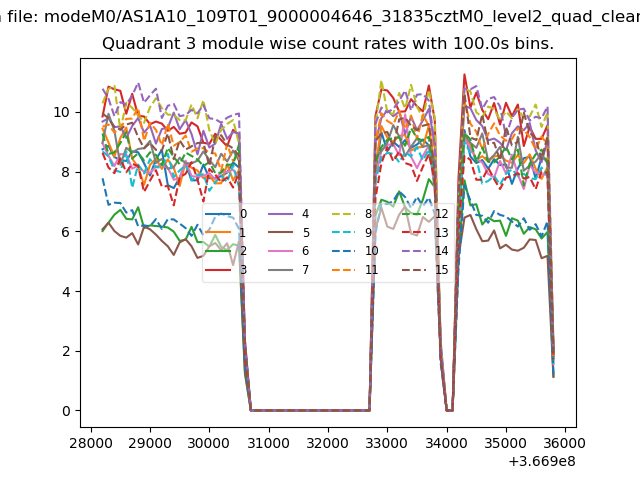
| Module-wise count rates for Quadrant C Data is divided into 100 sec bins |
 |
 |
| Module-wise count rates for Quadrant D Data is divided into 100 sec bins |
 |
 |
| Parameter | Plot |
|---|---|
| CZT HV Monitor | 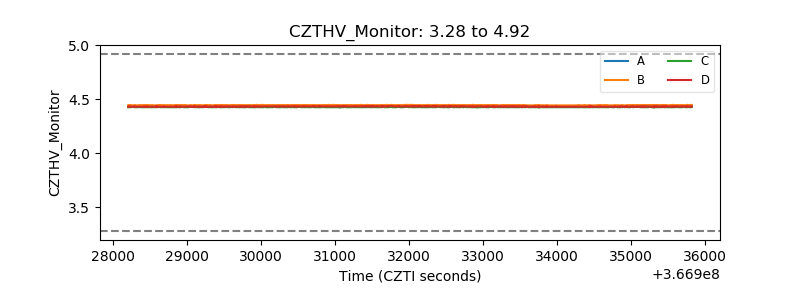 |
| D_VDD | 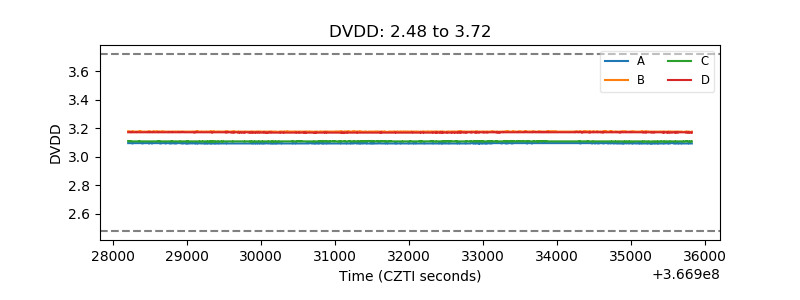 |
| Temperature 1 | 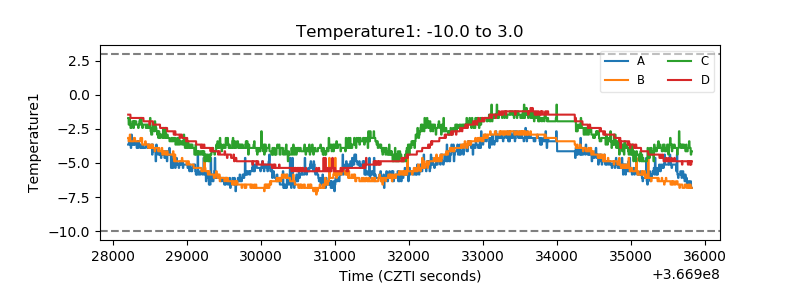 |
| Veto HV Monitor | 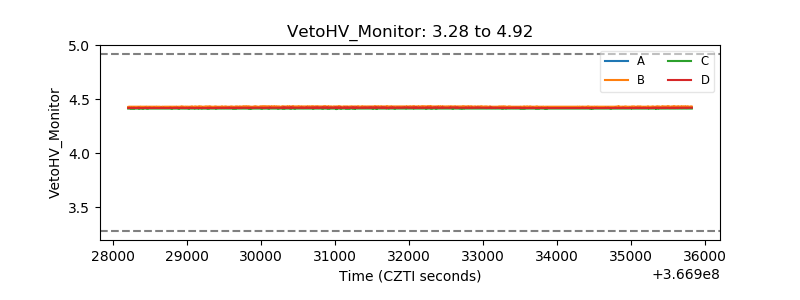 |
| Veto LLD | 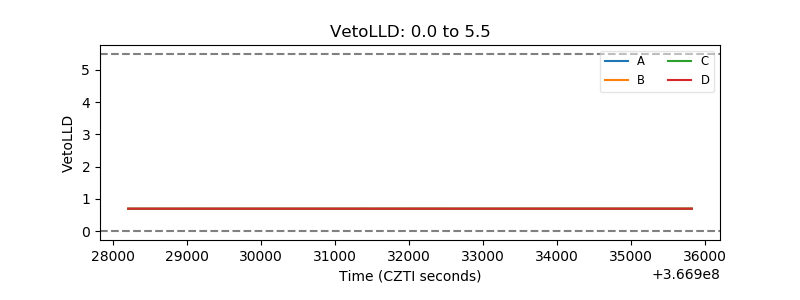 |
| Alpha Counter | 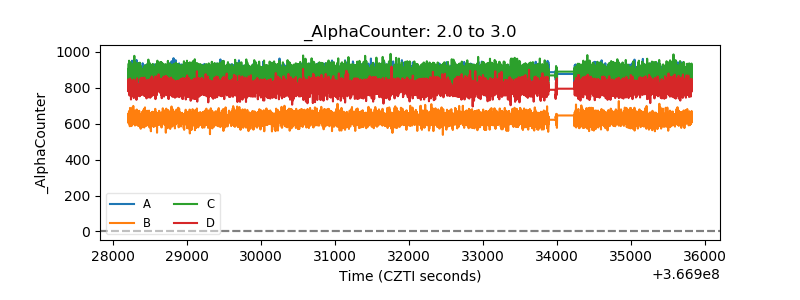 |
| _CPM_Rate | 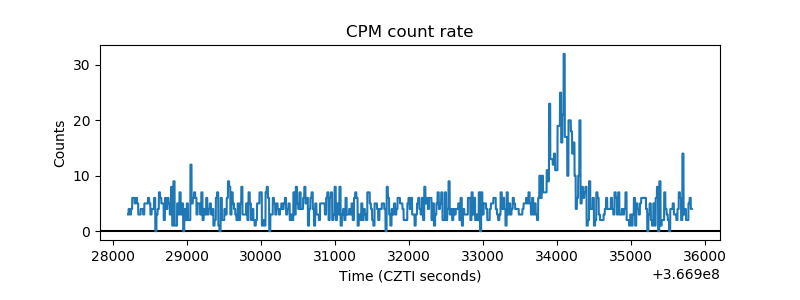 |
| CZT Counter | 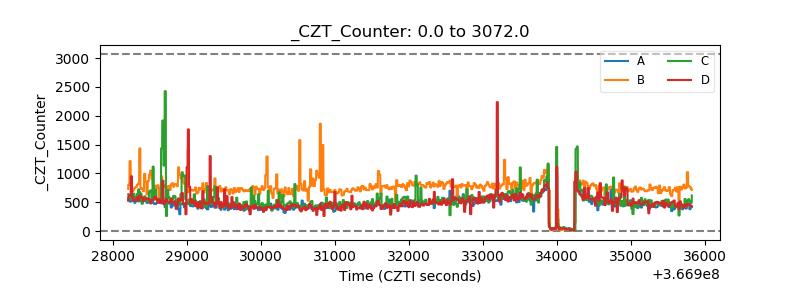 |
| +2.5 Volts monitor |  |
| +5 Volts monitor | 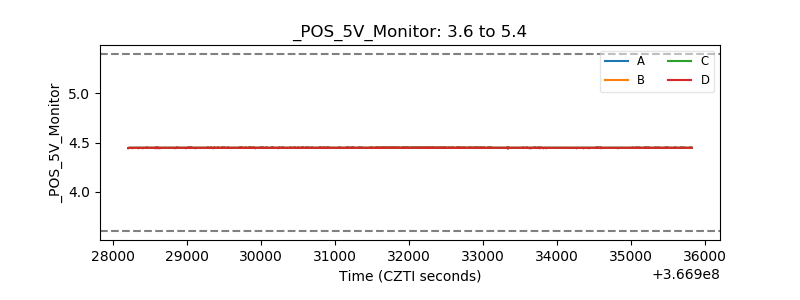 |
| _ROLL_ROT | 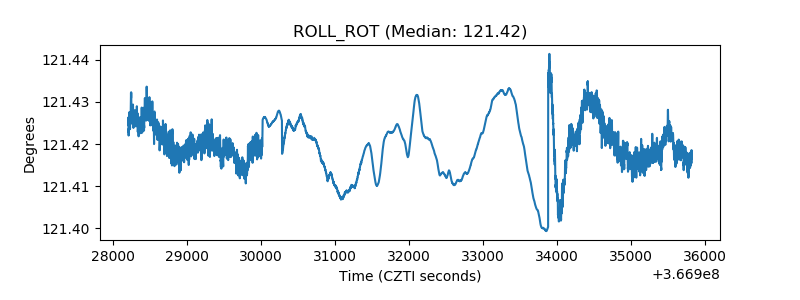 |
| _Roll_DEC | 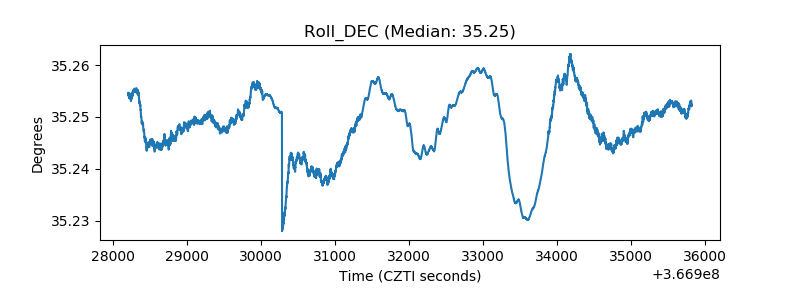 |
| _Roll_RA | 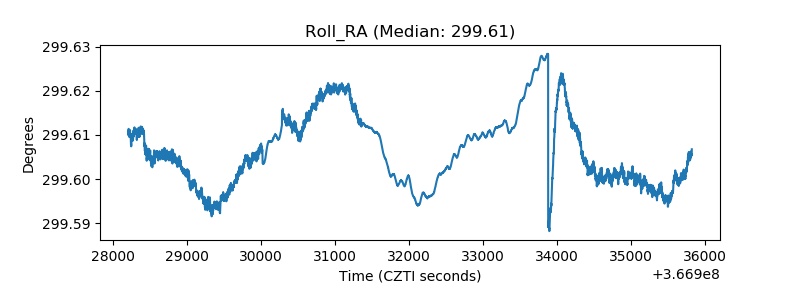 |
| Veto Counter |  |