| Param | Original file | Final file |
|---|---|---|
| Filename | modeM0/AS1A10_109T01_9000004646_31836cztM0_level2.evt | modeM0/AS1A10_109T01_9000004646_31836cztM0_level2_quad_clean.evt |
| Size (bytes) | 539,657,280 | 104,497,920 |
| Size | 514.7 MB | 99.7 MB |
| Events in quadrant A | 3,332,386 | 687,050 |
| Events in quadrant B | 5,300,884 | 679,682 |
| Events in quadrant C | 3,588,981 | 660,914 |
| Events in quadrant D | 3,646,868 | 649,649 |
| Mode SS | |||
|---|---|---|---|
| Quadrant | BADHDUFLAG | Total packets | Discarded packets |
| A | 0 | 142 | 0 |
| B | 0 | 142 | 0 |
| C | 0 | 142 | 0 |
| D | 0 | 142 | 0 |
| Mode M0 | |||
|---|---|---|---|
| Quadrant | BADHDUFLAG | Total packets | Discarded packets |
| A | 0 | 14505 | 1 |
| B | 0 | 21191 | 1 |
| C | 0 | 15168 | 1 |
| D | 0 | 15568 | 1 |
| Mode M9 | |||
|---|---|---|---|
| Quadrant | BADHDUFLAG | Total packets | Discarded packets |
| A | 0 | 2 | 0 |
| B | 0 | 2 | 0 |
| C | 0 | 2 | 0 |
| D | 0 | 2 | 0 |
| Quadrant | Total seconds | Saturated seconds | Saturation percentage |
|---|---|---|---|
| A | 6998 | 45 | 0.643041% |
| B | 6998 | 123 | 1.757645% |
| C | 6998 | 160 | 2.286368% |
| D | 6999 | 70 | 1.000143% |
Noise dominated data is calculated using 1-second bins in cleaned event files. If a bin has >2000 counts, and if more than 50% of those come from <1% of pixels, then it is considered to be noise-dominated and hence unusable.
| Quadrant | # 1 sec bins | Bins with >0 counts | Bins with >2000 counts | High rate bins dominated by noise | Noise dominated (total time) | Noise dominated (detector-on time) | Marked lightcurve |
|---|---|---|---|---|---|---|---|
| A | 7218 | 7000 | 0 | 0 | 0.00% | 0.00% | 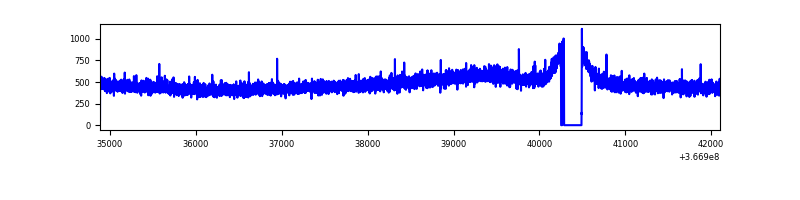 |
| B | 7218 | 7000 | 1 | 1 | 0.01% | 0.01% | 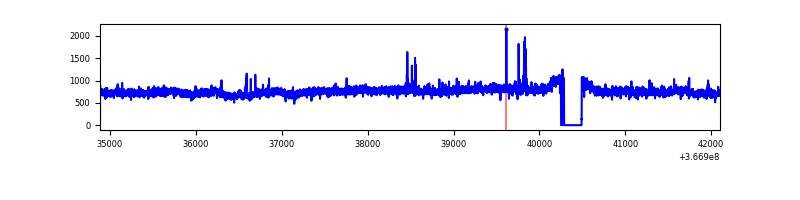 |
| C | 7218 | 7000 | 2 | 2 | 0.03% | 0.03% | 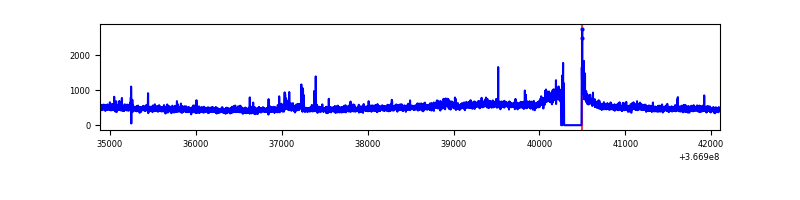 |
| D | 7219 | 7001 | 41 | 41 | 0.57% | 0.59% | 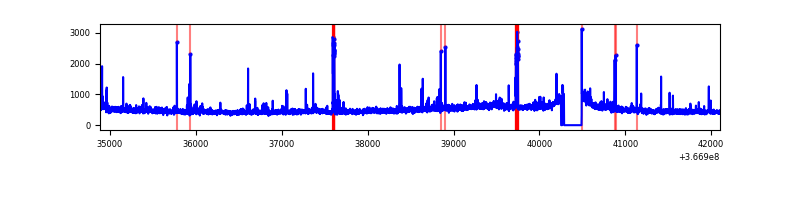 |
Top three noisy pixels from each quadrant. If the there are fewer than three noisy pixels in the level2.evt file, extra rows are filled as -1
| Pixel properties | Quadrant properties | ||||||
|---|---|---|---|---|---|---|---|
| Quadrant | DetID | PixID | Counts | Sigma | Mean | Median | Sigma |
| A | 13 | 254 | 12599 | 67.25 | 862 | 845 | 174.8 |
| A | 3 | 137 | 8778 | 45.39 | 862 | 845 | 174.8 |
| A | 0 | 226 | 7199 | 36.35 | 862 | 845 | 174.8 |
| B | 6 | 159 | 1895052 | 11557.46 | 849 | 828 | 163.9 |
| B | 0 | 213 | 22414 | 131.71 | 849 | 828 | 163.9 |
| B | 12 | 111 | 20453 | 119.74 | 849 | 828 | 163.9 |
| C | 14 | 238 | 146426 | 737.16 | 831 | 839 | 197.5 |
| C | 3 | 233 | 106283 | 533.9 | 831 | 839 | 197.5 |
| C | 0 | 10 | 57869 | 288.76 | 831 | 839 | 197.5 |
| D | 8 | 195 | 250719 | 1259.74 | 834 | 814 | 198.4 |
| D | 2 | 250 | 99277 | 496.34 | 834 | 814 | 198.4 |
| D | 12 | 218 | 49243 | 244.12 | 834 | 814 | 198.4 |
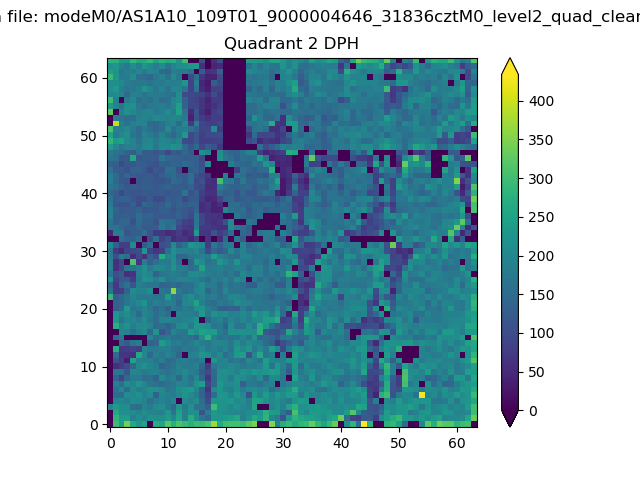
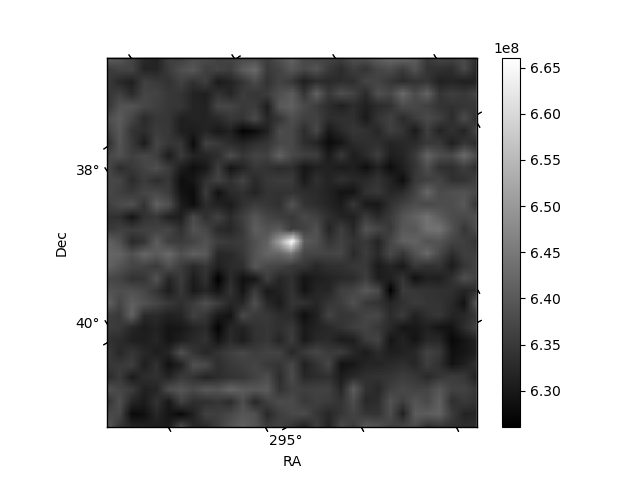
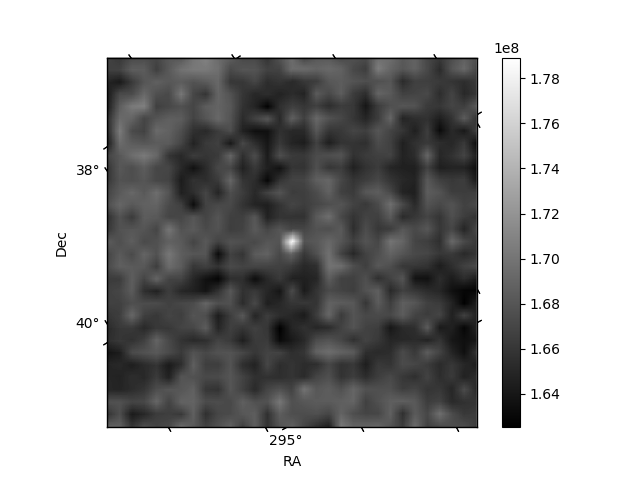
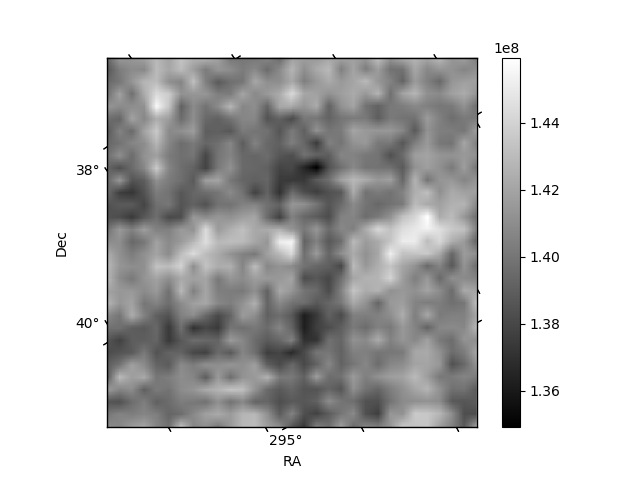
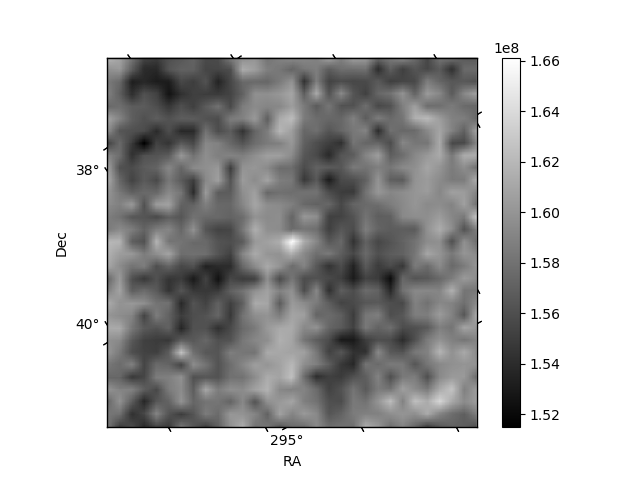
Histogram calculated using DETX and DETY for each event in the final _common_clean file
| Quadrant A | 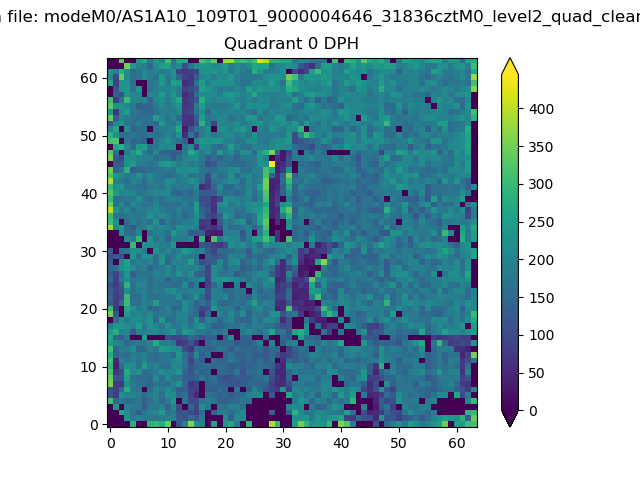 |
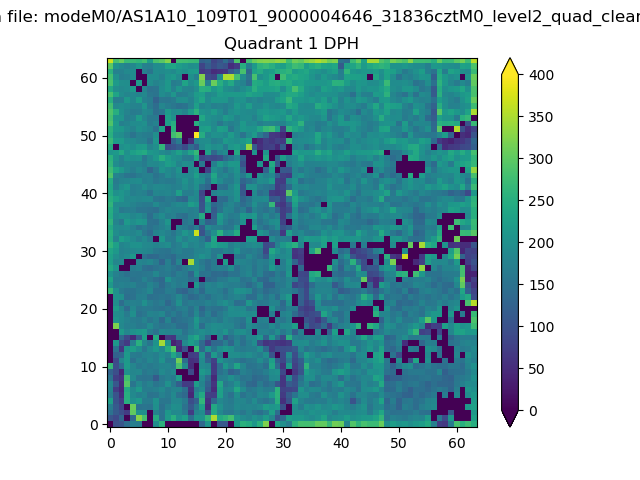 |
Quadrant B |
|---|---|---|---|
| Quadrant D | 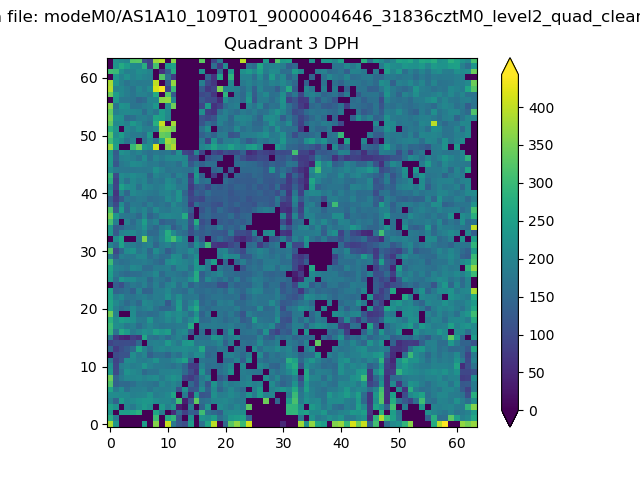 |
 |
Quadrant C |
| Plot type | Count rate plots | Images |
|---|---|---|
| Comparison with Poisson distribution Blue bars denote a histogram of data divided into 1 sec bins. Red curve is a Poisson curve with rate = median count rate of data. |
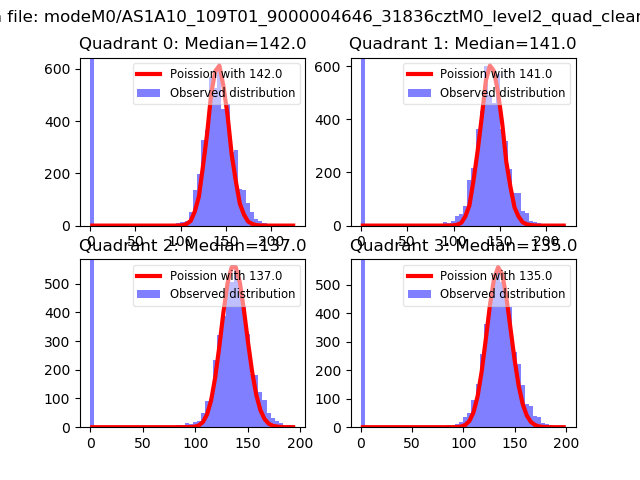 |
 |
| Quadrant-wise count rates Data is divided into 100 sec bins |
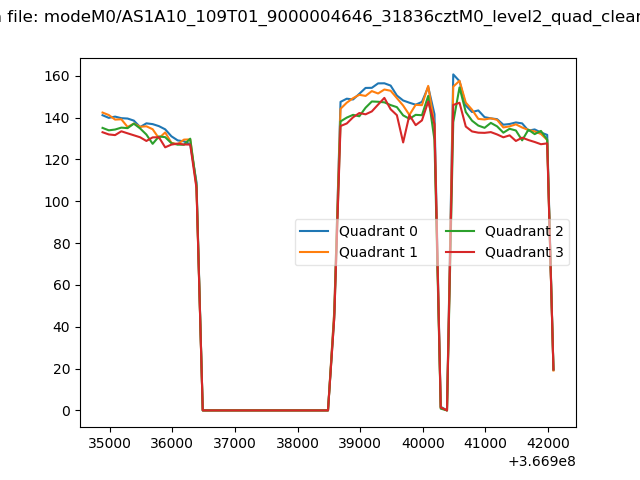 |
|
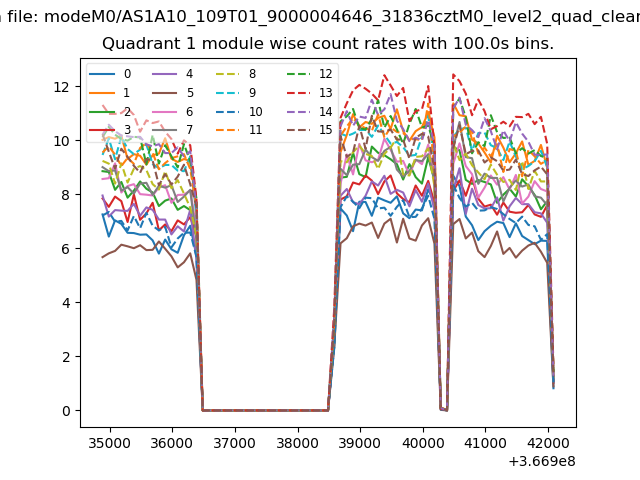
| Module-wise count rates for Quadrant A Data is divided into 100 sec bins |
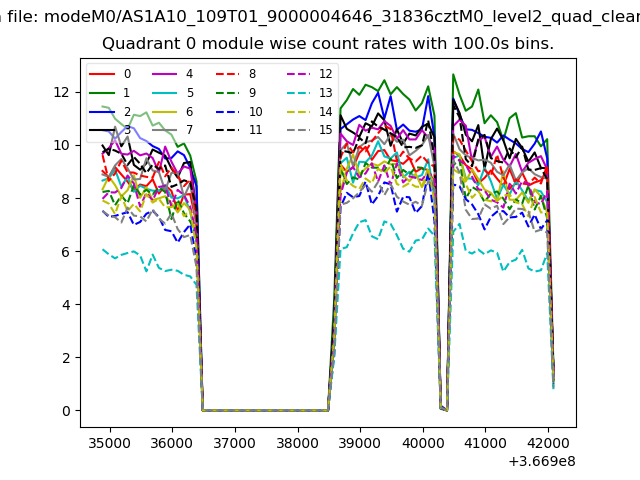 |
 |
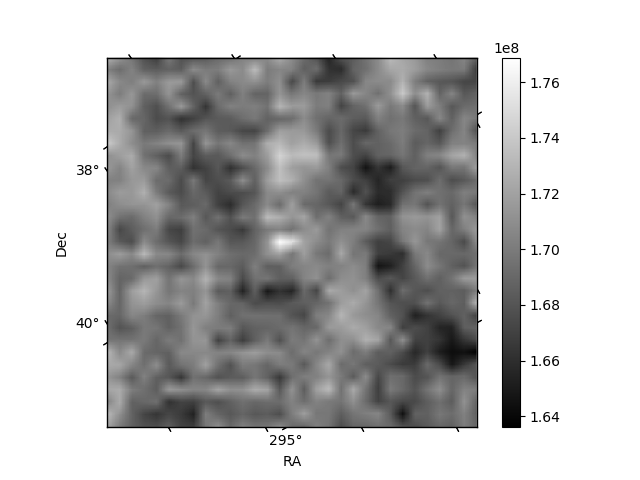
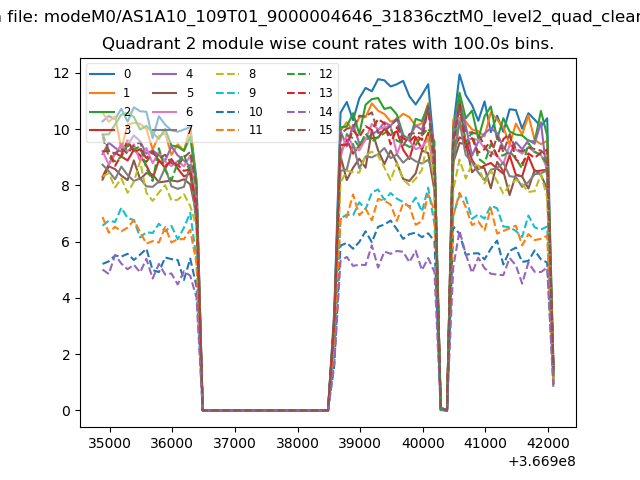
| Module-wise count rates for Quadrant B Data is divided into 100 sec bins |
 |
 |
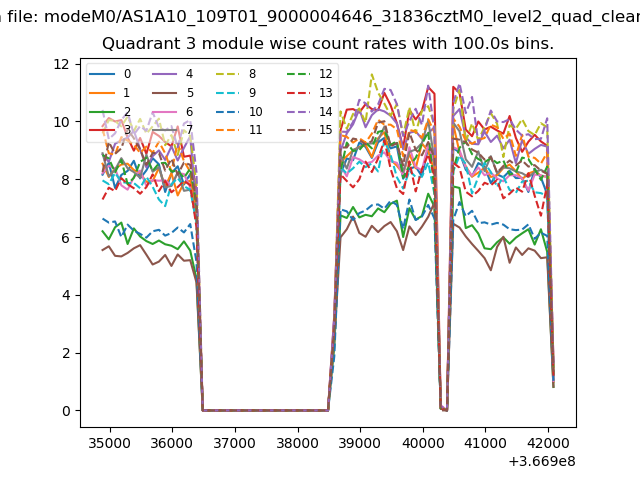
| Module-wise count rates for Quadrant C Data is divided into 100 sec bins |
 |
 |
| Module-wise count rates for Quadrant D Data is divided into 100 sec bins |
 |
 |
| Parameter | Plot |
|---|---|
| CZT HV Monitor | 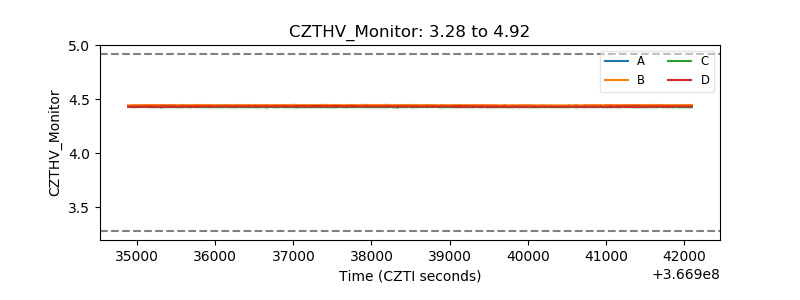 |
| D_VDD | 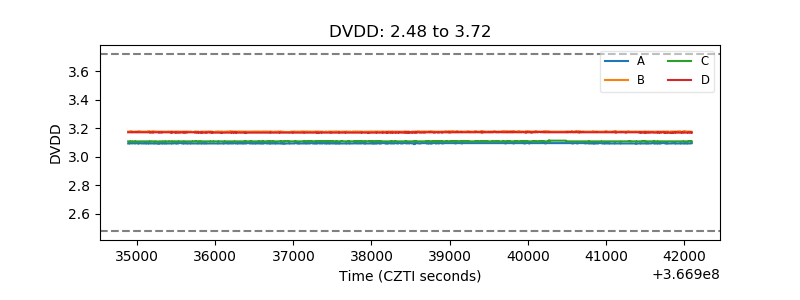 |
| Temperature 1 | 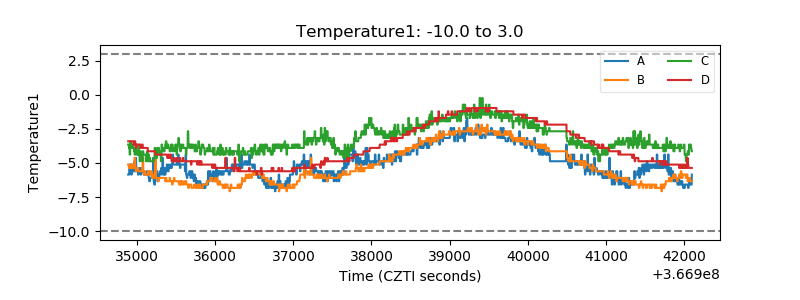 |
| Veto HV Monitor | 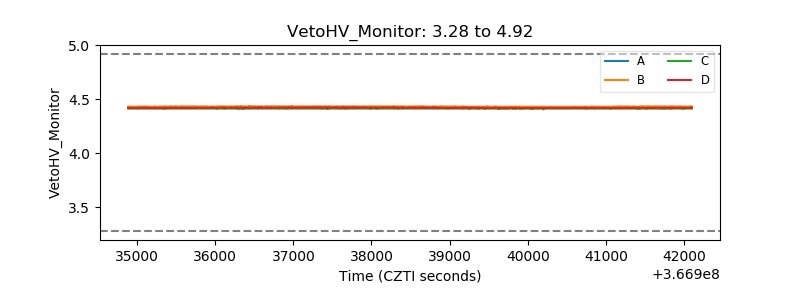 |
| Veto LLD | 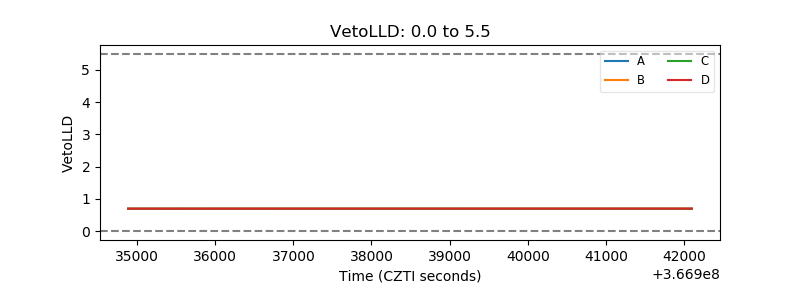 |
| Alpha Counter | 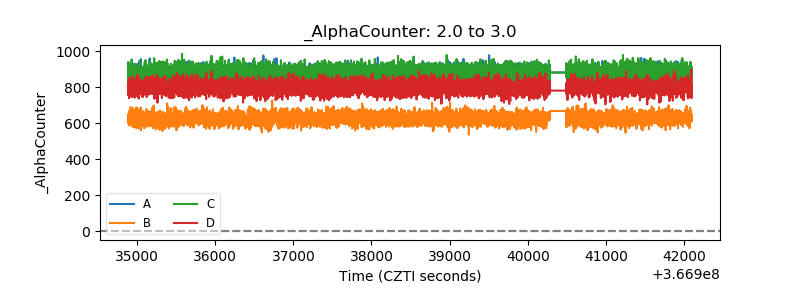 |
| _CPM_Rate | 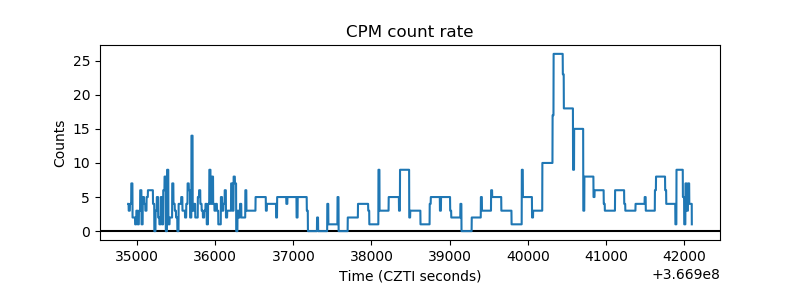 |
| CZT Counter | 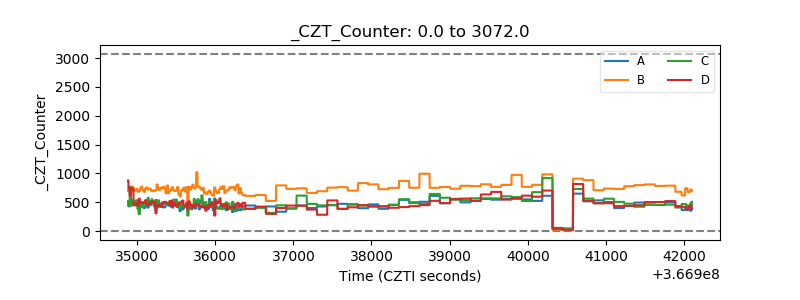 |
| +2.5 Volts monitor |  |
| +5 Volts monitor | 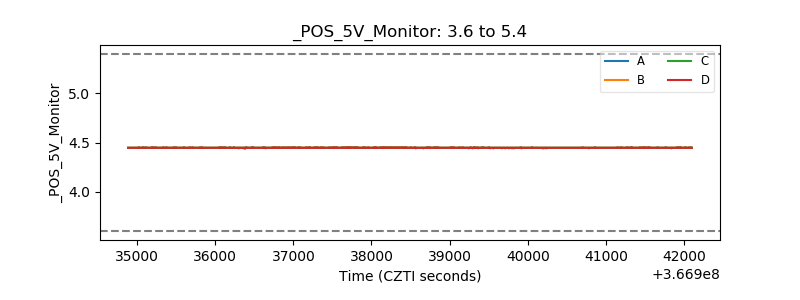 |
| _ROLL_ROT | 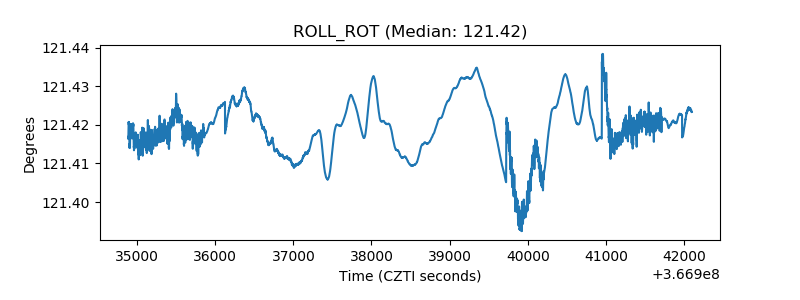 |
| _Roll_DEC | 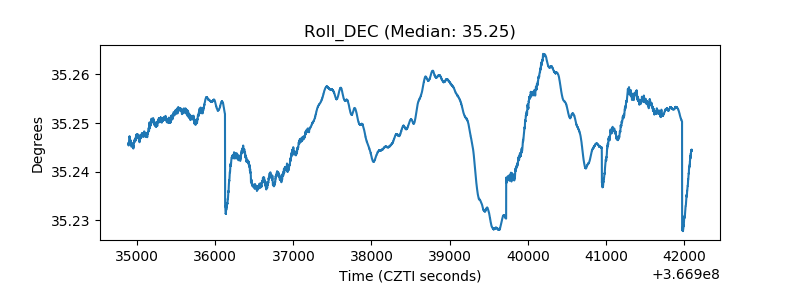 |
| _Roll_RA | 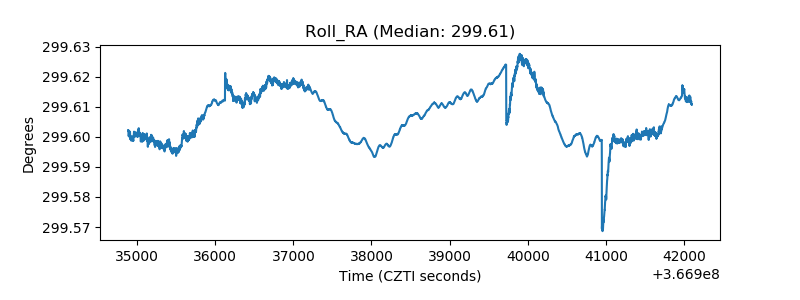 |
| Veto Counter | 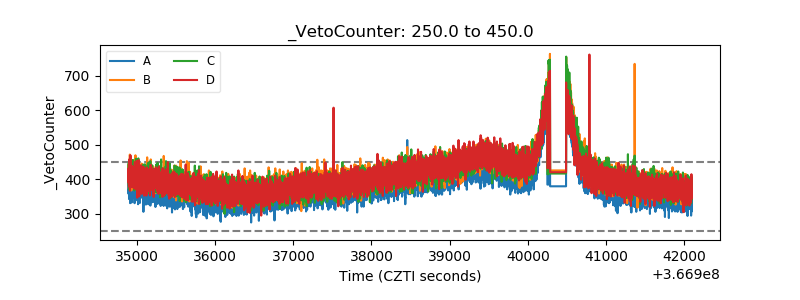 |