| Param | Original file | Final file |
|---|---|---|
| Filename | modeM0/AS1A10_109T01_9000004646_31839cztM0_level2.evt | modeM0/AS1A10_109T01_9000004646_31839cztM0_level2_quad_clean.evt |
| Size (bytes) | 1,489,841,280 | 245,528,640 |
| Size | 1.4 GB | 234.2 MB |
| Events in quadrant A | 8,920,631 | 1,590,737 |
| Events in quadrant B | 13,968,945 | 1,575,969 |
| Events in quadrant C | 10,312,805 | 1,510,452 |
| Events in quadrant D | 10,659,374 | 1,473,579 |
| Mode SS | |||
|---|---|---|---|
| Quadrant | BADHDUFLAG | Total packets | Discarded packets |
| A | 0 | 378 | 0 |
| B | 0 | 378 | 0 |
| C | 0 | 378 | 0 |
| D | 0 | 378 | 0 |
| Mode M0 | |||
|---|---|---|---|
| Quadrant | BADHDUFLAG | Total packets | Discarded packets |
| A | 0 | 38213 | 3 |
| B | 0 | 56080 | 3 |
| C | 0 | 42239 | 3 |
| D | 0 | 44202 | 3 |
| Mode M9 | |||
|---|---|---|---|
| Quadrant | BADHDUFLAG | Total packets | Discarded packets |
| A | 0 | 19 | 0 |
| B | 0 | 19 | 0 |
| C | 0 | 19 | 0 |
| D | 0 | 19 | 0 |
| Quadrant | Total seconds | Saturated seconds | Saturation percentage |
|---|---|---|---|
| A | 18662 | 92 | 0.492980% |
| B | 18662 | 237 | 1.269960% |
| C | 18662 | 632 | 3.386561% |
| D | 18663 | 461 | 2.470128% |
Noise dominated data is calculated using 1-second bins in cleaned event files. If a bin has >2000 counts, and if more than 50% of those come from <1% of pixels, then it is considered to be noise-dominated and hence unusable.
| Quadrant | # 1 sec bins | Bins with >0 counts | Bins with >2000 counts | High rate bins dominated by noise | Noise dominated (total time) | Noise dominated (detector-on time) | Marked lightcurve |
|---|---|---|---|---|---|---|---|
| A | 20442 | 18665 | 0 | 0 | 0.00% | 0.00% | 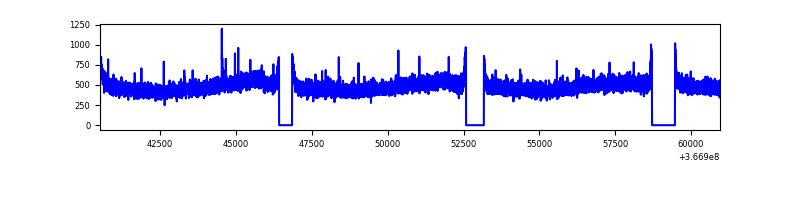 |
| B | 20442 | 18665 | 2 | 2 | 0.01% | 0.01% | 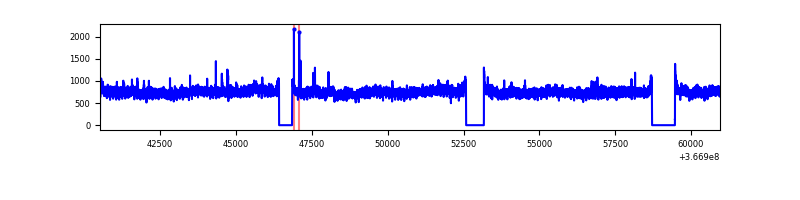 |
| C | 20442 | 18665 | 139 | 139 | 0.68% | 0.74% | 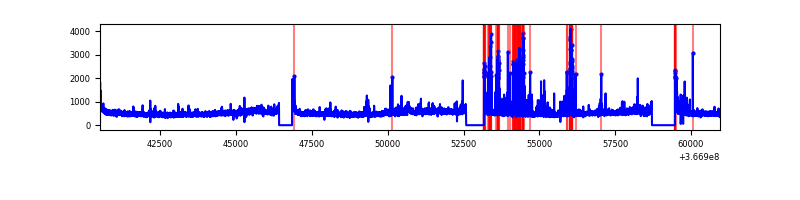 |
| D | 20443 | 18666 | 302 | 302 | 1.48% | 1.62% | 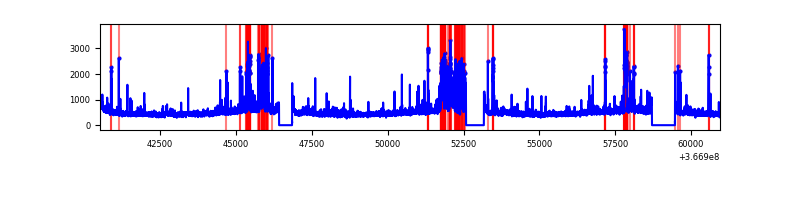 |
Top three noisy pixels from each quadrant. If the there are fewer than three noisy pixels in the level2.evt file, extra rows are filled as -1
| Pixel properties | Quadrant properties | ||||||
|---|---|---|---|---|---|---|---|
| Quadrant | DetID | PixID | Counts | Sigma | Mean | Median | Sigma |
| A | 13 | 254 | 31518 | 63.25 | 2309 | 2268 | 462.4 |
| A | 3 | 137 | 24009 | 47.02 | 2309 | 2268 | 462.4 |
| A | 0 | 226 | 19366 | 36.97 | 2309 | 2268 | 462.4 |
| B | 6 | 159 | 4936449 | 11356.89 | 2274 | 2215 | 434.5 |
| B | 12 | 111 | 55819 | 123.38 | 2274 | 2215 | 434.5 |
| B | 11 | 111 | 50666 | 111.52 | 2274 | 2215 | 434.5 |
| C | 0 | 10 | 943614 | 1831.04 | 2196 | 2212 | 514.1 |
| C | 14 | 238 | 417886 | 808.49 | 2196 | 2212 | 514.1 |
| C | 3 | 233 | 203293 | 391.11 | 2196 | 2212 | 514.1 |
| D | 12 | 218 | 978474 | 1850.43 | 2219 | 2162 | 527.6 |
| D | 8 | 195 | 639401 | 1207.78 | 2219 | 2162 | 527.6 |
| D | 12 | 233 | 229413 | 430.71 | 2219 | 2162 | 527.6 |
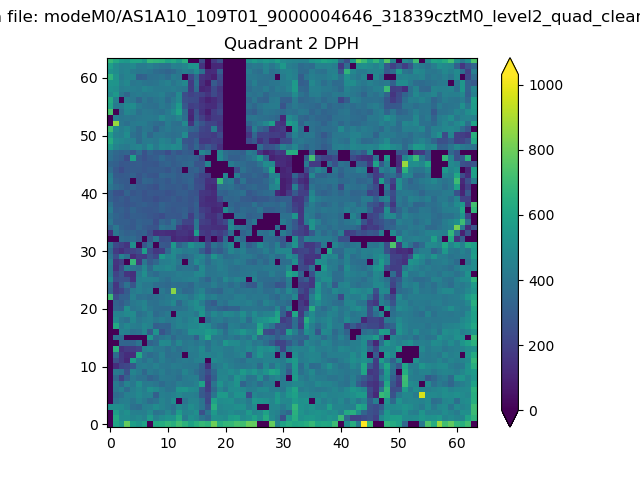
Histogram calculated using DETX and DETY for each event in the final _common_clean file
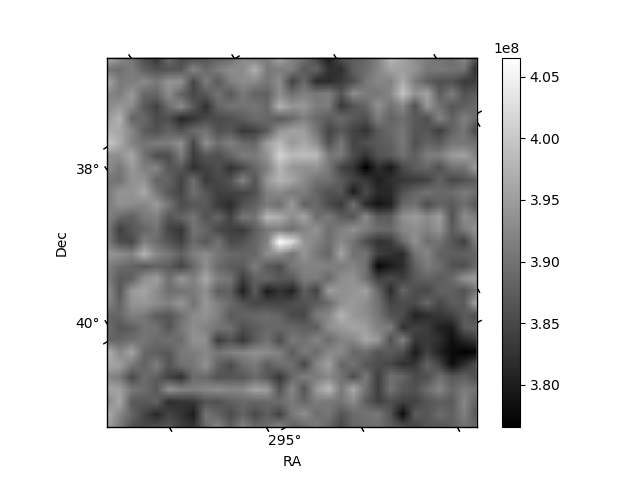
| Quadrant A | 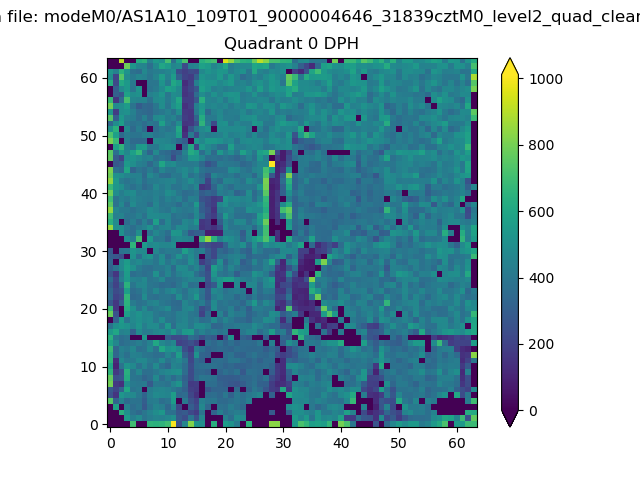 |
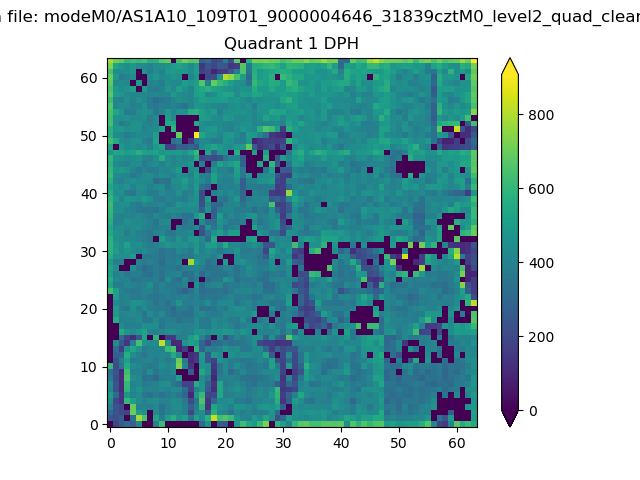 |
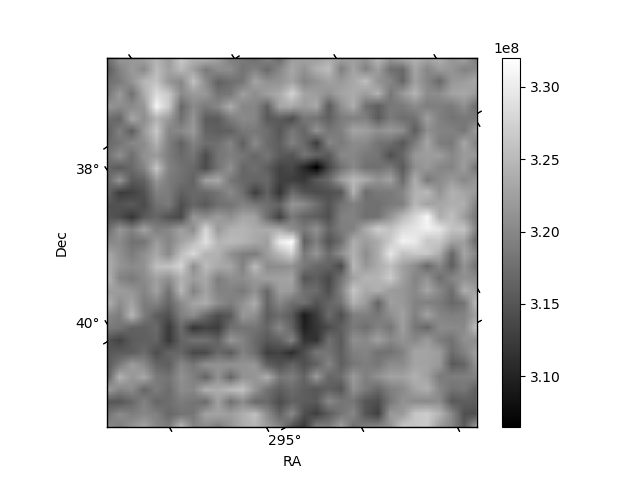
Quadrant B |
|---|---|---|---|
| Quadrant D | 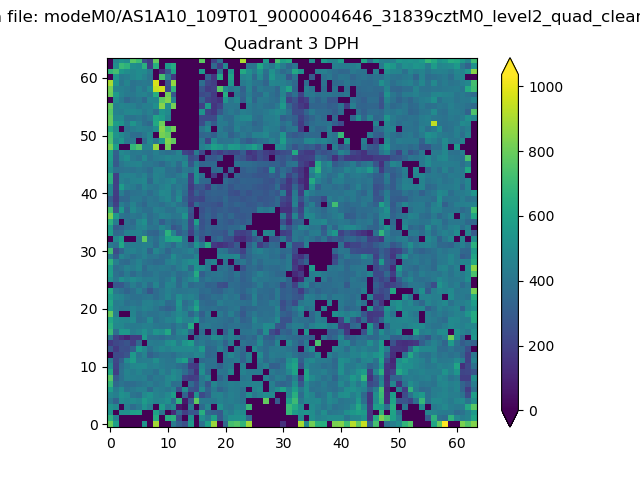 |
 |
Quadrant C |
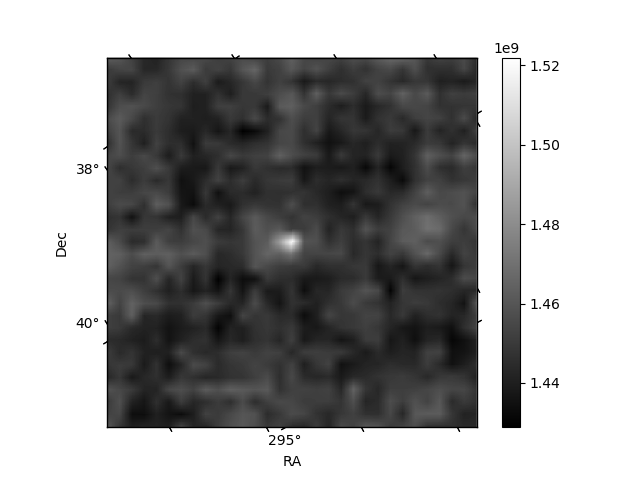
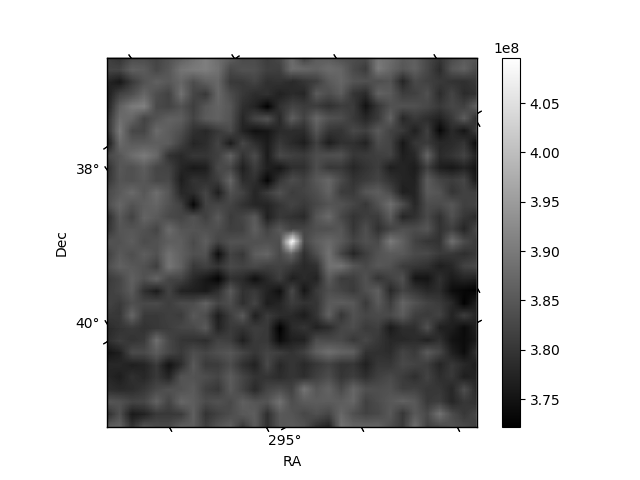
| Plot type | Count rate plots | Images |
|---|---|---|
| Comparison with Poisson distribution Blue bars denote a histogram of data divided into 1 sec bins. Red curve is a Poisson curve with rate = median count rate of data. |
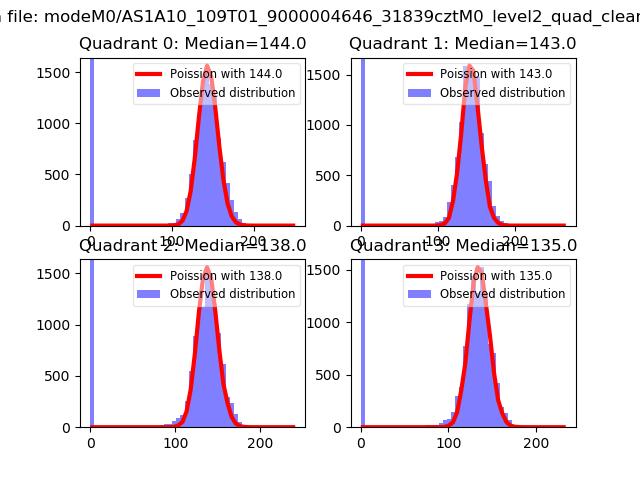 |
 |
| Quadrant-wise count rates Data is divided into 100 sec bins |
 |
|
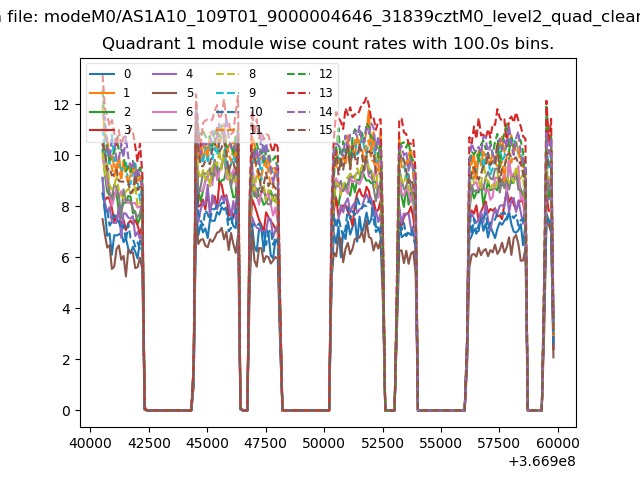
| Module-wise count rates for Quadrant A Data is divided into 100 sec bins |
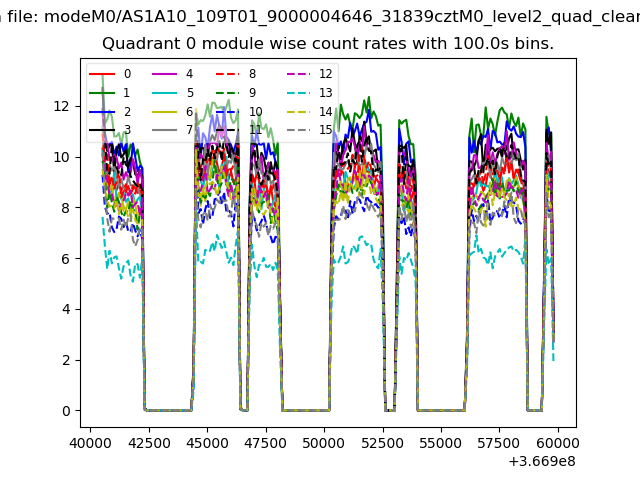 |
 |
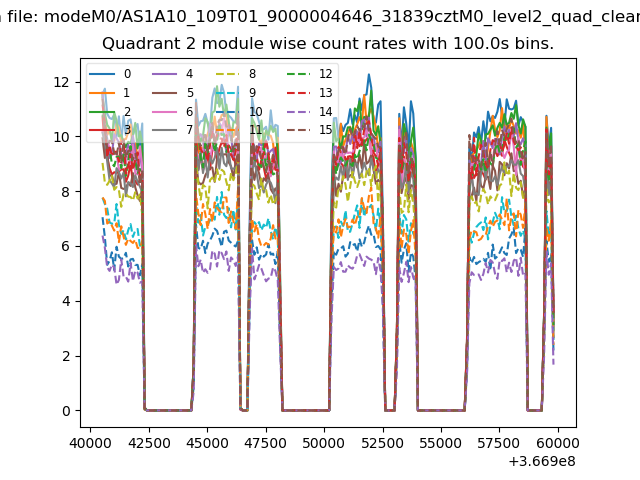
| Module-wise count rates for Quadrant B Data is divided into 100 sec bins |
 |
 |
| Module-wise count rates for Quadrant C Data is divided into 100 sec bins |
 |
 |
| Module-wise count rates for Quadrant D Data is divided into 100 sec bins |
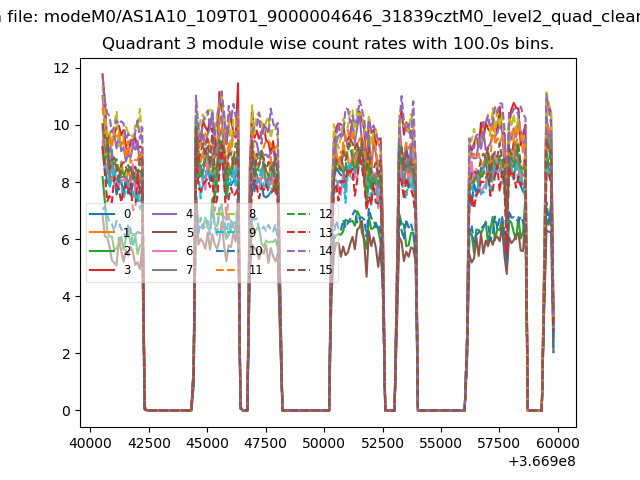 |
 |
| Parameter | Plot |
|---|---|
| CZT HV Monitor | 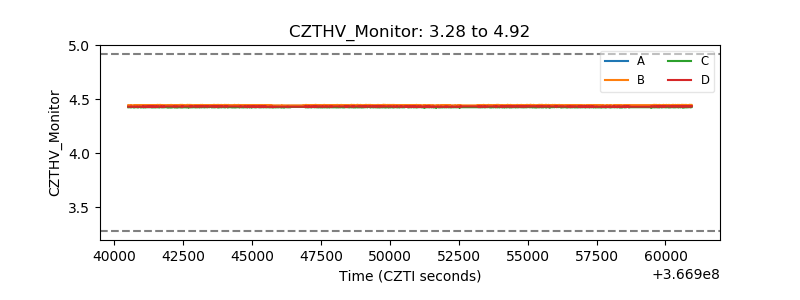 |
| D_VDD | 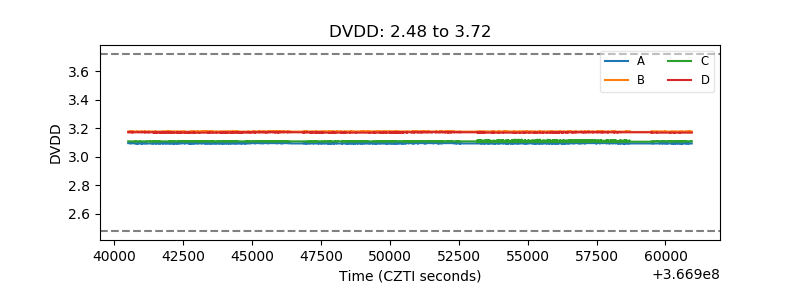 |
| Temperature 1 | 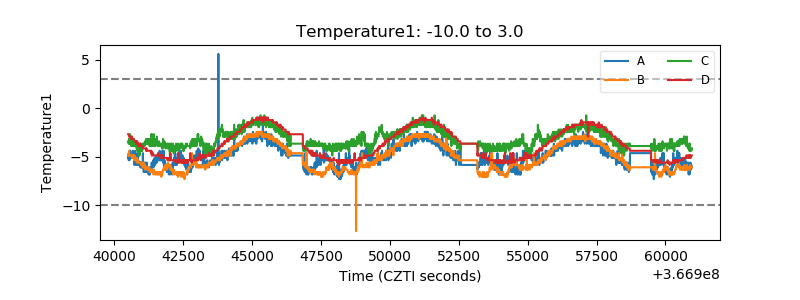 |
| Veto HV Monitor | 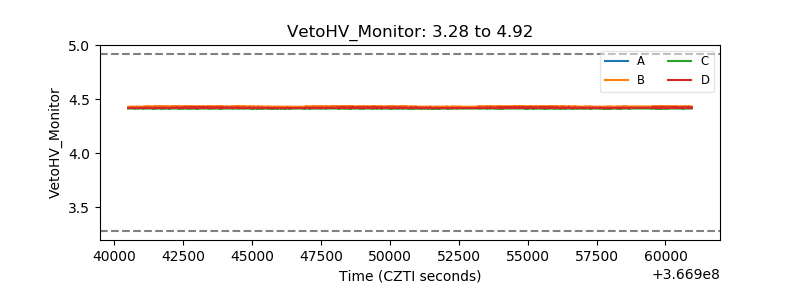 |
| Veto LLD | 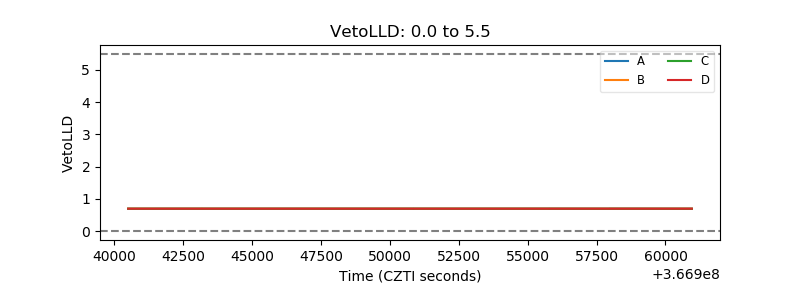 |
| Alpha Counter |  |
| _CPM_Rate | 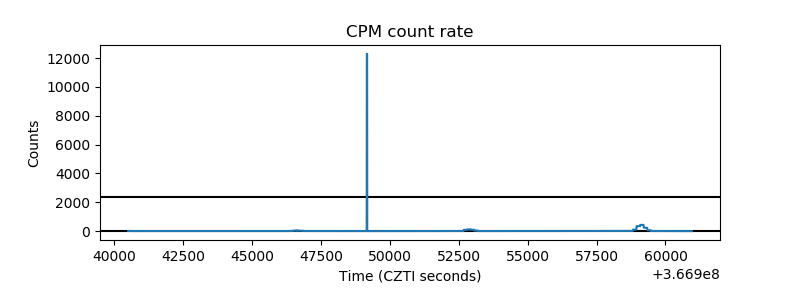 |
| CZT Counter | 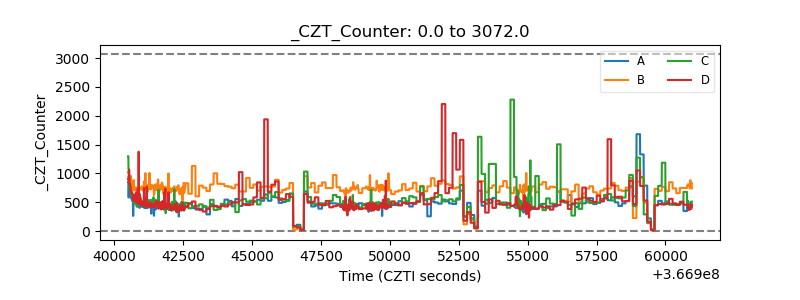 |
| +2.5 Volts monitor | 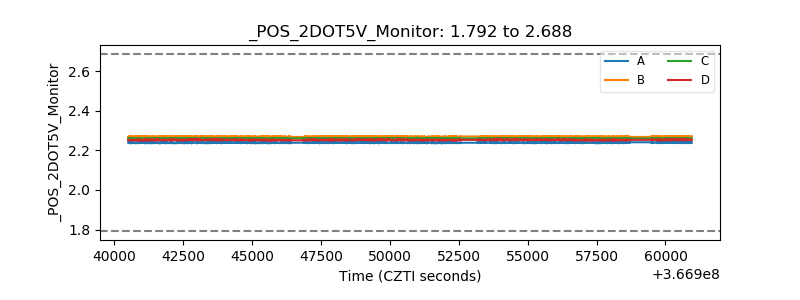 |
| +5 Volts monitor |  |
| _ROLL_ROT | 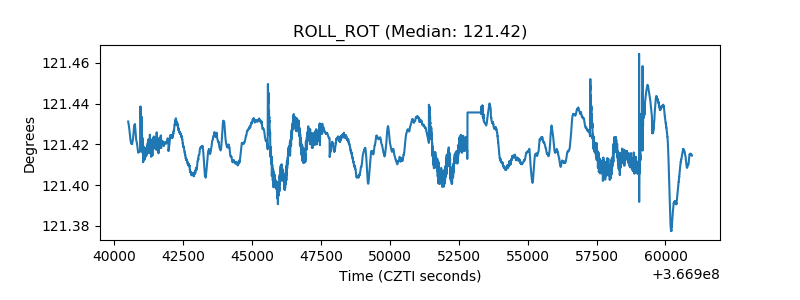 |
| _Roll_DEC | 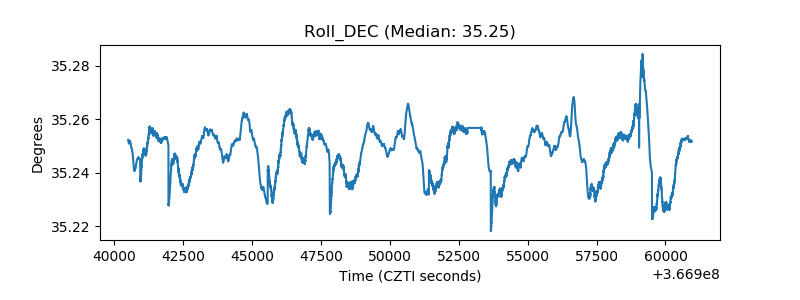 |
| _Roll_RA | 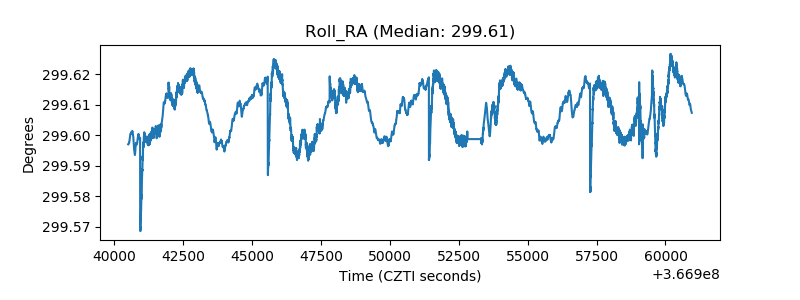 |
| Veto Counter | 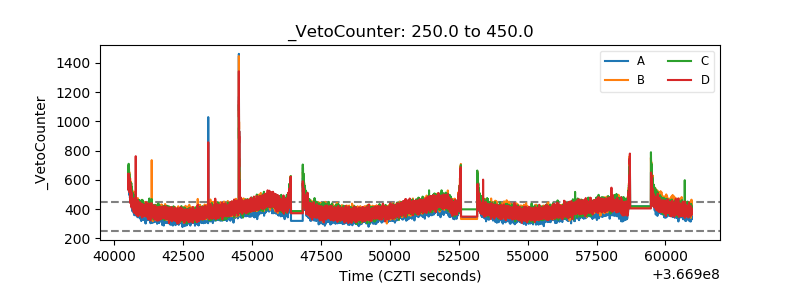 |