| Param | Original file | Final file |
|---|---|---|
| Filename | modeM0/AS1A10_109T01_9000004646_31840cztM0_level2.evt | modeM0/AS1A10_109T01_9000004646_31840cztM0_level2_quad_clean.evt |
| Size (bytes) | 571,642,560 | 79,853,760 |
| Size | 545.2 MB | 76.2 MB |
| Events in quadrant A | 3,421,000 | 503,986 |
| Events in quadrant B | 5,493,120 | 500,664 |
| Events in quadrant C | 3,908,812 | 467,690 |
| Events in quadrant D | 4,019,556 | 462,607 |
| Mode SS | |||
|---|---|---|---|
| Quadrant | BADHDUFLAG | Total packets | Discarded packets |
| A | 0 | 140 | 0 |
| B | 0 | 140 | 0 |
| C | 0 | 140 | 0 |
| D | 0 | 140 | 0 |
| Mode M0 | |||
|---|---|---|---|
| Quadrant | BADHDUFLAG | Total packets | Discarded packets |
| A | 0 | 14275 | 2 |
| B | 0 | 21547 | 2 |
| C | 0 | 15679 | 2 |
| D | 0 | 16265 | 2 |
| Mode M9 | |||
|---|---|---|---|
| Quadrant | BADHDUFLAG | Total packets | Discarded packets |
| A | 0 | 18 | 0 |
| B | 0 | 18 | 0 |
| C | 0 | 18 | 0 |
| D | 0 | 18 | 0 |
| Quadrant | Total seconds | Saturated seconds | Saturation percentage |
|---|---|---|---|
| A | 6941 | 69 | 0.994093% |
| B | 6941 | 159 | 2.290736% |
| C | 6941 | 517 | 7.448494% |
| D | 6941 | 220 | 3.169572% |
Noise dominated data is calculated using 1-second bins in cleaned event files. If a bin has >2000 counts, and if more than 50% of those come from <1% of pixels, then it is considered to be noise-dominated and hence unusable.
| Quadrant | # 1 sec bins | Bins with >0 counts | Bins with >2000 counts | High rate bins dominated by noise | Noise dominated (total time) | Noise dominated (detector-on time) | Marked lightcurve |
|---|---|---|---|---|---|---|---|
| A | 8656 | 6943 | 0 | 0 | 0.00% | 0.00% | 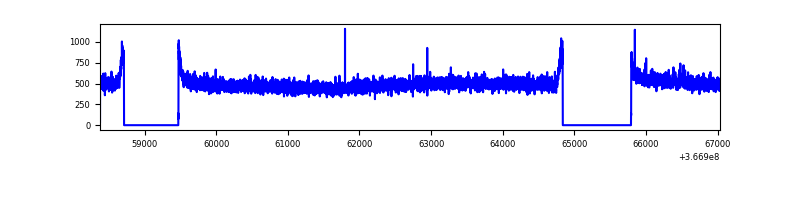 |
| B | 8656 | 6943 | 21 | 21 | 0.24% | 0.30% | 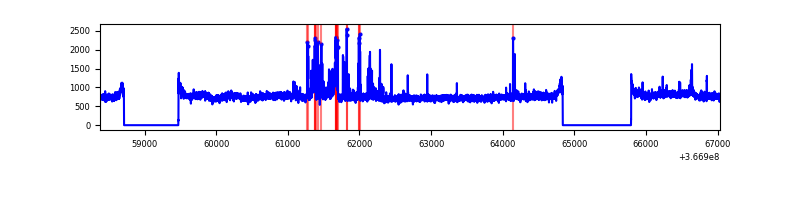 |
| C | 8656 | 6943 | 29 | 29 | 0.34% | 0.42% | 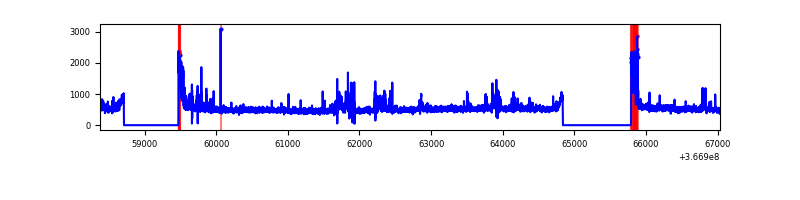 |
| D | 8656 | 6943 | 166 | 166 | 1.92% | 2.39% | 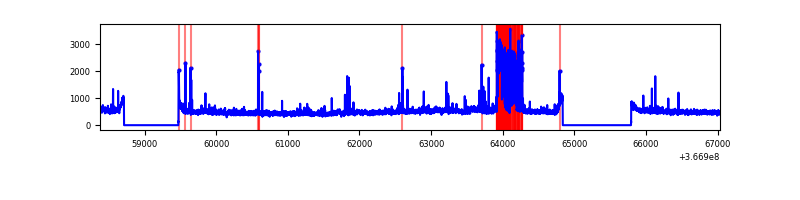 |
Top three noisy pixels from each quadrant. If the there are fewer than three noisy pixels in the level2.evt file, extra rows are filled as -1
| Pixel properties | Quadrant properties | ||||||
|---|---|---|---|---|---|---|---|
| Quadrant | DetID | PixID | Counts | Sigma | Mean | Median | Sigma |
| A | 13 | 254 | 12418 | 65.27 | 883 | 868 | 176.9 |
| A | 13 | 6 | 12183 | 63.95 | 883 | 868 | 176.9 |
| A | 3 | 137 | 9196 | 47.07 | 883 | 868 | 176.9 |
| B | 6 | 159 | 1813426 | 10767.35 | 869 | 847 | 168.3 |
| B | 10 | 245 | 241971 | 1432.36 | 869 | 847 | 168.3 |
| B | 12 | 111 | 21253 | 121.22 | 869 | 847 | 168.3 |
| C | 14 | 238 | 244377 | 1260.55 | 822 | 828 | 193.2 |
| C | 0 | 10 | 215124 | 1109.14 | 822 | 828 | 193.2 |
| C | 14 | 254 | 145366 | 748.09 | 822 | 828 | 193.2 |
| D | 12 | 218 | 499815 | 2493.74 | 841 | 818 | 200.1 |
| D | 8 | 195 | 218392 | 1087.33 | 841 | 818 | 200.1 |
| D | 2 | 250 | 80575 | 398.59 | 841 | 818 | 200.1 |
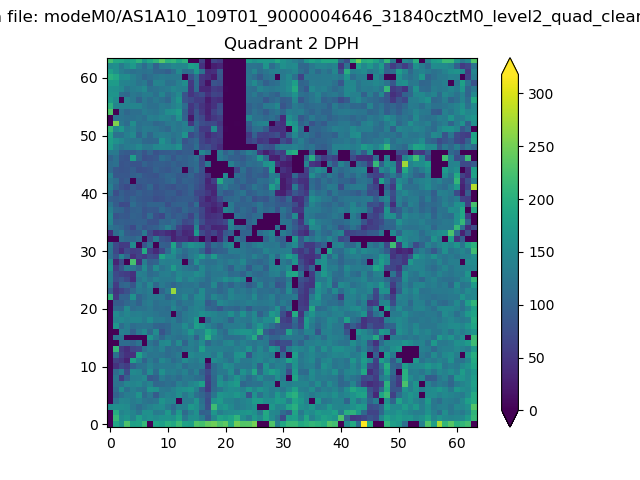
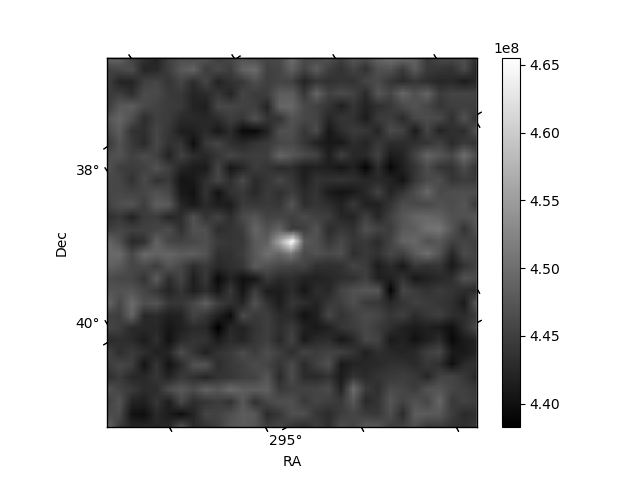
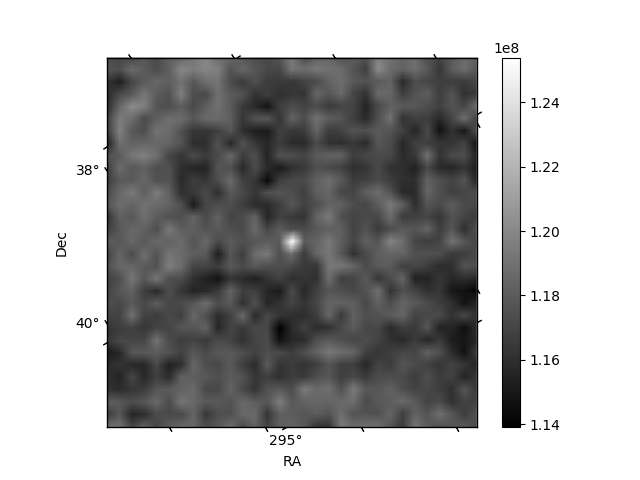
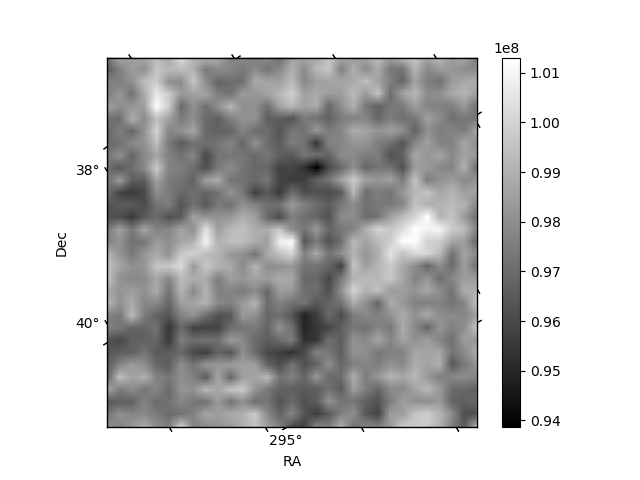
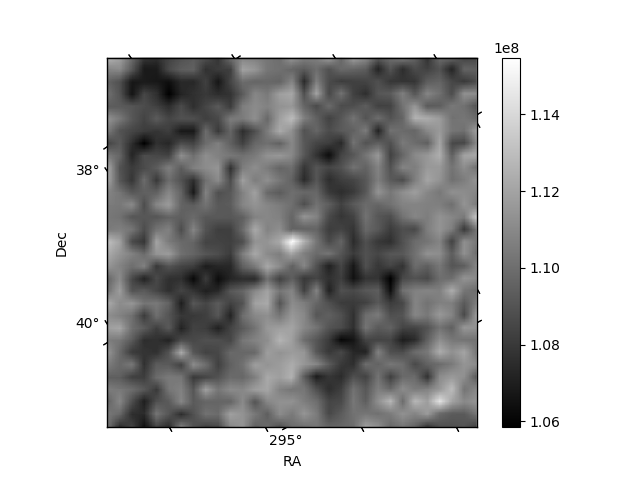
Histogram calculated using DETX and DETY for each event in the final _common_clean file
| Quadrant A | 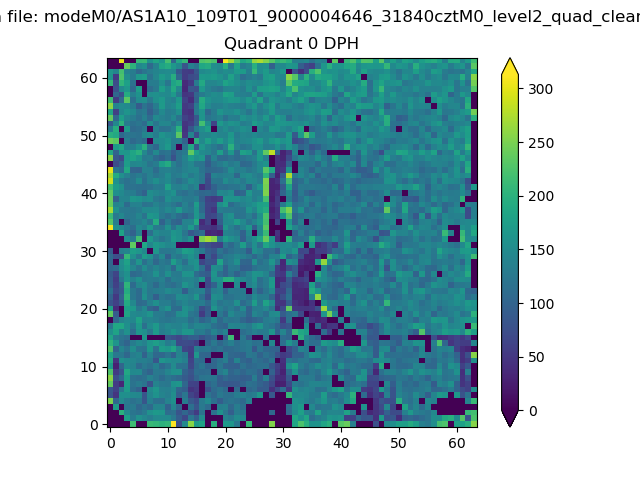 |
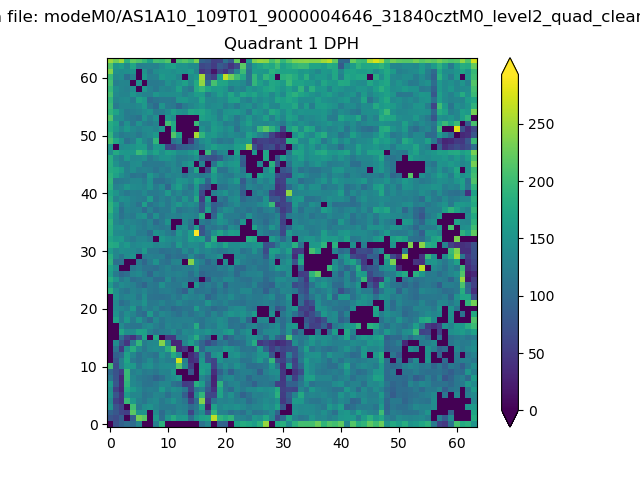 |
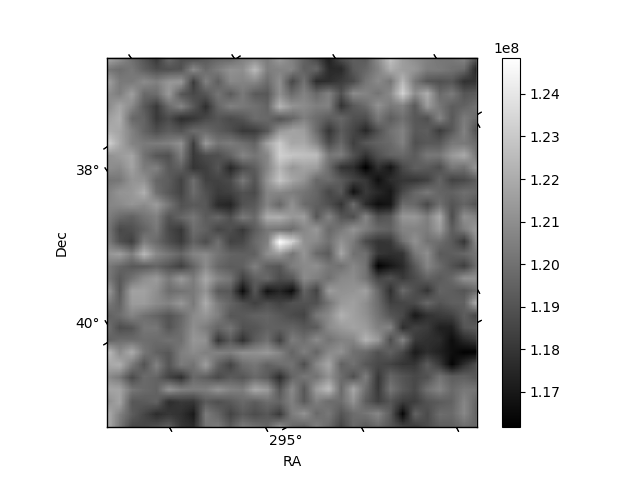
Quadrant B |
|---|---|---|---|
| Quadrant D | 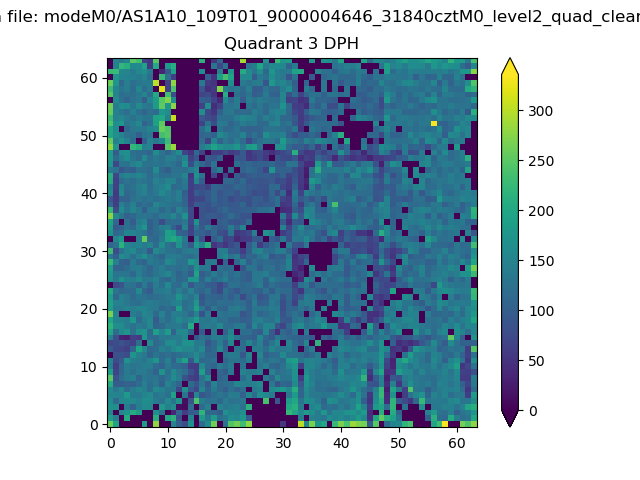 |
 |
Quadrant C |
| Plot type | Count rate plots | Images |
|---|---|---|
| Comparison with Poisson distribution Blue bars denote a histogram of data divided into 1 sec bins. Red curve is a Poisson curve with rate = median count rate of data. |
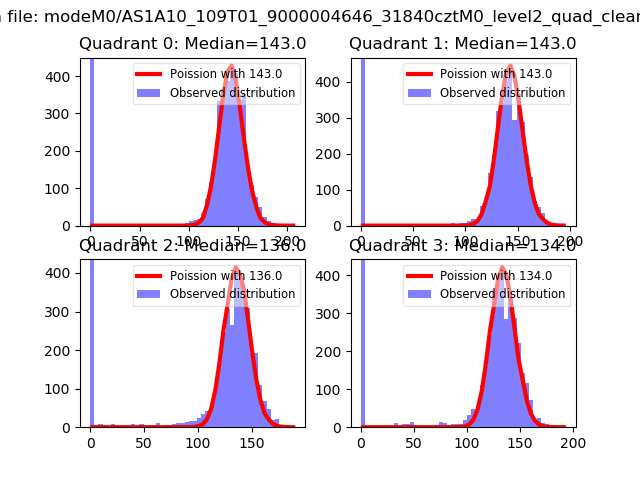 |
 |
| Quadrant-wise count rates Data is divided into 100 sec bins |
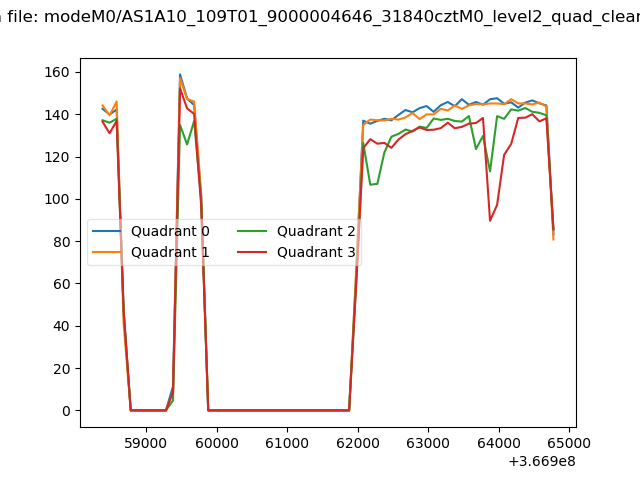 |
|
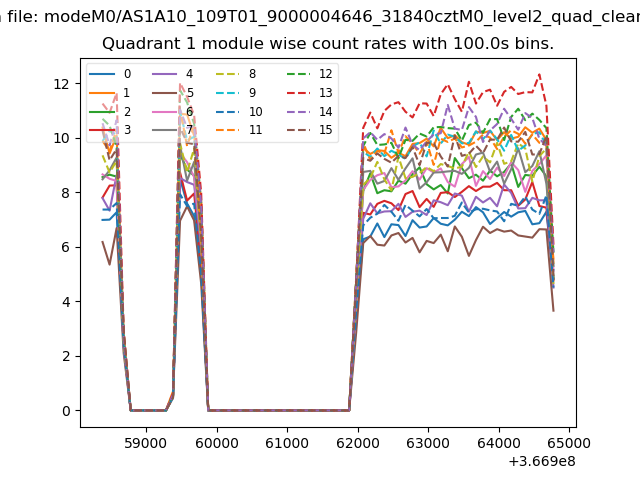
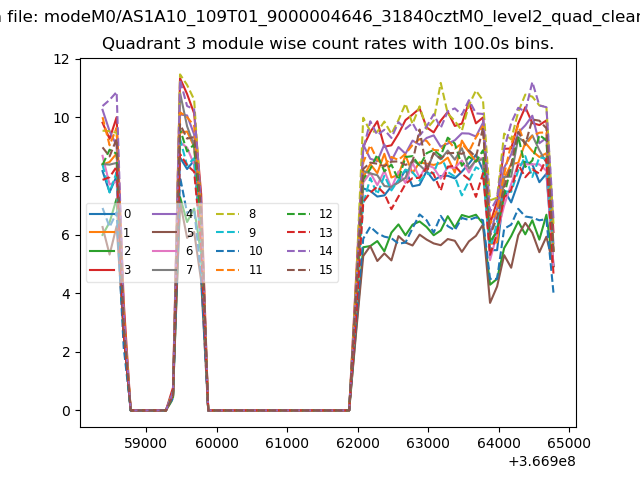
| Module-wise count rates for Quadrant A Data is divided into 100 sec bins |
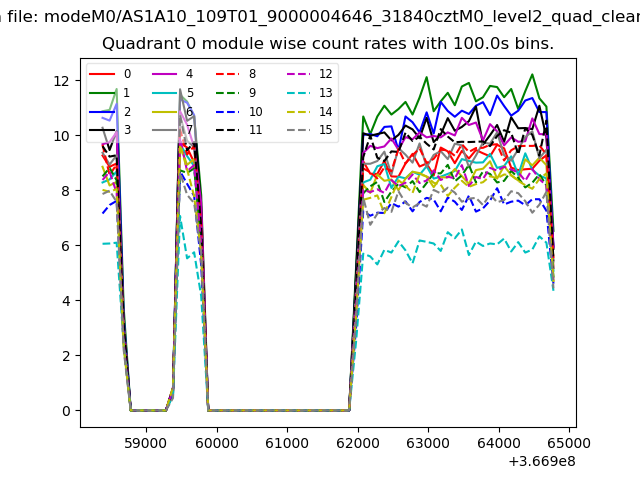 |
 |
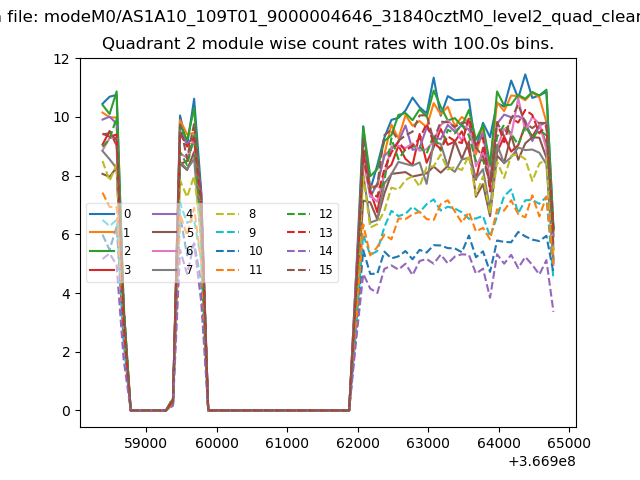
| Module-wise count rates for Quadrant B Data is divided into 100 sec bins |
 |
 |
| Module-wise count rates for Quadrant C Data is divided into 100 sec bins |
 |
 |
| Module-wise count rates for Quadrant D Data is divided into 100 sec bins |
 |
 |
| Parameter | Plot |
|---|---|
| CZT HV Monitor | 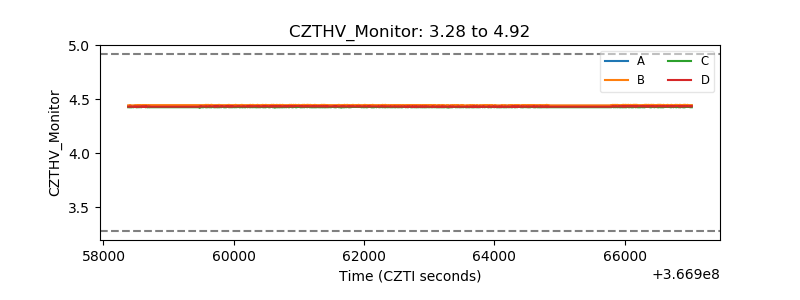 |
| D_VDD | 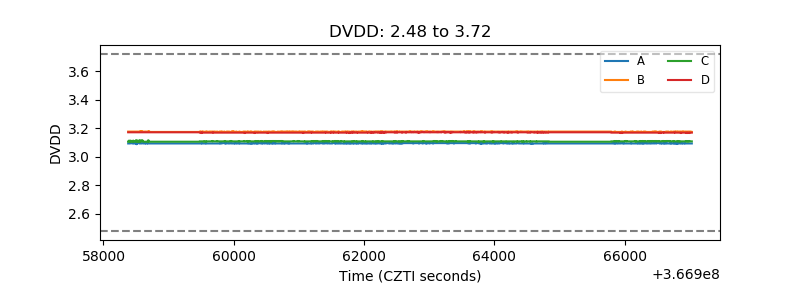 |
| Temperature 1 | 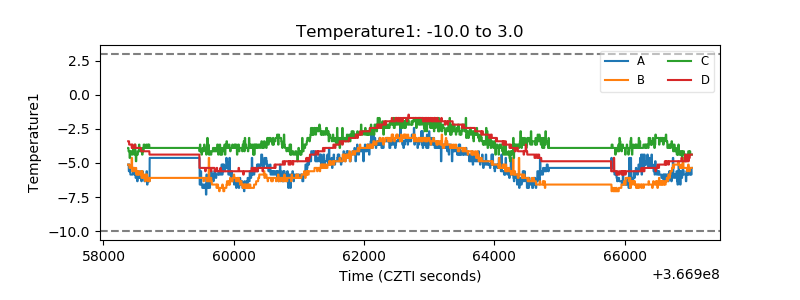 |
| Veto HV Monitor | 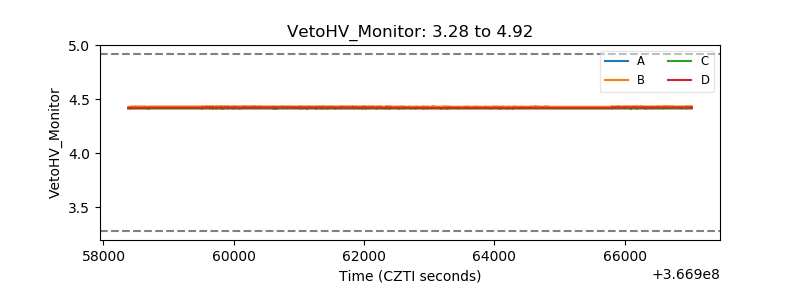 |
| Veto LLD | 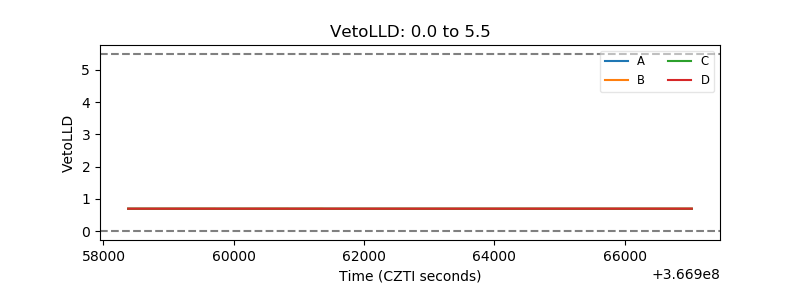 |
| Alpha Counter | 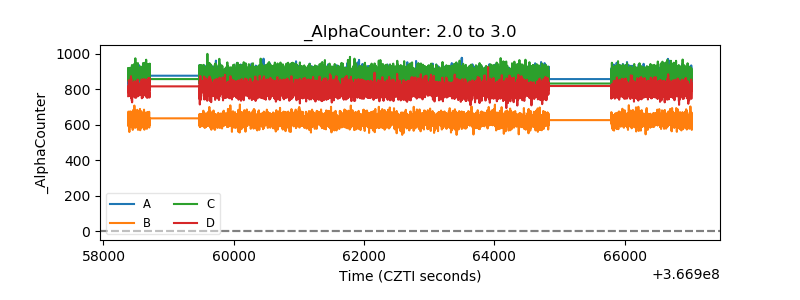 |
| _CPM_Rate | 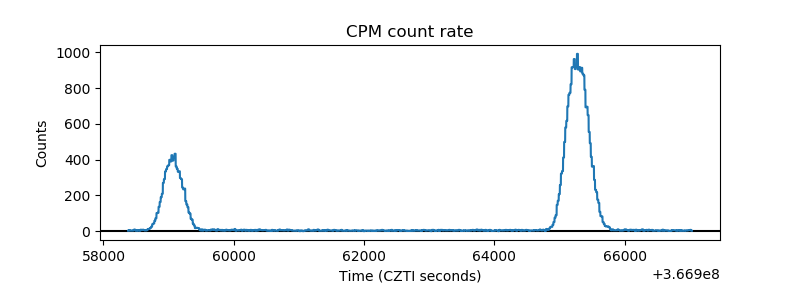 |
| CZT Counter | 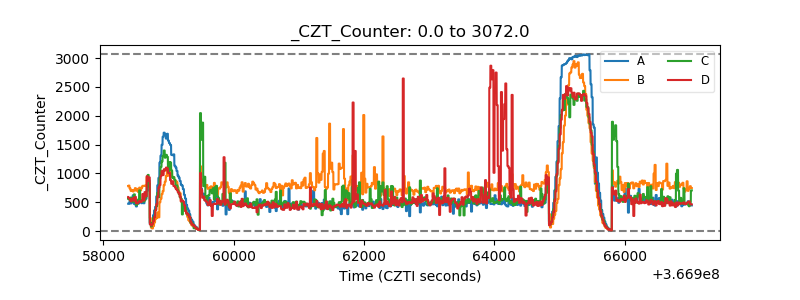 |
| +2.5 Volts monitor |  |
| +5 Volts monitor | 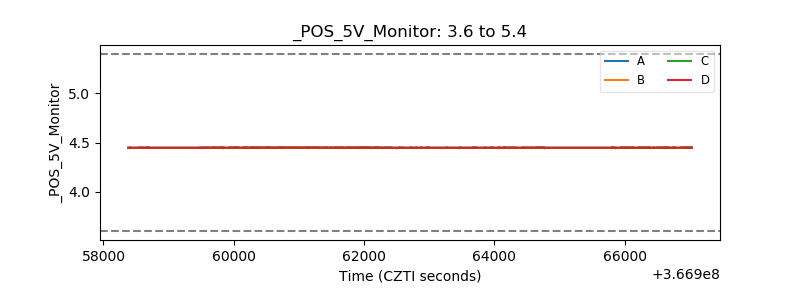 |
| _ROLL_ROT | 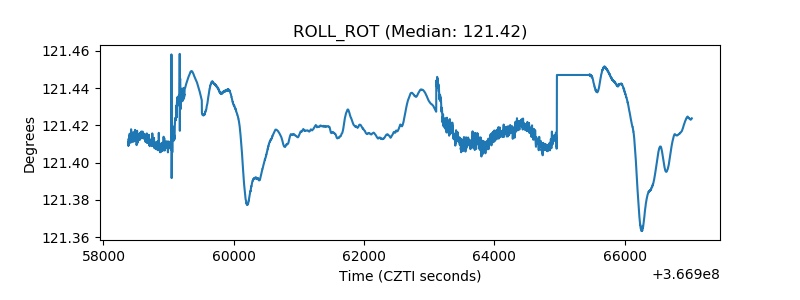 |
| _Roll_DEC | 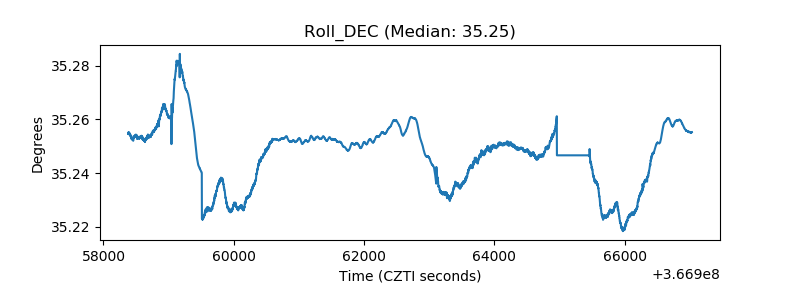 |
| _Roll_RA | 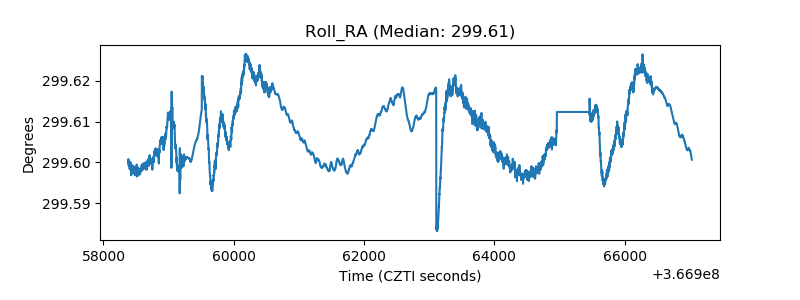 |
| Veto Counter |  |