| Param | Original file | Final file |
|---|---|---|
| Filename | modeM0/AS1A10_109T01_9000004646_31842cztM0_level2.evt | modeM0/AS1A10_109T01_9000004646_31842cztM0_level2_quad_clean.evt |
| Size (bytes) | 526,078,080 | 72,725,760 |
| Size | 501.7 MB | 69.4 MB |
| Events in quadrant A | 3,314,200 | 452,946 |
| Events in quadrant B | 5,046,693 | 448,751 |
| Events in quadrant C | 3,685,559 | 428,770 |
| Events in quadrant D | 3,449,877 | 422,720 |
| Mode SS | |||
|---|---|---|---|
| Quadrant | BADHDUFLAG | Total packets | Discarded packets |
| A | 0 | 130 | 0 |
| B | 0 | 130 | 0 |
| C | 0 | 130 | 0 |
| D | 0 | 130 | 0 |
| Mode M0 | |||
|---|---|---|---|
| Quadrant | BADHDUFLAG | Total packets | Discarded packets |
| A | 0 | 13673 | 2 |
| B | 0 | 19647 | 2 |
| C | 0 | 14739 | 2 |
| D | 0 | 13956 | 2 |
| Mode M9 | |||
|---|---|---|---|
| Quadrant | BADHDUFLAG | Total packets | Discarded packets |
| A | 0 | 13 | 0 |
| B | 0 | 14 | 0 |
| C | 0 | 14 | 0 |
| D | 0 | 14 | 0 |
| Quadrant | Total seconds | Saturated seconds | Saturation percentage |
|---|---|---|---|
| A | 6437 | 49 | 0.761224% |
| B | 6437 | 103 | 1.600124% |
| C | 6437 | 209 | 3.246854% |
| D | 6437 | 47 | 0.730154% |
Noise dominated data is calculated using 1-second bins in cleaned event files. If a bin has >2000 counts, and if more than 50% of those come from <1% of pixels, then it is considered to be noise-dominated and hence unusable.
| Quadrant | # 1 sec bins | Bins with >0 counts | Bins with >2000 counts | High rate bins dominated by noise | Noise dominated (total time) | Noise dominated (detector-on time) | Marked lightcurve |
|---|---|---|---|---|---|---|---|
| A | 7512 | 6438 | 0 | 0 | 0.00% | 0.00% | 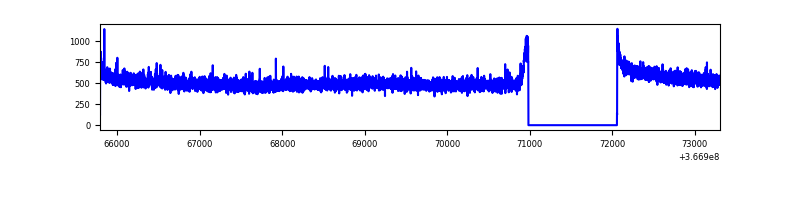 |
| B | 7512 | 6438 | 1 | 1 | 0.01% | 0.02% | 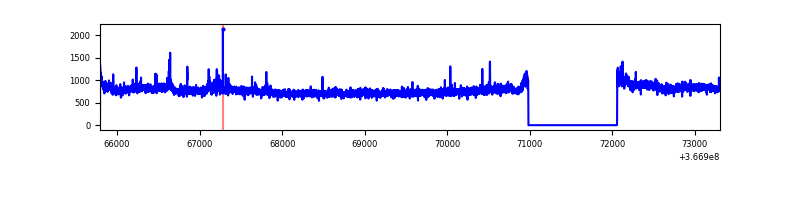 |
| C | 7512 | 6438 | 54 | 54 | 0.72% | 0.84% | 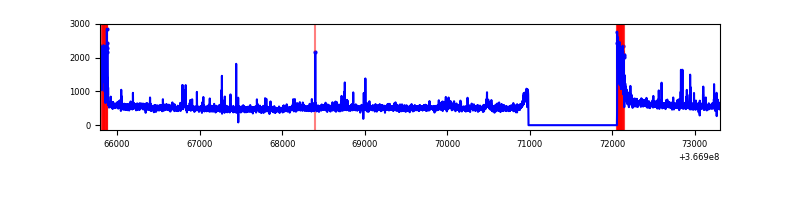 |
| D | 7512 | 6438 | 13 | 13 | 0.17% | 0.20% | 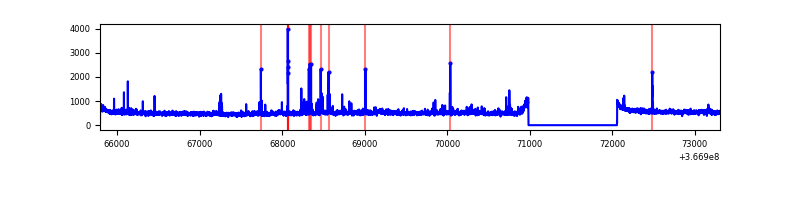 |
Top three noisy pixels from each quadrant. If the there are fewer than three noisy pixels in the level2.evt file, extra rows are filled as -1
| Pixel properties | Quadrant properties | ||||||
|---|---|---|---|---|---|---|---|
| Quadrant | DetID | PixID | Counts | Sigma | Mean | Median | Sigma |
| A | 13 | 254 | 10379 | 56.29 | 858 | 844 | 169.4 |
| A | 3 | 137 | 8578 | 45.66 | 858 | 844 | 169.4 |
| A | 0 | 226 | 7037 | 36.56 | 858 | 844 | 169.4 |
| B | 6 | 159 | 1691025 | 10566.56 | 840 | 819 | 160.0 |
| B | 10 | 245 | 46729 | 287.01 | 840 | 819 | 160.0 |
| B | 12 | 111 | 20082 | 120.42 | 840 | 819 | 160.0 |
| C | 0 | 10 | 297811 | 1593.32 | 800 | 807 | 186.4 |
| C | 14 | 238 | 145904 | 778.39 | 800 | 807 | 186.4 |
| C | 3 | 233 | 53832 | 284.46 | 800 | 807 | 186.4 |
| D | 8 | 195 | 210513 | 1077.19 | 819 | 799 | 194.7 |
| D | 2 | 250 | 75074 | 381.51 | 819 | 799 | 194.7 |
| D | 12 | 233 | 37362 | 187.81 | 819 | 799 | 194.7 |
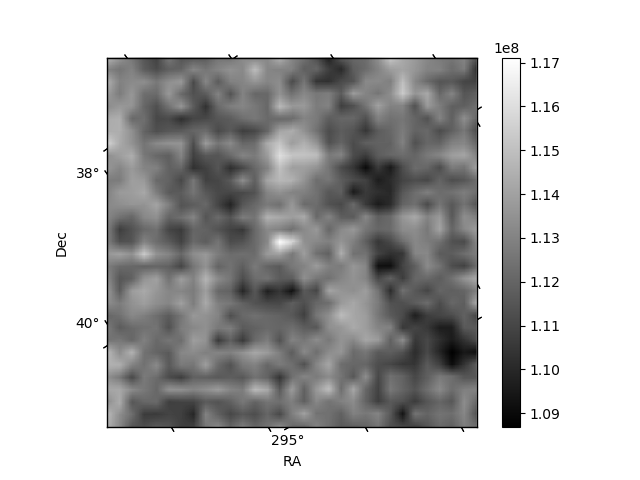
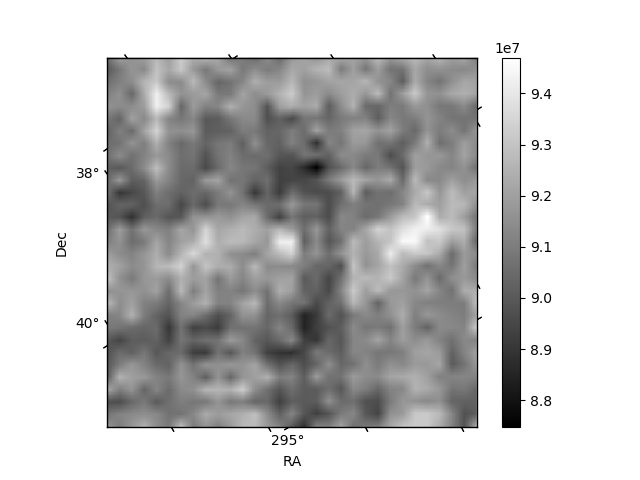
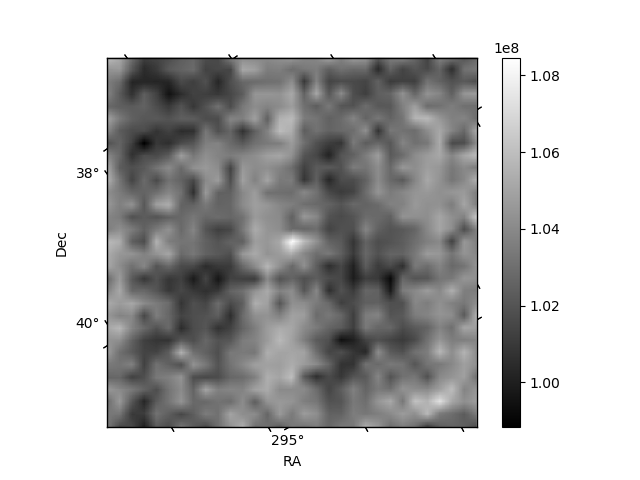
Histogram calculated using DETX and DETY for each event in the final _common_clean file
| Quadrant A | 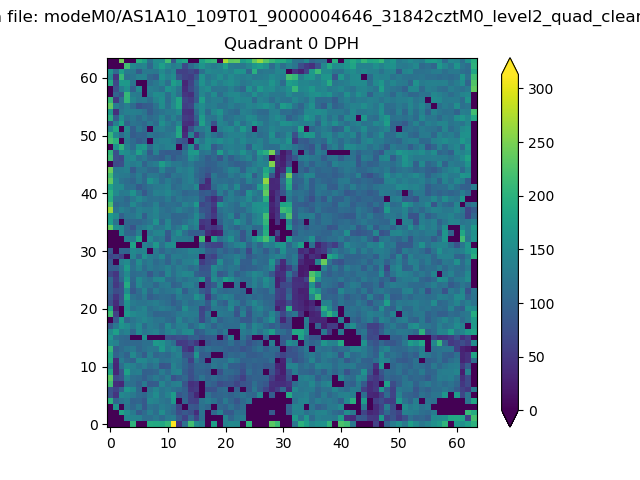 |
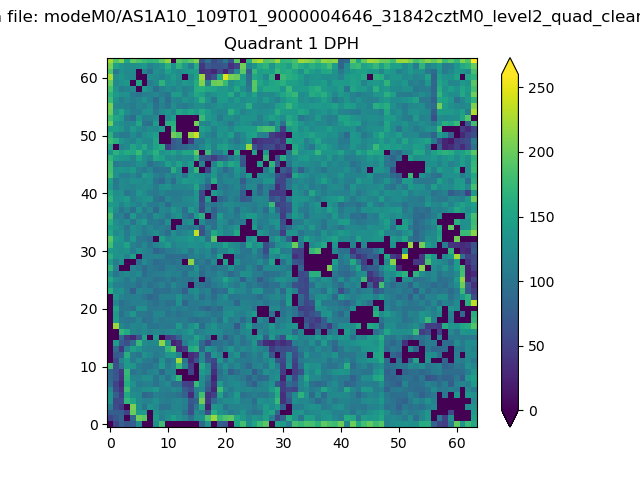 |
Quadrant B |
|---|---|---|---|
| Quadrant D |  |
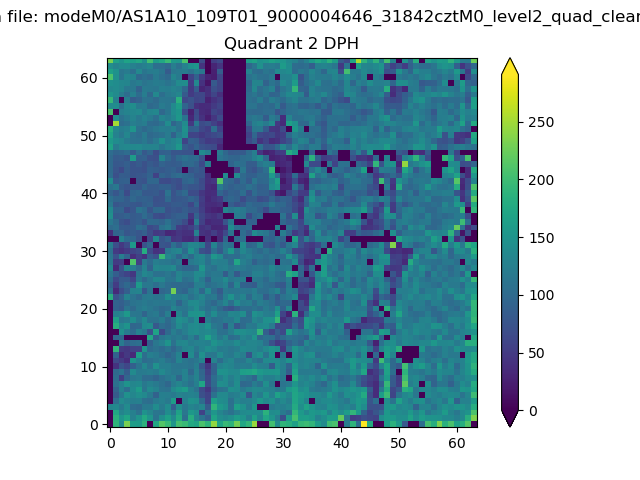 |
Quadrant C |
| Plot type | Count rate plots | Images |
|---|---|---|
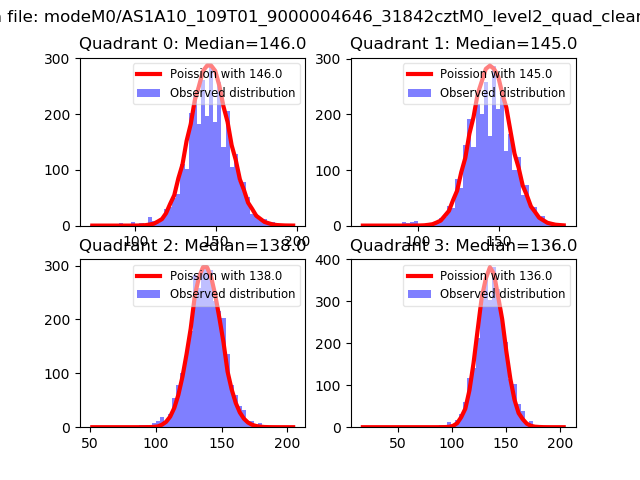
| Comparison with Poisson distribution Blue bars denote a histogram of data divided into 1 sec bins. Red curve is a Poisson curve with rate = median count rate of data. |
 |
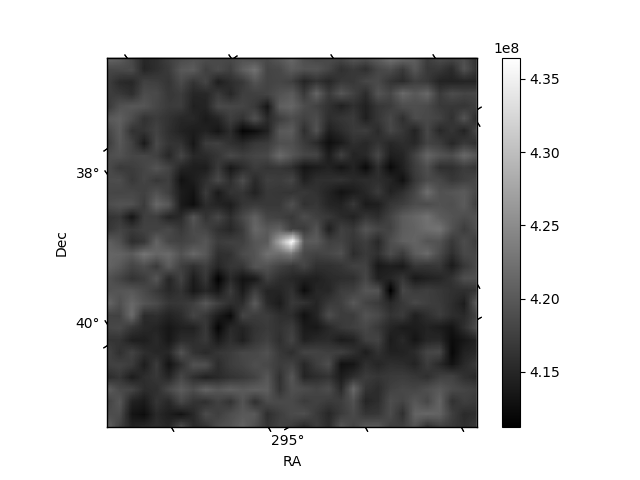 |
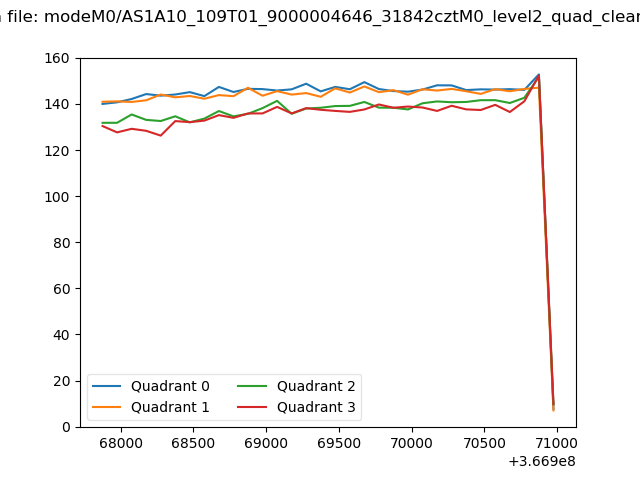
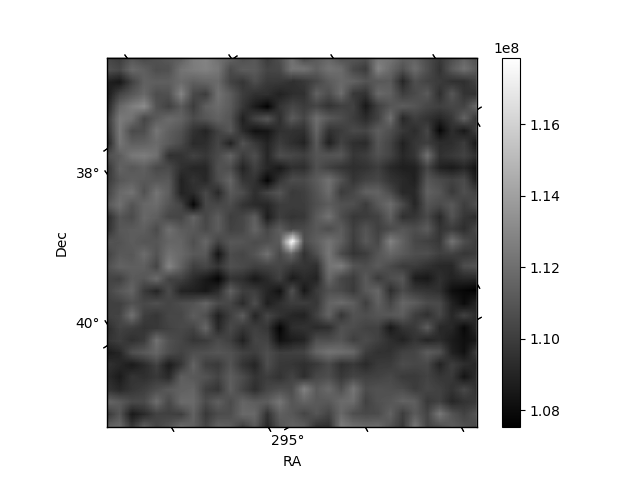
| Quadrant-wise count rates Data is divided into 100 sec bins |
 |
|
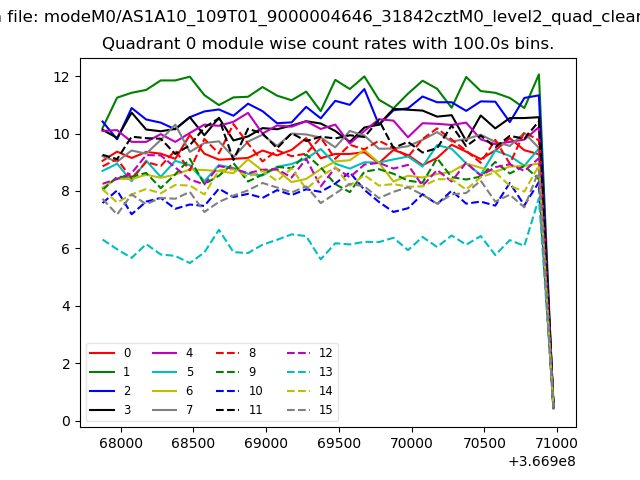
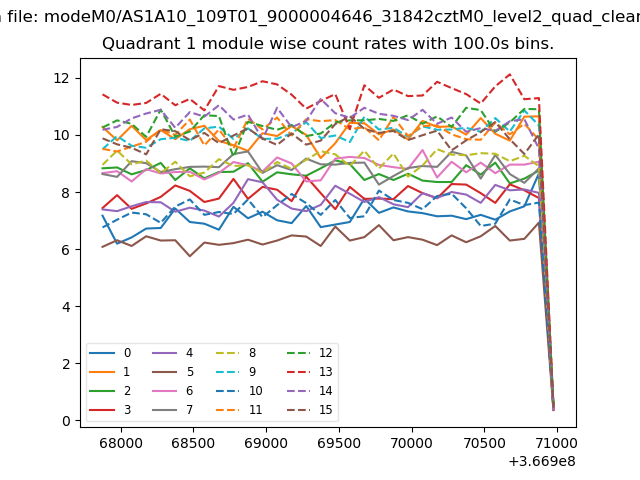
| Module-wise count rates for Quadrant A Data is divided into 100 sec bins |
 |
 |
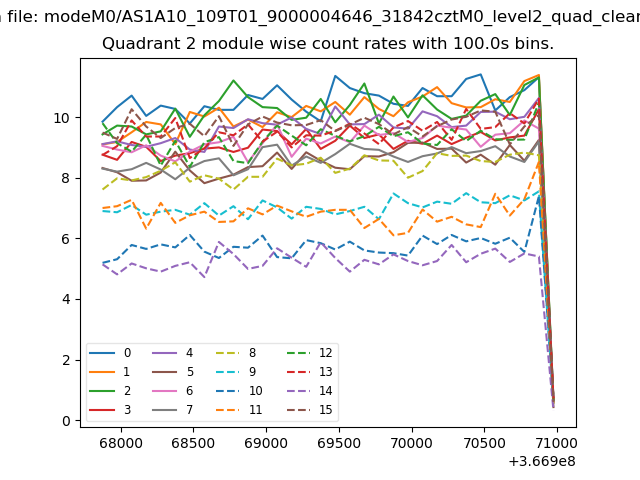
| Module-wise count rates for Quadrant B Data is divided into 100 sec bins |
 |
 |
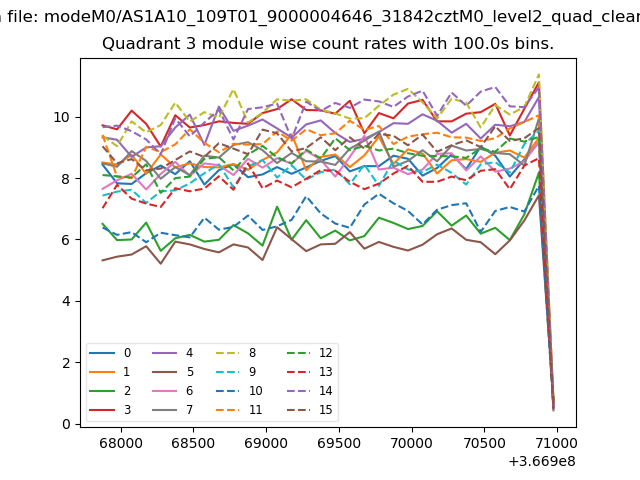
| Module-wise count rates for Quadrant C Data is divided into 100 sec bins |
 |
 |
| Module-wise count rates for Quadrant D Data is divided into 100 sec bins |
 |
 |
| Parameter | Plot |
|---|---|
| CZT HV Monitor | 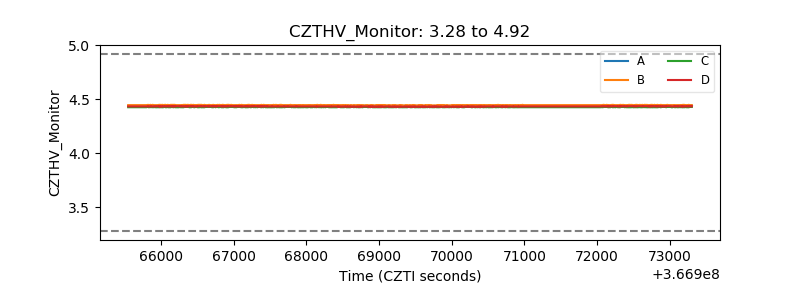 |
| D_VDD | 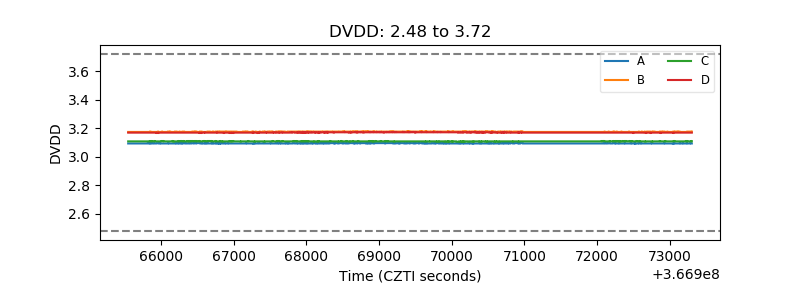 |
| Temperature 1 | 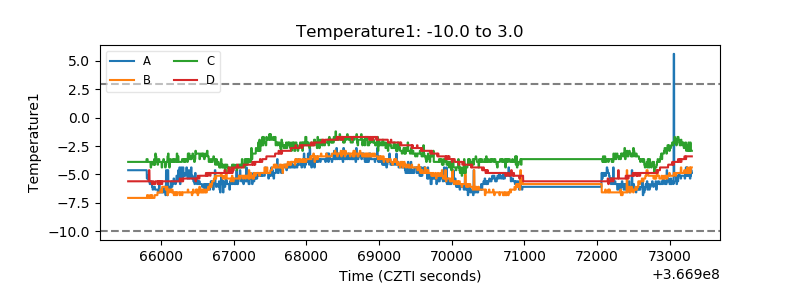 |
| Veto HV Monitor |  |
| Veto LLD | 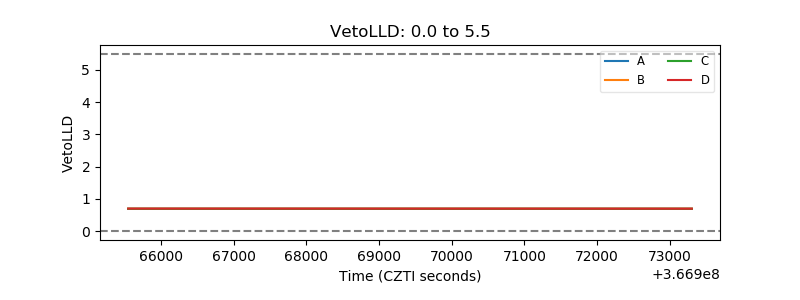 |
| Alpha Counter | 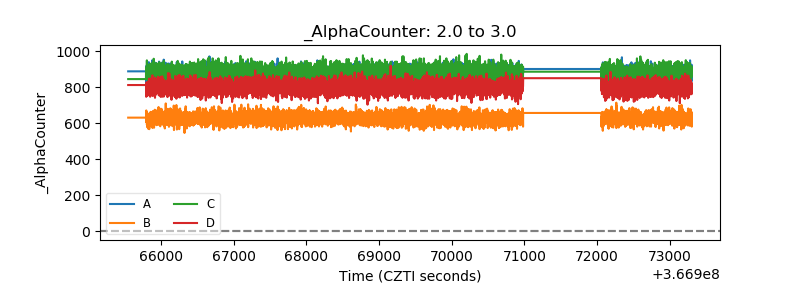 |
| _CPM_Rate | 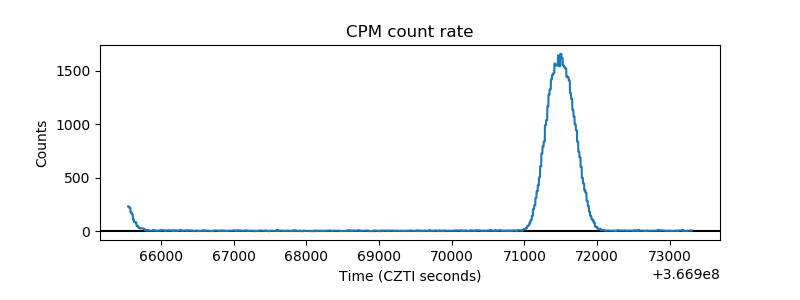 |
| CZT Counter | 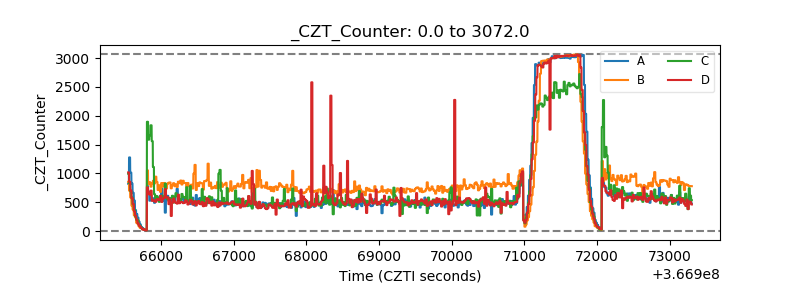 |
| +2.5 Volts monitor |  |
| +5 Volts monitor |  |
| _ROLL_ROT | 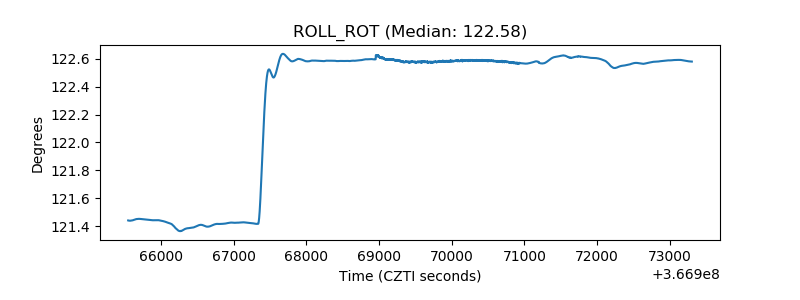 |
| _Roll_DEC | 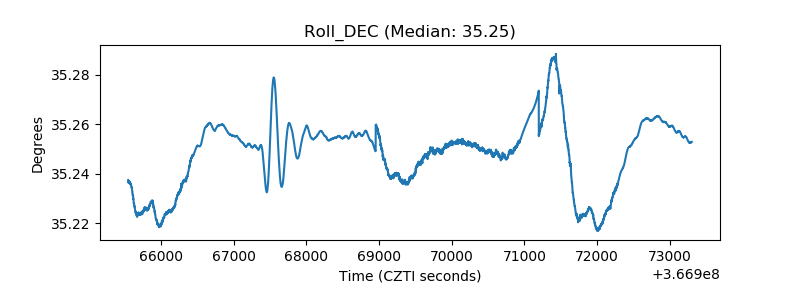 |
| _Roll_RA | 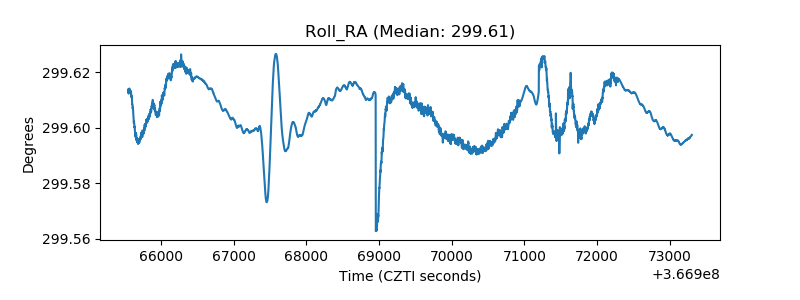 |
| Veto Counter | 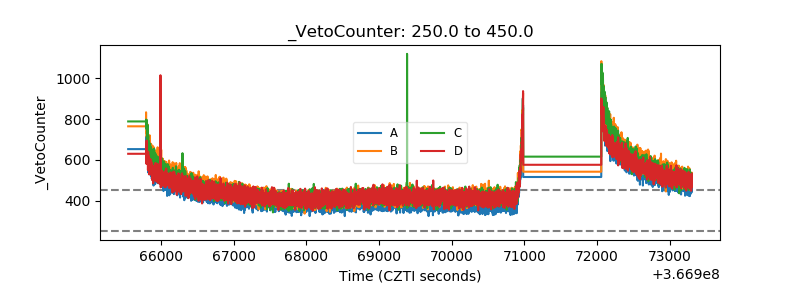 |