| Param | Original file | Final file |
|---|---|---|
| Filename | modeM0/AS1A10_109T01_9000004646_31844cztM0_level2.evt | modeM0/AS1A10_109T01_9000004646_31844cztM0_level2_quad_clean.evt |
| Size (bytes) | 611,792,640 | 115,352,640 |
| Size | 583.5 MB | 110.0 MB |
| Events in quadrant A | 3,959,836 | 784,161 |
| Events in quadrant B | 5,668,846 | 774,001 |
| Events in quadrant C | 4,387,267 | 735,328 |
| Events in quadrant D | 4,050,899 | 725,016 |
| Mode SS | |||
|---|---|---|---|
| Quadrant | BADHDUFLAG | Total packets | Discarded packets |
| A | 0 | 142 | 0 |
| B | 0 | 142 | 0 |
| C | 0 | 142 | 0 |
| D | 0 | 142 | 0 |
| Mode M0 | |||
|---|---|---|---|
| Quadrant | BADHDUFLAG | Total packets | Discarded packets |
| A | 0 | 16208 | 2 |
| B | 0 | 21505 | 2 |
| C | 0 | 17562 | 2 |
| D | 0 | 16390 | 2 |
| Mode M9 | |||
|---|---|---|---|
| Quadrant | BADHDUFLAG | Total packets | Discarded packets |
| A | 0 | 24 | 0 |
| B | 0 | 24 | 0 |
| C | 0 | 24 | 0 |
| D | 0 | 24 | 0 |
| Quadrant | Total seconds | Saturated seconds | Saturation percentage |
|---|---|---|---|
| A | 6814 | 166 | 2.436161% |
| B | 6815 | 249 | 3.653705% |
| C | 6815 | 395 | 5.796038% |
| D | 6815 | 122 | 1.790169% |
Noise dominated data is calculated using 1-second bins in cleaned event files. If a bin has >2000 counts, and if more than 50% of those come from <1% of pixels, then it is considered to be noise-dominated and hence unusable.
| Quadrant | # 1 sec bins | Bins with >0 counts | Bins with >2000 counts | High rate bins dominated by noise | Noise dominated (total time) | Noise dominated (detector-on time) | Marked lightcurve |
|---|---|---|---|---|---|---|---|
| A | 9274 | 6816 | 0 | 0 | 0.00% | 0.00% | 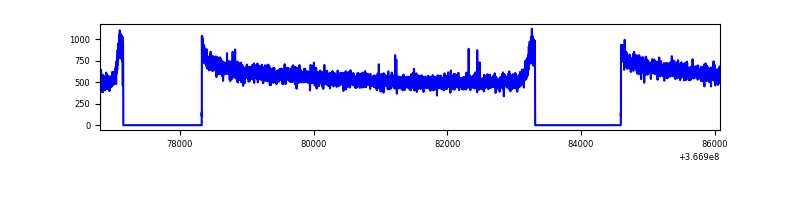 |
| B | 9275 | 6817 | 1 | 1 | 0.01% | 0.01% | 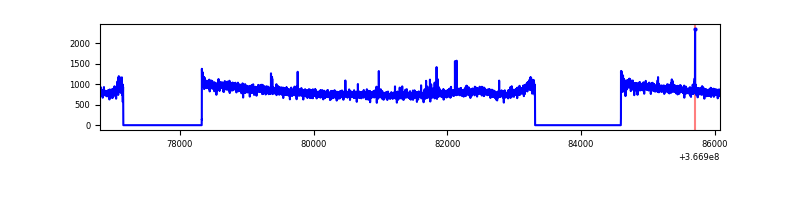 |
| C | 9275 | 6817 | 79 | 79 | 0.85% | 1.16% | 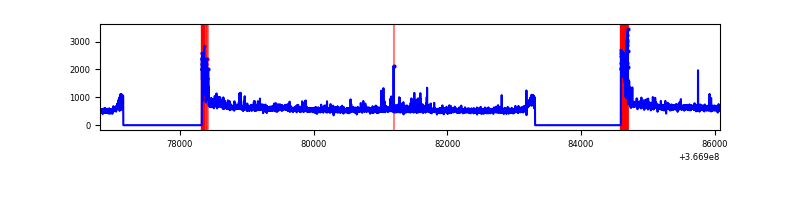 |
| D | 9275 | 6817 | 9 | 9 | 0.10% | 0.13% | 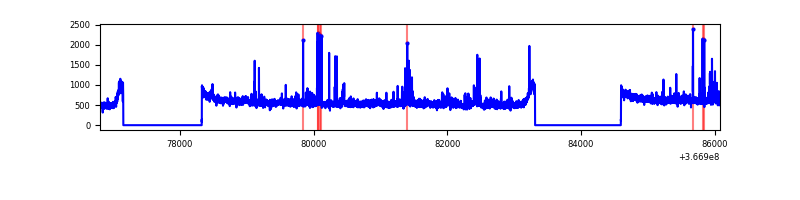 |
Top three noisy pixels from each quadrant. If the there are fewer than three noisy pixels in the level2.evt file, extra rows are filled as -1
| Pixel properties | Quadrant properties | ||||||
|---|---|---|---|---|---|---|---|
| Quadrant | DetID | PixID | Counts | Sigma | Mean | Median | Sigma |
| A | 13 | 254 | 10653 | 47.78 | 1027 | 1012 | 201.8 |
| A | 3 | 137 | 9309 | 41.12 | 1027 | 1012 | 201.8 |
| A | 0 | 226 | 8616 | 37.69 | 1027 | 1012 | 201.8 |
| B | 6 | 159 | 1765133 | 9506.01 | 990 | 971 | 185.6 |
| B | 12 | 111 | 22179 | 114.28 | 990 | 971 | 185.6 |
| B | 11 | 111 | 20466 | 105.05 | 990 | 971 | 185.6 |
| C | 0 | 10 | 452844 | 2068.76 | 944 | 955 | 218.4 |
| C | 14 | 238 | 161058 | 732.96 | 944 | 955 | 218.4 |
| C | 3 | 233 | 53180 | 239.09 | 944 | 955 | 218.4 |
| D | 8 | 195 | 211572 | 926.78 | 980 | 963 | 227.2 |
| D | 12 | 233 | 55704 | 240.89 | 980 | 963 | 227.2 |
| D | 2 | 120 | 30479 | 129.88 | 980 | 963 | 227.2 |
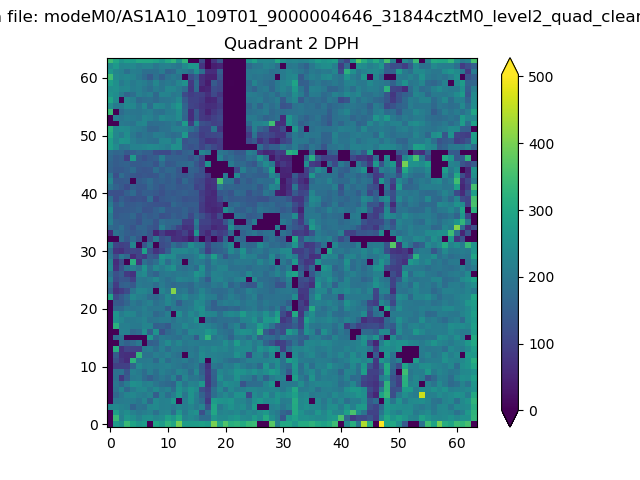
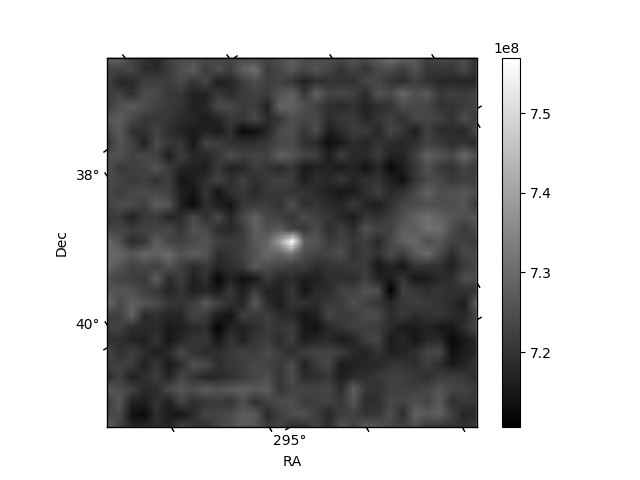
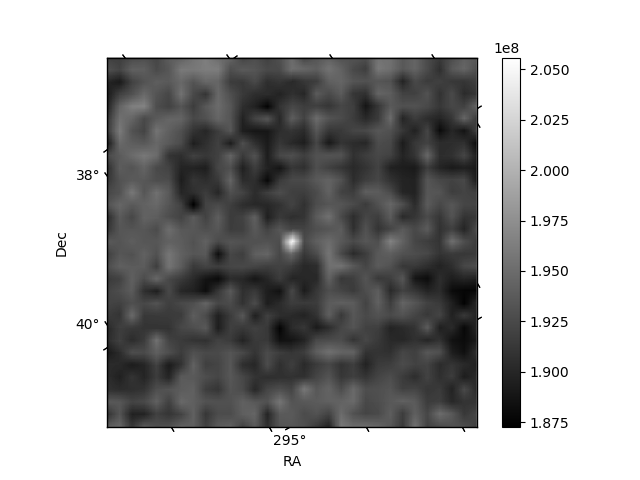
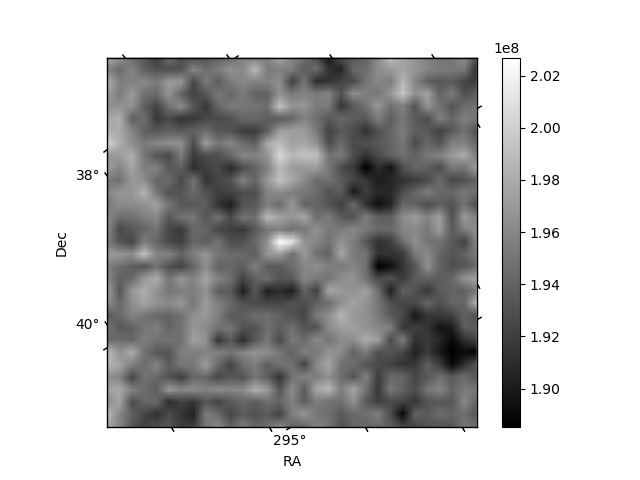
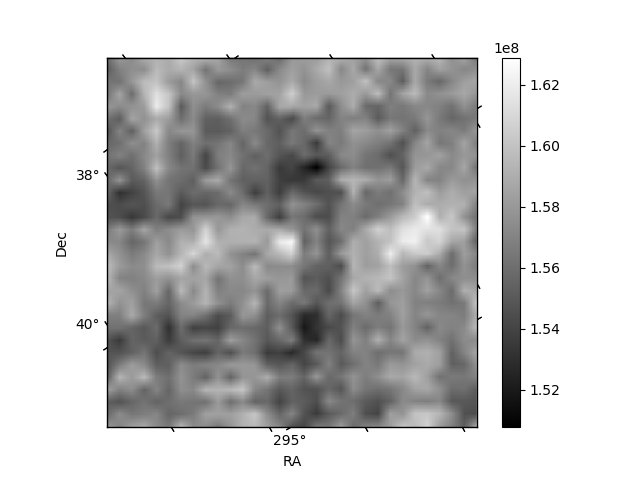
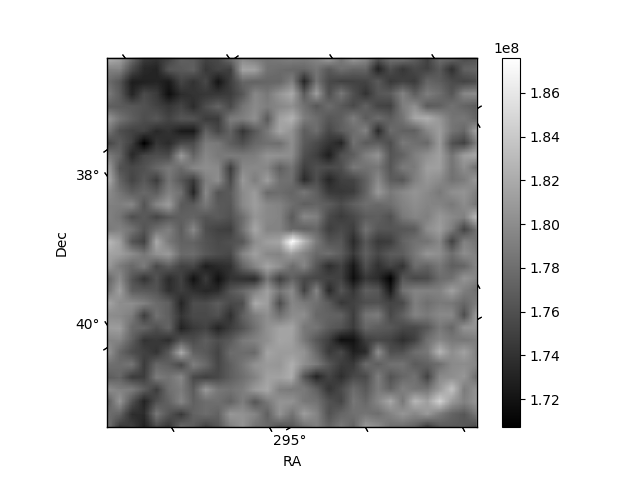
Histogram calculated using DETX and DETY for each event in the final _common_clean file
| Quadrant A | 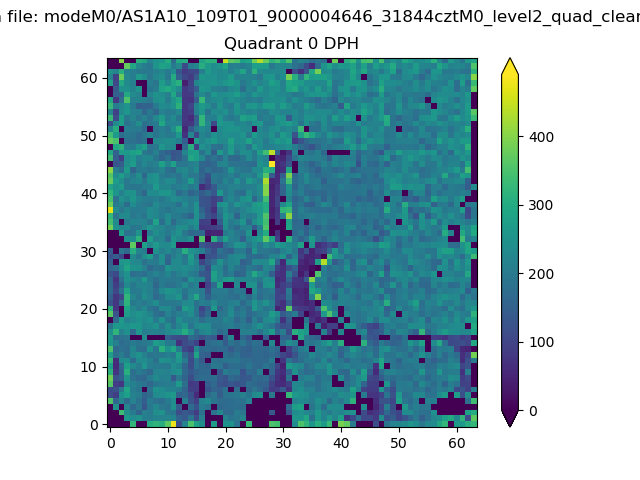 |
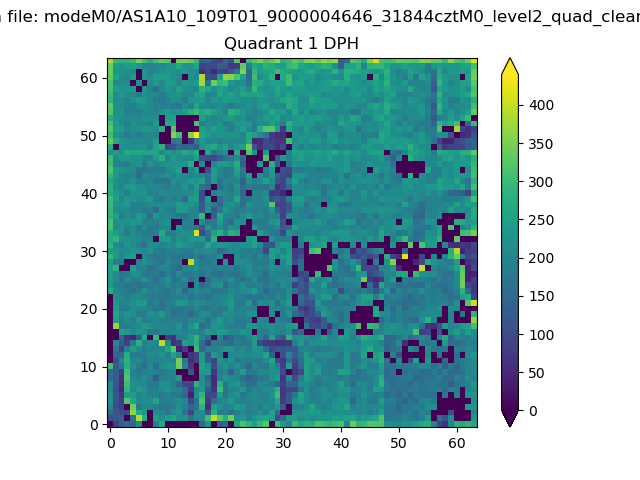 |
Quadrant B |
|---|---|---|---|
| Quadrant D | 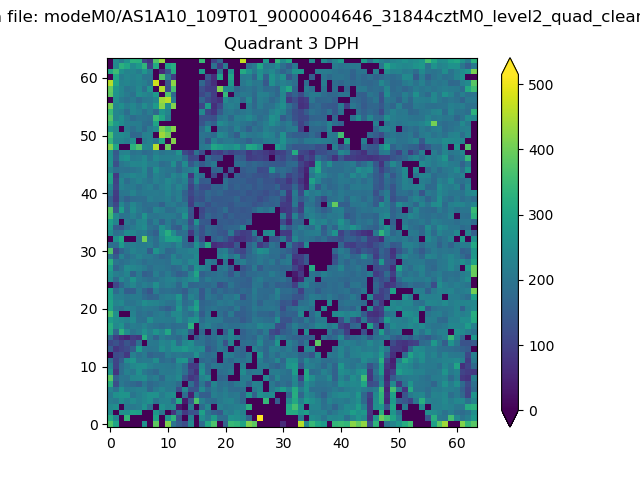 |
 |
Quadrant C |
| Plot type | Count rate plots | Images |
|---|---|---|
| Comparison with Poisson distribution Blue bars denote a histogram of data divided into 1 sec bins. Red curve is a Poisson curve with rate = median count rate of data. |
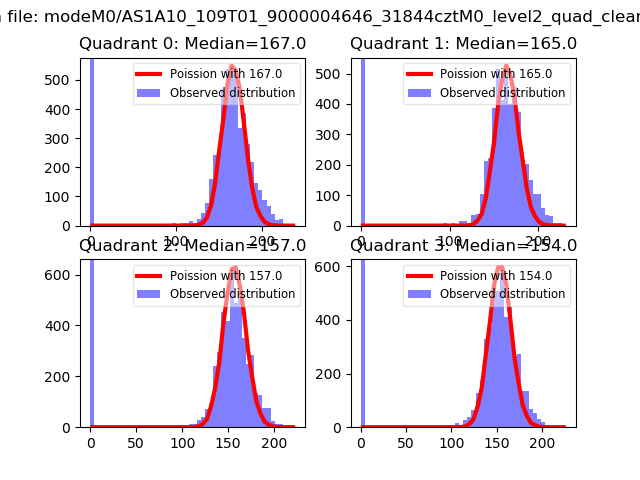 |
 |
| Quadrant-wise count rates Data is divided into 100 sec bins |
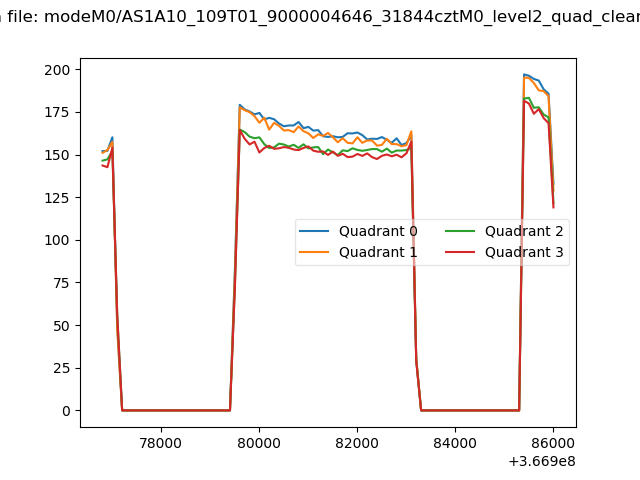 |
|
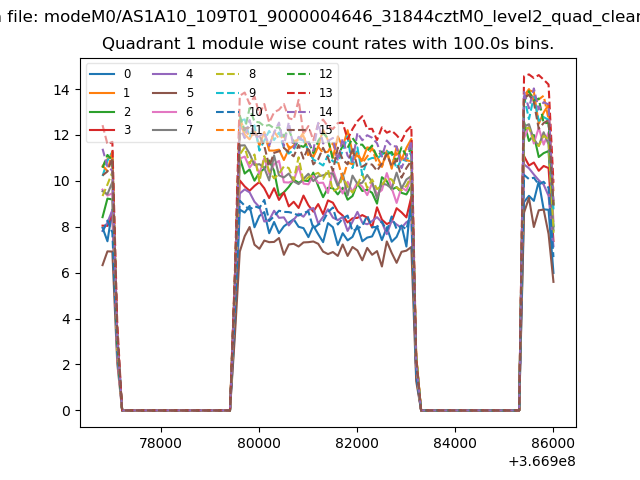
| Module-wise count rates for Quadrant A Data is divided into 100 sec bins |
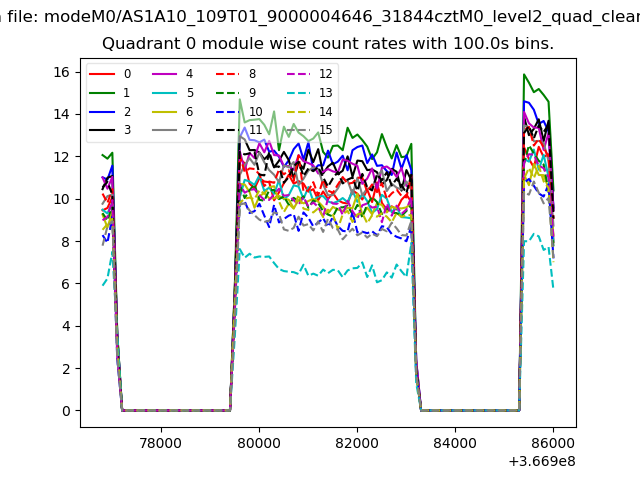 |
 |
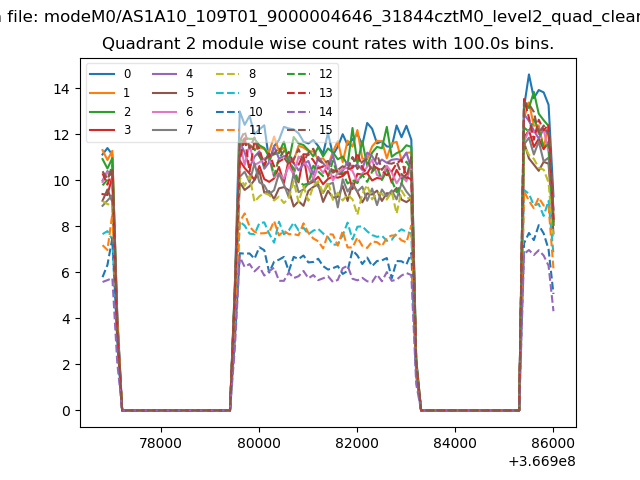
| Module-wise count rates for Quadrant B Data is divided into 100 sec bins |
 |
 |
| Module-wise count rates for Quadrant C Data is divided into 100 sec bins |
 |
 |
| Module-wise count rates for Quadrant D Data is divided into 100 sec bins |
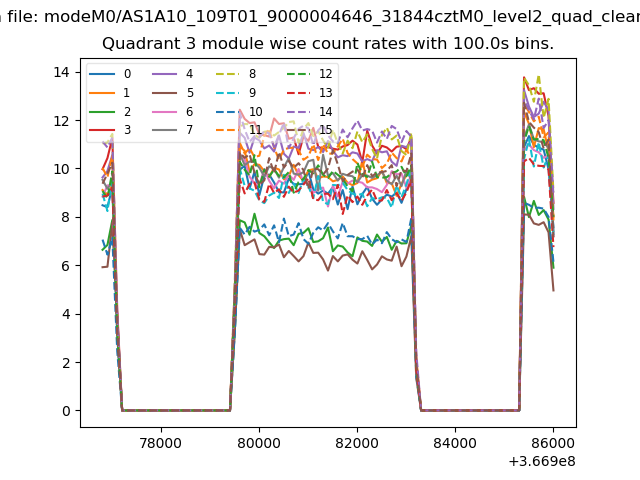 |
 |
| Parameter | Plot |
|---|---|
| CZT HV Monitor | 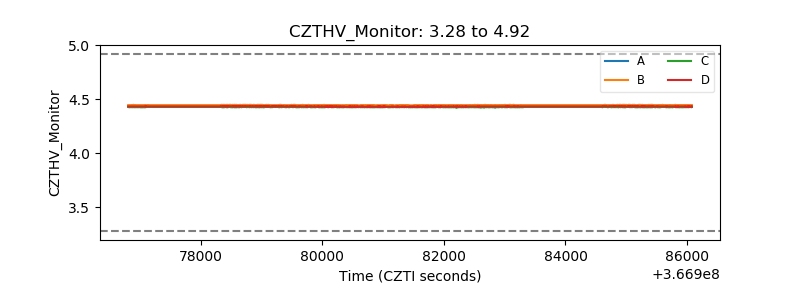 |
| D_VDD | 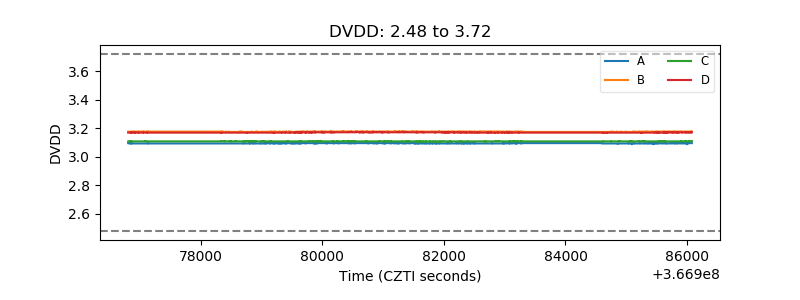 |
| Temperature 1 | 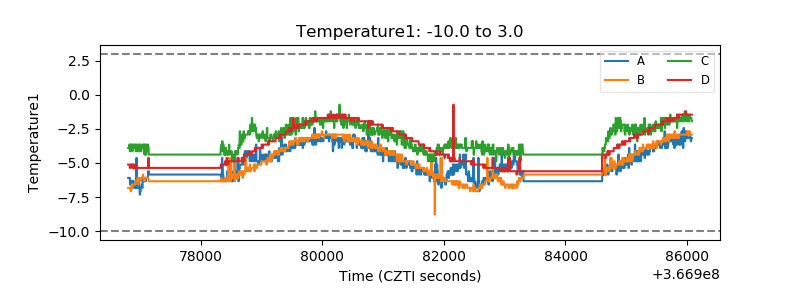 |
| Veto HV Monitor | 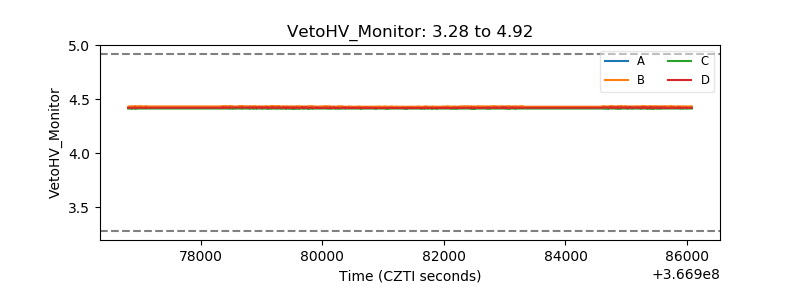 |
| Veto LLD | 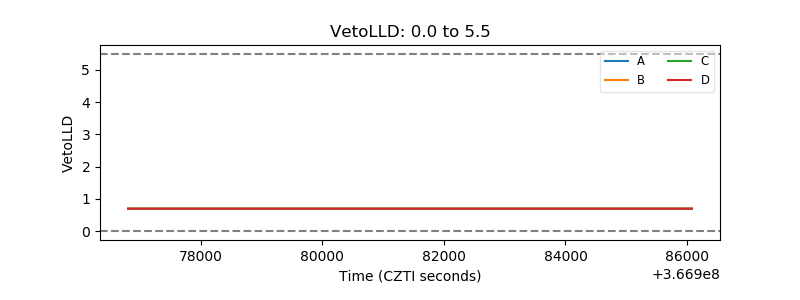 |
| Alpha Counter | 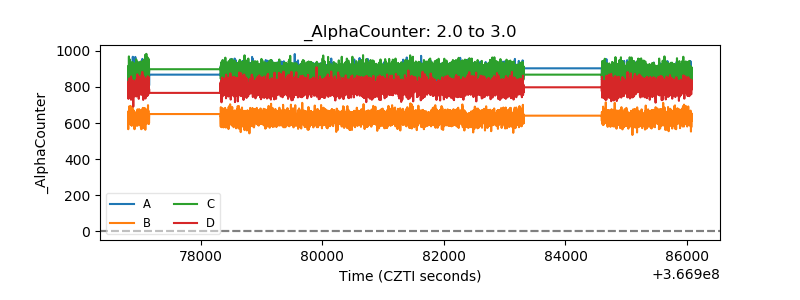 |
| _CPM_Rate | 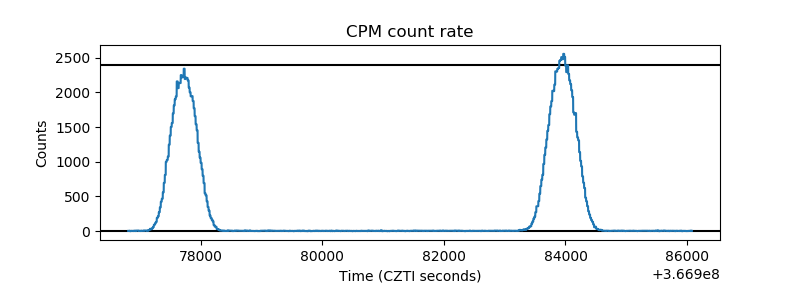 |
| CZT Counter | 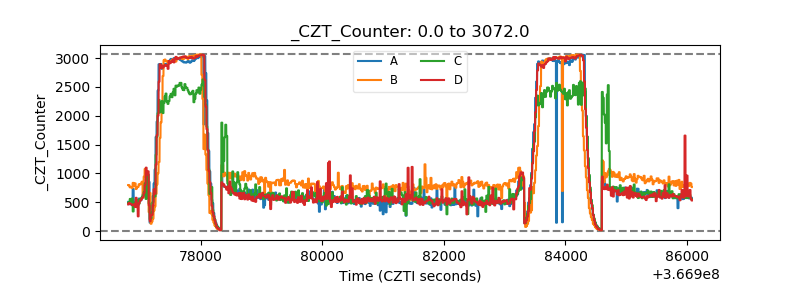 |
| +2.5 Volts monitor |  |
| +5 Volts monitor |  |
| _ROLL_ROT | 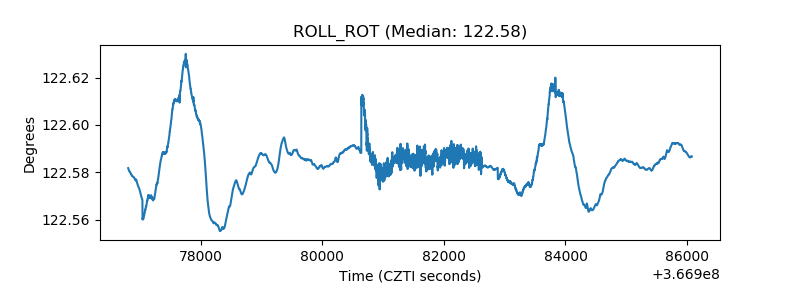 |
| _Roll_DEC | 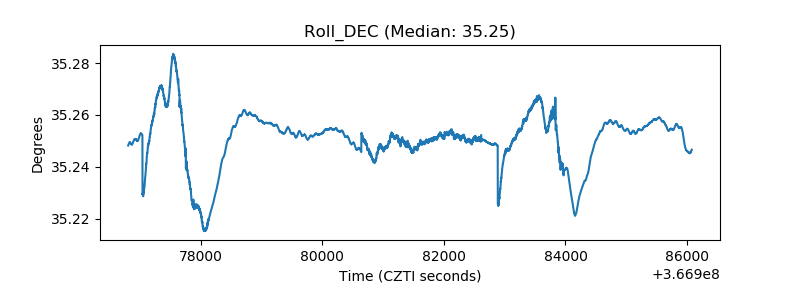 |
| _Roll_RA | 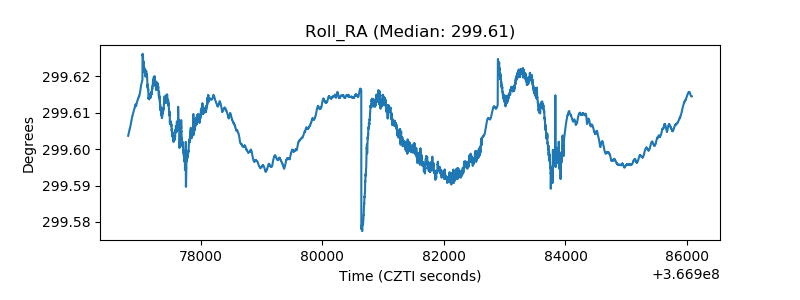 |
| Veto Counter | 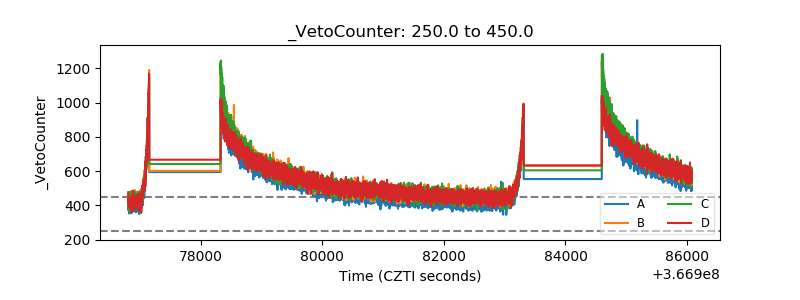 |