| Param | Original file | Final file |
|---|---|---|
| Filename | modeM0/AS1A10_109T01_9000004646_31845cztM0_level2.evt | modeM0/AS1A10_109T01_9000004646_31845cztM0_level2_quad_clean.evt |
| Size (bytes) | 598,694,400 | 122,048,640 |
| Size | 571.0 MB | 116.4 MB |
| Events in quadrant A | 3,766,970 | 847,581 |
| Events in quadrant B | 5,335,212 | 831,969 |
| Events in quadrant C | 4,476,217 | 791,594 |
| Events in quadrant D | 4,117,970 | 776,716 |
| Mode SS | |||
|---|---|---|---|
| Quadrant | BADHDUFLAG | Total packets | Discarded packets |
| A | 0 | 132 | 0 |
| B | 0 | 132 | 0 |
| C | 0 | 132 | 0 |
| D | 0 | 132 | 0 |
| Mode M0 | |||
|---|---|---|---|
| Quadrant | BADHDUFLAG | Total packets | Discarded packets |
| A | 0 | 15542 | 2 |
| B | 0 | 20124 | 2 |
| C | 0 | 17901 | 2 |
| D | 0 | 16519 | 2 |
| Mode M9 | |||
|---|---|---|---|
| Quadrant | BADHDUFLAG | Total packets | Discarded packets |
| A | 0 | 17 | 0 |
| B | 0 | 18 | 0 |
| C | 0 | 18 | 0 |
| D | 0 | 18 | 0 |
| Quadrant | Total seconds | Saturated seconds | Saturation percentage |
|---|---|---|---|
| A | 6430 | 108 | 1.679627% |
| B | 6430 | 181 | 2.814930% |
| C | 6430 | 433 | 6.734059% |
| D | 6430 | 174 | 2.706065% |
Noise dominated data is calculated using 1-second bins in cleaned event files. If a bin has >2000 counts, and if more than 50% of those come from <1% of pixels, then it is considered to be noise-dominated and hence unusable.
| Quadrant | # 1 sec bins | Bins with >0 counts | Bins with >2000 counts | High rate bins dominated by noise | Noise dominated (total time) | Noise dominated (detector-on time) | Marked lightcurve |
|---|---|---|---|---|---|---|---|
| A | 7750 | 6431 | 0 | 0 | 0.00% | 0.00% | 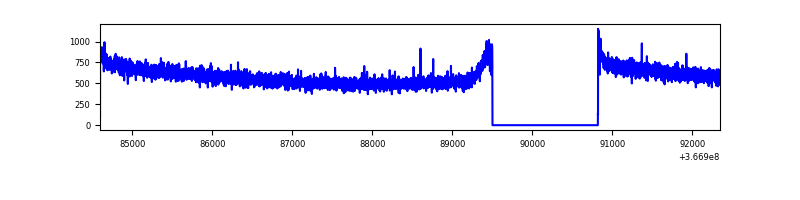 |
| B | 7750 | 6431 | 1 | 1 | 0.01% | 0.02% | 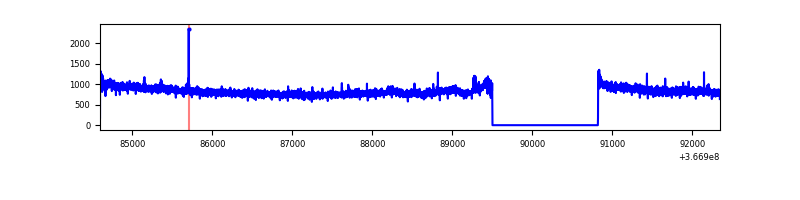 |
| C | 7750 | 6431 | 174 | 174 | 2.25% | 2.71% | 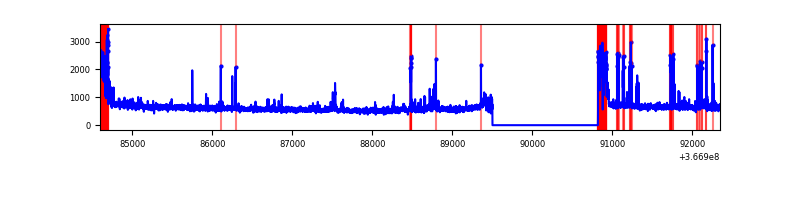 |
| D | 7750 | 6431 | 67 | 67 | 0.86% | 1.04% | 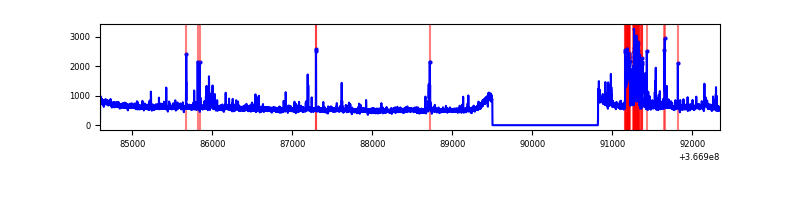 |
Top three noisy pixels from each quadrant. If the there are fewer than three noisy pixels in the level2.evt file, extra rows are filled as -1
| Pixel properties | Quadrant properties | ||||||
|---|---|---|---|---|---|---|---|
| Quadrant | DetID | PixID | Counts | Sigma | Mean | Median | Sigma |
| A | 13 | 254 | 10710 | 50.83 | 977 | 965 | 191.7 |
| A | 3 | 137 | 8755 | 40.63 | 977 | 965 | 191.7 |
| A | 0 | 226 | 8277 | 38.14 | 977 | 965 | 191.7 |
| B | 6 | 159 | 1623883 | 9234.28 | 941 | 923 | 175.8 |
| B | 12 | 111 | 20414 | 110.9 | 941 | 923 | 175.8 |
| B | 11 | 111 | 19174 | 103.84 | 941 | 923 | 175.8 |
| C | 0 | 10 | 635435 | 3069.23 | 896 | 910 | 206.7 |
| C | 14 | 238 | 153054 | 735.93 | 896 | 910 | 206.7 |
| C | 3 | 233 | 132515 | 636.58 | 896 | 910 | 206.7 |
| D | 12 | 218 | 248294 | 1134.82 | 934 | 916 | 218.0 |
| D | 8 | 195 | 220197 | 1005.93 | 934 | 916 | 218.0 |
| D | 12 | 233 | 35247 | 157.49 | 934 | 916 | 218.0 |
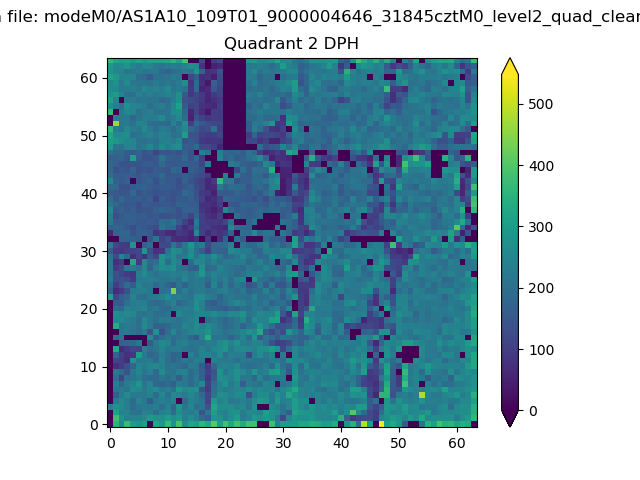
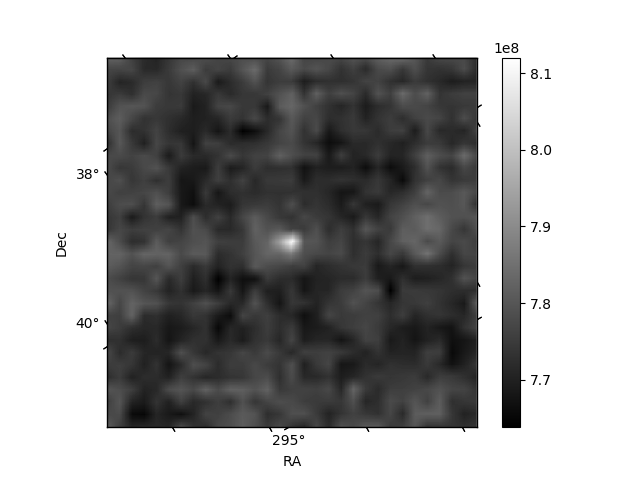
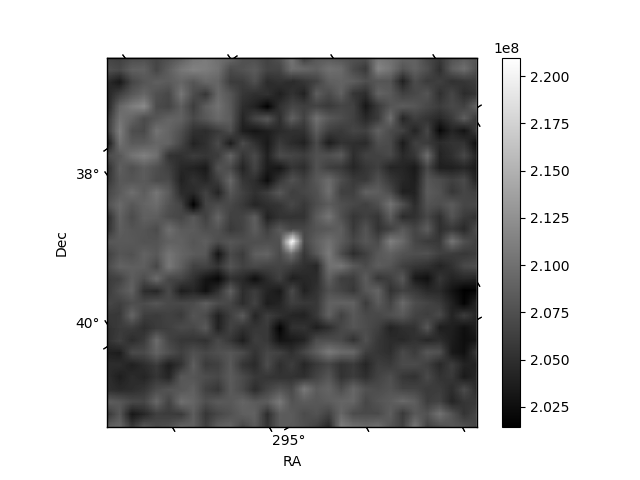
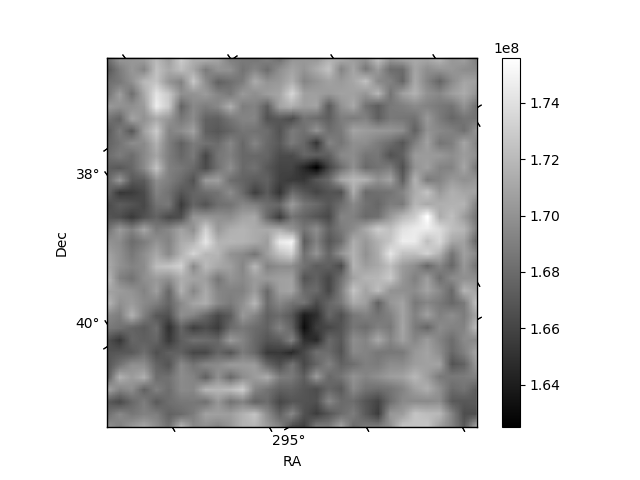
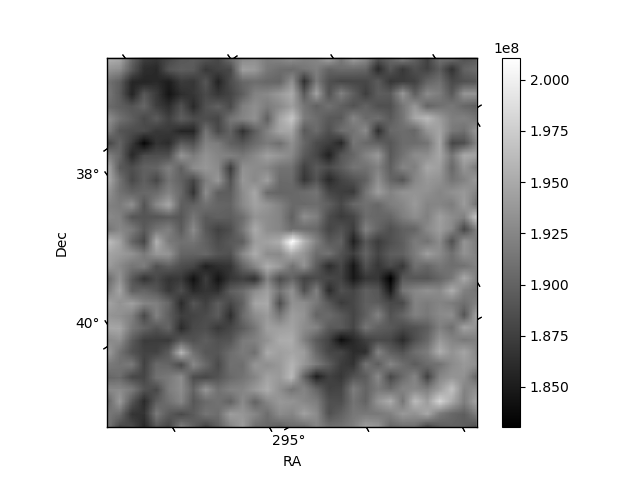
Histogram calculated using DETX and DETY for each event in the final _common_clean file
| Quadrant A | 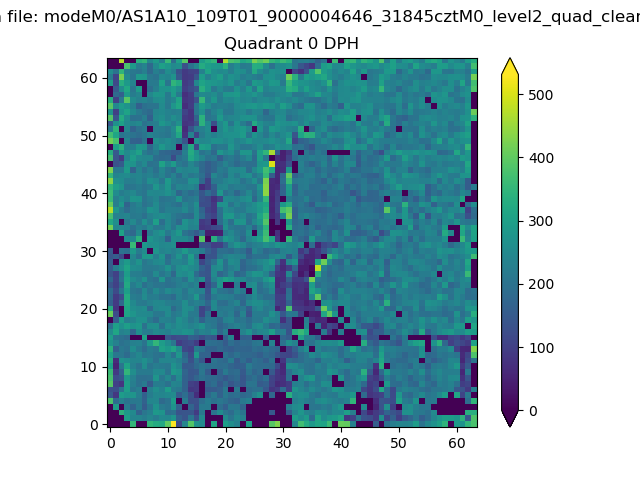 |
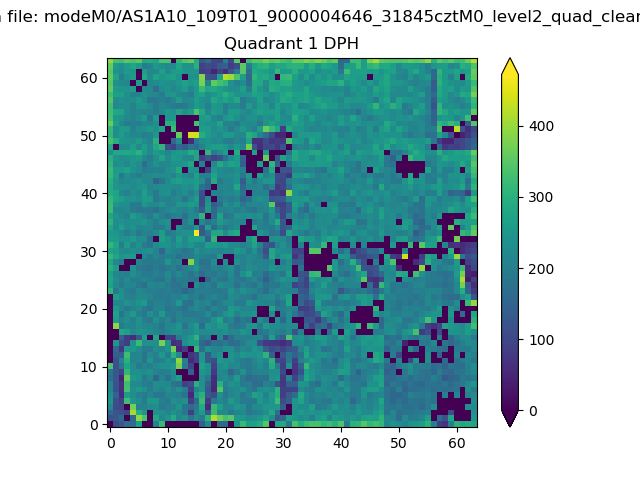 |
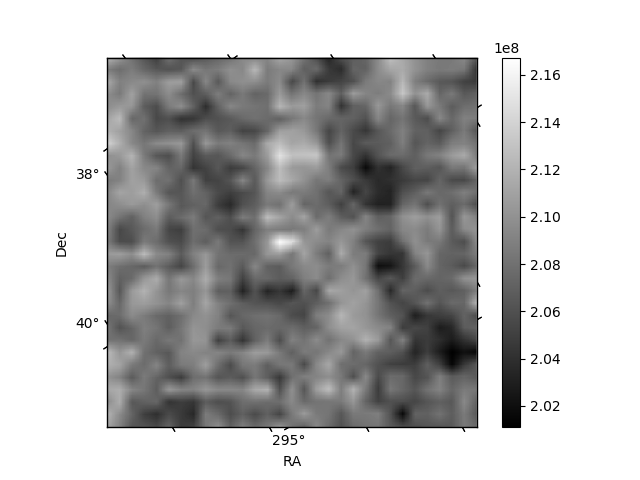
Quadrant B |
|---|---|---|---|
| Quadrant D | 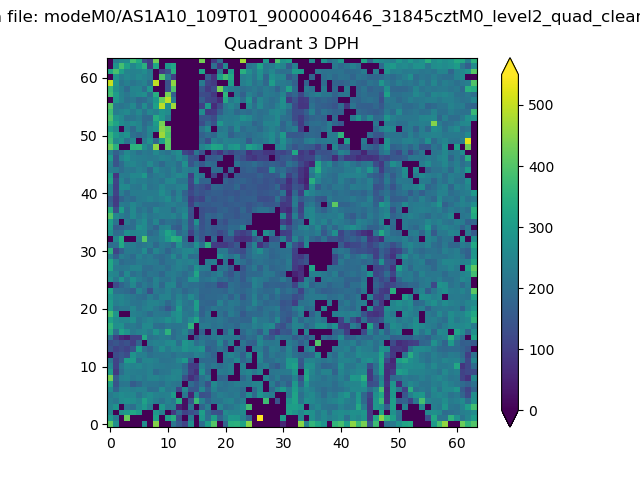 |
 |
Quadrant C |
| Plot type | Count rate plots | Images |
|---|---|---|
| Comparison with Poisson distribution Blue bars denote a histogram of data divided into 1 sec bins. Red curve is a Poisson curve with rate = median count rate of data. |
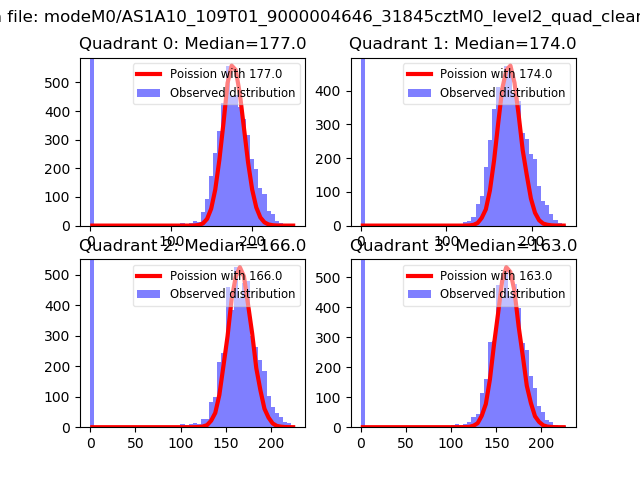 |
 |
| Quadrant-wise count rates Data is divided into 100 sec bins |
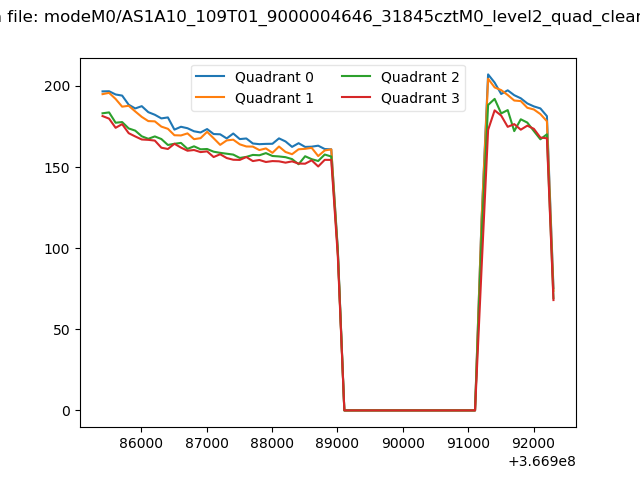 |
|
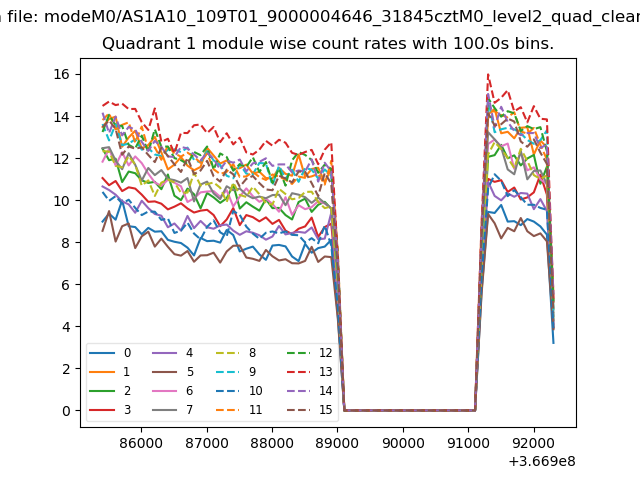
| Module-wise count rates for Quadrant A Data is divided into 100 sec bins |
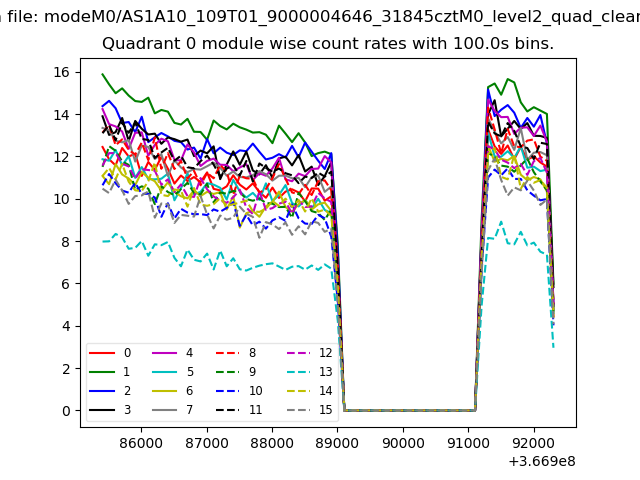 |
 |
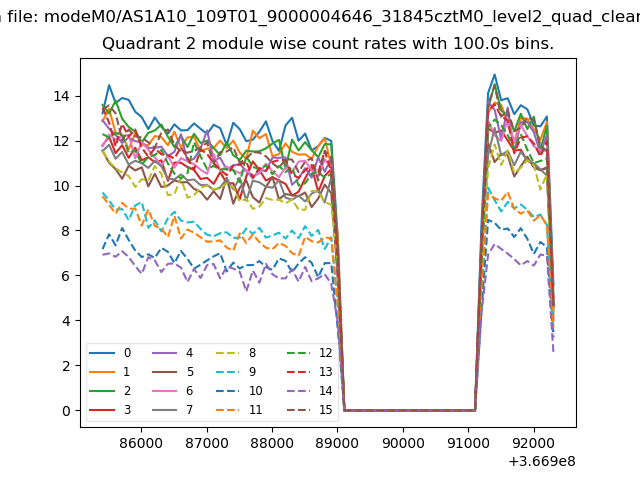
| Module-wise count rates for Quadrant B Data is divided into 100 sec bins |
 |
 |
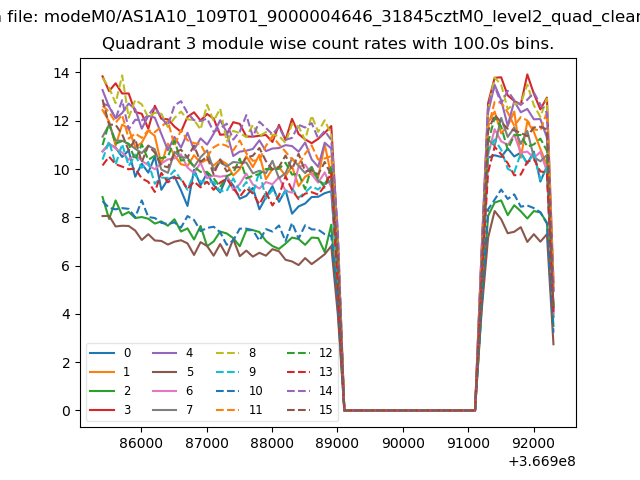
| Module-wise count rates for Quadrant C Data is divided into 100 sec bins |
 |
 |
| Module-wise count rates for Quadrant D Data is divided into 100 sec bins |
 |
 |
| Parameter | Plot |
|---|---|
| CZT HV Monitor | 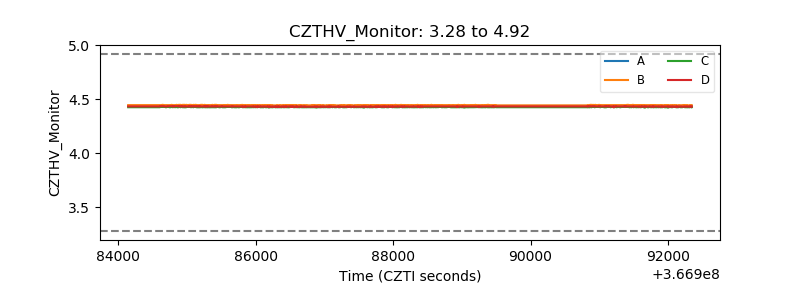 |
| D_VDD | 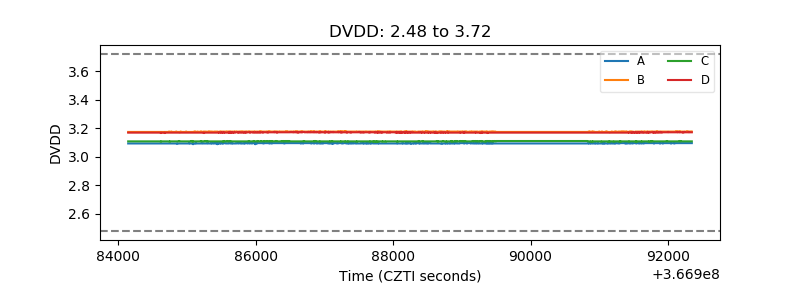 |
| Temperature 1 | 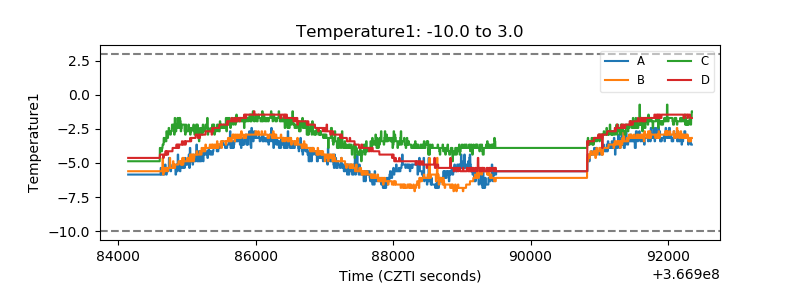 |
| Veto HV Monitor | 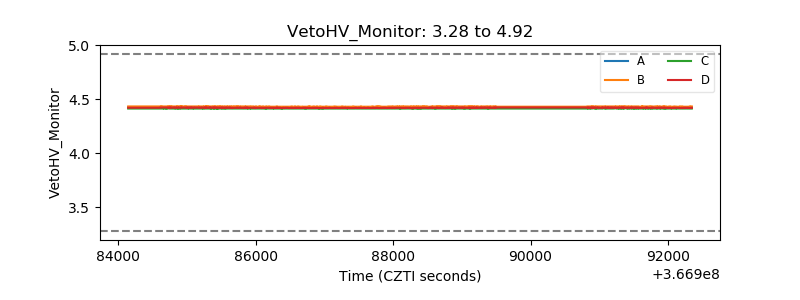 |
| Veto LLD | 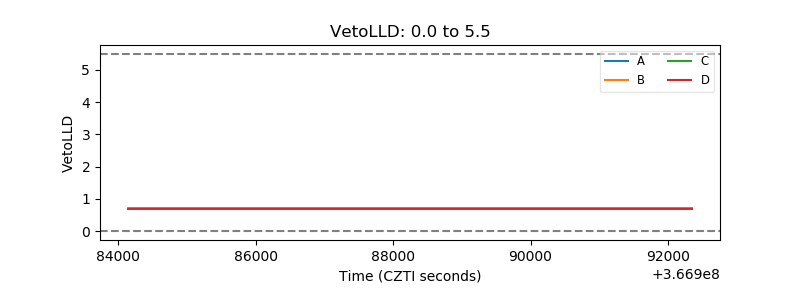 |
| Alpha Counter | 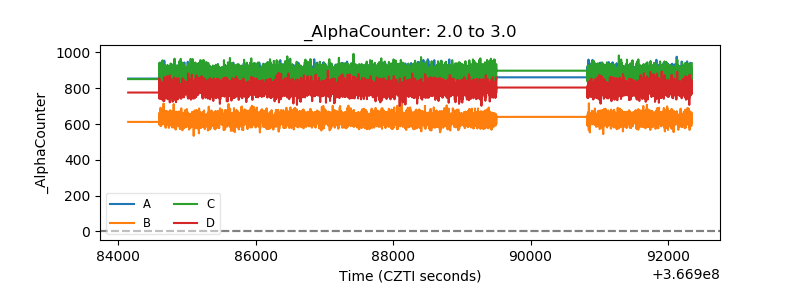 |
| _CPM_Rate | 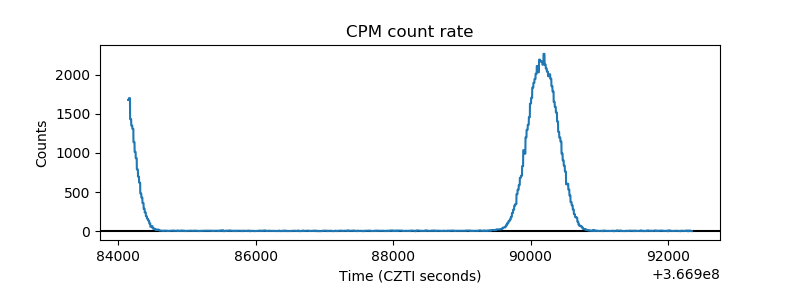 |
| CZT Counter | 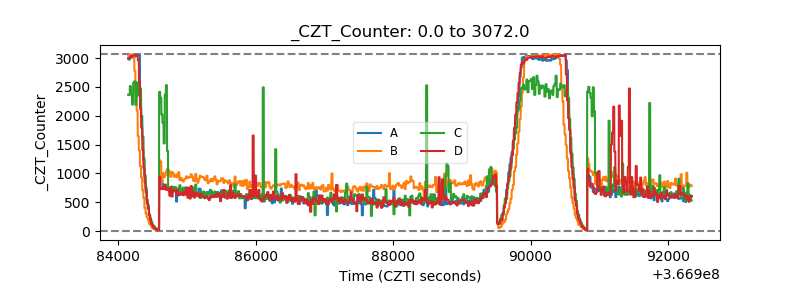 |
| +2.5 Volts monitor |  |
| +5 Volts monitor |  |
| _ROLL_ROT | 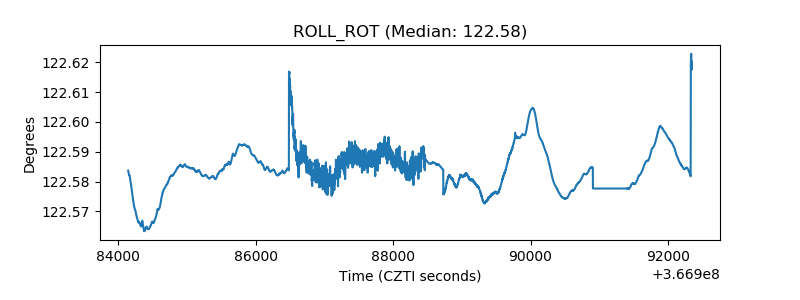 |
| _Roll_DEC | 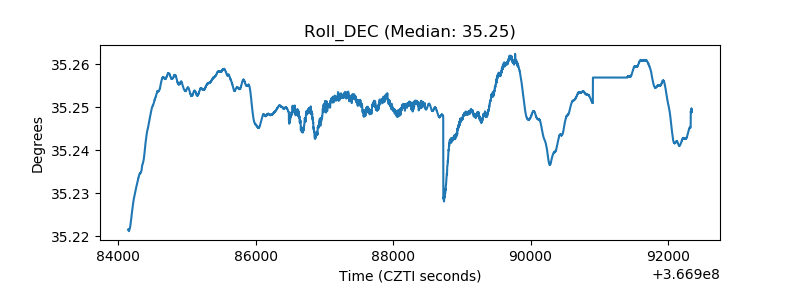 |
| _Roll_RA | 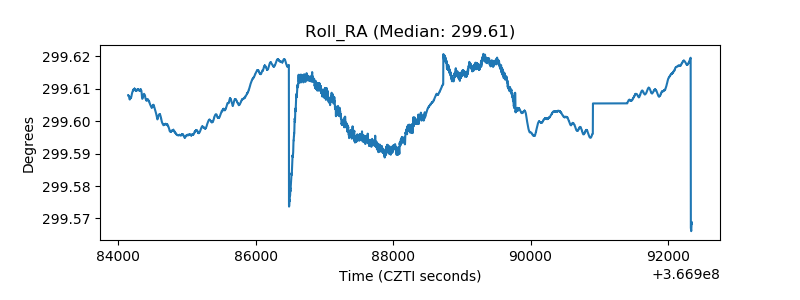 |
| Veto Counter | 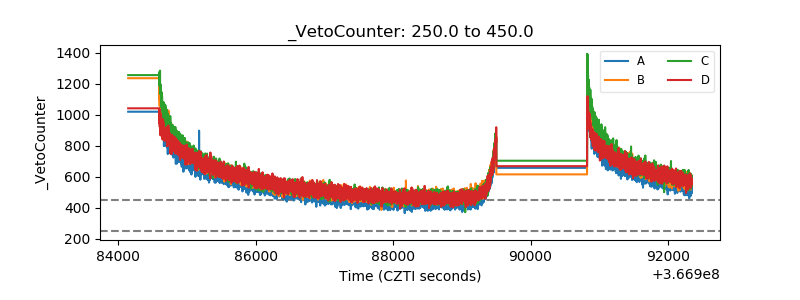 |