| Param | Original file | Final file |
|---|---|---|
| Filename | modeM0/AS1A10_109T01_9000004646_31847cztM0_level2.evt | modeM0/AS1A10_109T01_9000004646_31847cztM0_level2_quad_clean.evt |
| Size (bytes) | 556,338,240 | 119,292,480 |
| Size | 530.6 MB | 113.8 MB |
| Events in quadrant A | 3,382,396 | 827,418 |
| Events in quadrant B | 4,998,912 | 815,997 |
| Events in quadrant C | 4,321,041 | 760,074 |
| Events in quadrant D | 3,717,937 | 768,159 |
| Mode SS | |||
|---|---|---|---|
| Quadrant | BADHDUFLAG | Total packets | Discarded packets |
| A | 0 | 130 | 0 |
| B | 0 | 130 | 0 |
| C | 0 | 130 | 0 |
| D | 0 | 130 | 0 |
| Mode M0 | |||
|---|---|---|---|
| Quadrant | BADHDUFLAG | Total packets | Discarded packets |
| A | 0 | 13983 | 1 |
| B | 0 | 19214 | 1 |
| C | 0 | 17209 | 1 |
| D | 0 | 15092 | 1 |
| Mode M9 | |||
|---|---|---|---|
| Quadrant | BADHDUFLAG | Total packets | Discarded packets |
| A | 0 | 11 | 0 |
| B | 0 | 11 | 0 |
| C | 0 | 11 | 0 |
| D | 0 | 11 | 0 |
| Quadrant | Total seconds | Saturated seconds | Saturation percentage |
|---|---|---|---|
| A | 6321 | 86 | 1.360544% |
| B | 6321 | 158 | 2.499604% |
| C | 6320 | 519 | 8.212025% |
| D | 6320 | 122 | 1.930380% |
Noise dominated data is calculated using 1-second bins in cleaned event files. If a bin has >2000 counts, and if more than 50% of those come from <1% of pixels, then it is considered to be noise-dominated and hence unusable.
| Quadrant | # 1 sec bins | Bins with >0 counts | Bins with >2000 counts | High rate bins dominated by noise | Noise dominated (total time) | Noise dominated (detector-on time) | Marked lightcurve |
|---|---|---|---|---|---|---|---|
| A | 7471 | 6322 | 0 | 0 | 0.00% | 0.00% | 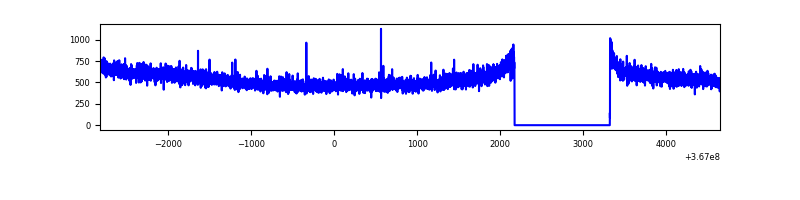 |
| B | 7471 | 6322 | 2 | 2 | 0.03% | 0.03% | 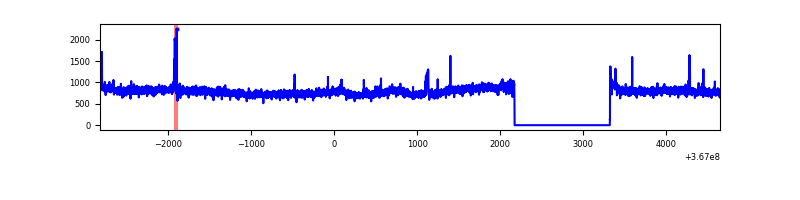 |
| C | 7470 | 6321 | 87 | 87 | 1.16% | 1.38% | 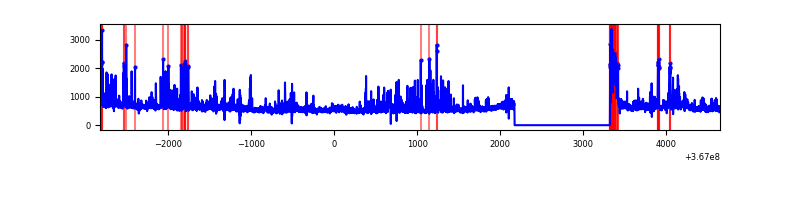 |
| D | 7470 | 6321 | 19 | 19 | 0.25% | 0.30% | 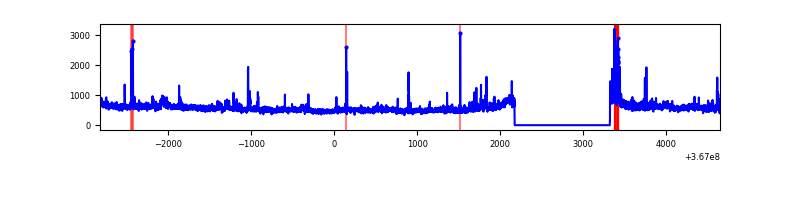 |
Top three noisy pixels from each quadrant. If the there are fewer than three noisy pixels in the level2.evt file, extra rows are filled as -1
| Pixel properties | Quadrant properties | ||||||
|---|---|---|---|---|---|---|---|
| Quadrant | DetID | PixID | Counts | Sigma | Mean | Median | Sigma |
| A | 13 | 6 | 15501 | 83.9 | 873 | 861 | 174.5 |
| A | 13 | 254 | 10777 | 56.83 | 873 | 861 | 174.5 |
| A | 3 | 137 | 8274 | 42.48 | 873 | 861 | 174.5 |
| B | 6 | 159 | 1606038 | 10015.61 | 850 | 832 | 160.3 |
| B | 0 | 190 | 42943 | 262.75 | 850 | 832 | 160.3 |
| B | 12 | 111 | 18974 | 113.2 | 850 | 832 | 160.3 |
| C | 0 | 10 | 588176 | 3101.79 | 813 | 823 | 189.4 |
| C | 3 | 233 | 243722 | 1282.74 | 813 | 823 | 189.4 |
| C | 14 | 238 | 202190 | 1063.41 | 813 | 823 | 189.4 |
| D | 8 | 195 | 318959 | 1590.9 | 846 | 829 | 200.0 |
| D | 12 | 218 | 77478 | 383.3 | 846 | 829 | 200.0 |
| D | 2 | 250 | 46936 | 230.57 | 846 | 829 | 200.0 |
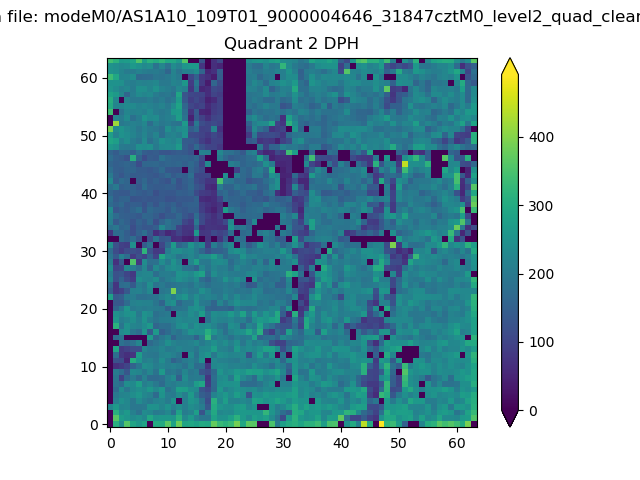
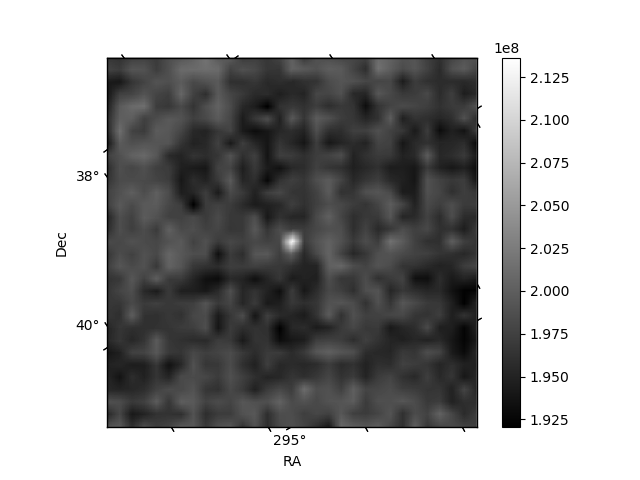
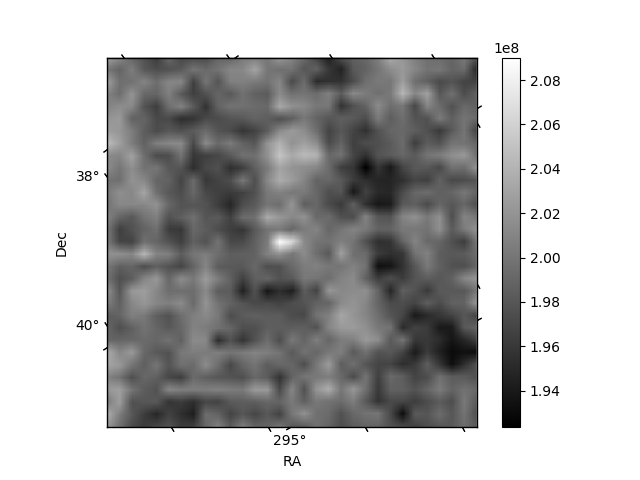
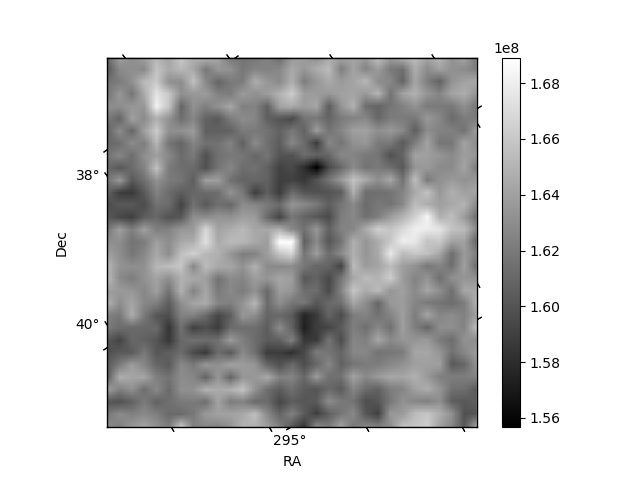
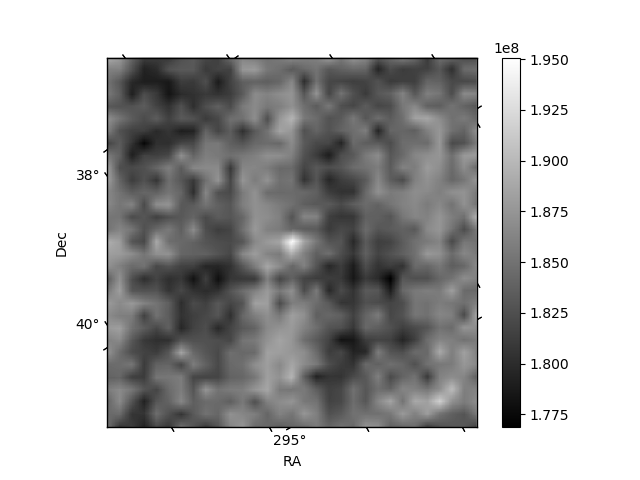
Histogram calculated using DETX and DETY for each event in the final _common_clean file
| Quadrant A | 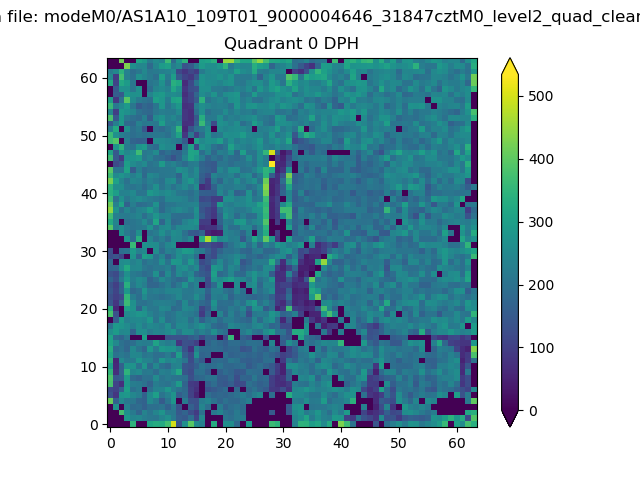 |
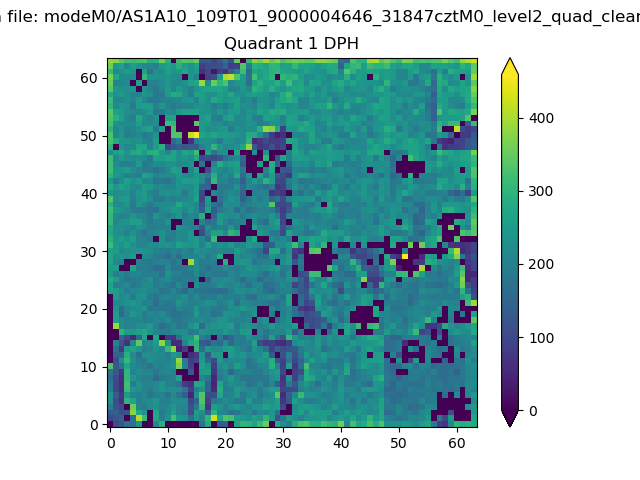 |
Quadrant B |
|---|---|---|---|
| Quadrant D | 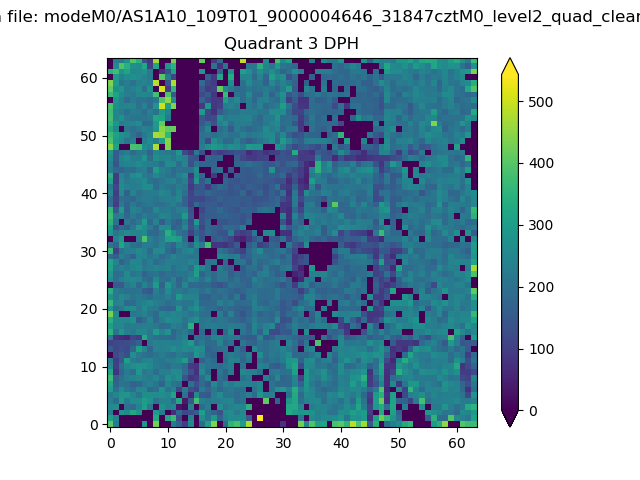 |
 |
Quadrant C |
| Plot type | Count rate plots | Images |
|---|---|---|
| Comparison with Poisson distribution Blue bars denote a histogram of data divided into 1 sec bins. Red curve is a Poisson curve with rate = median count rate of data. |
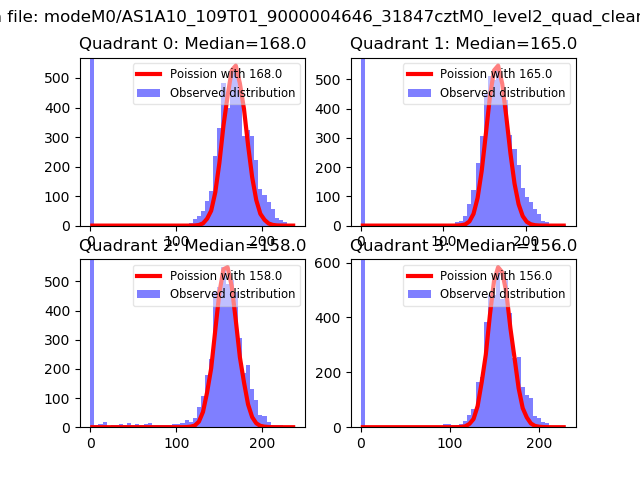 |
 |
| Quadrant-wise count rates Data is divided into 100 sec bins |
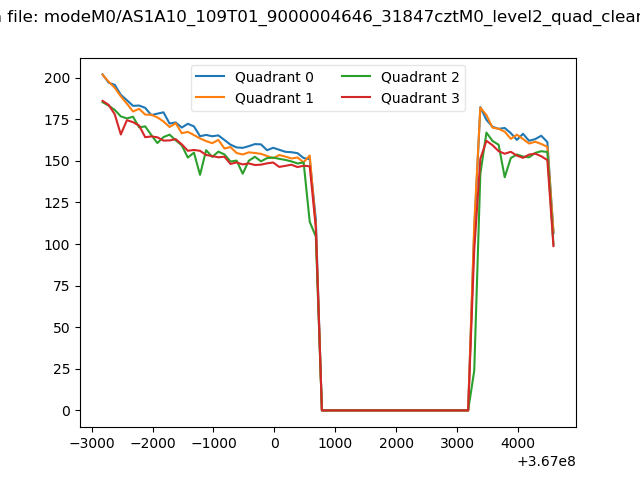 |
|
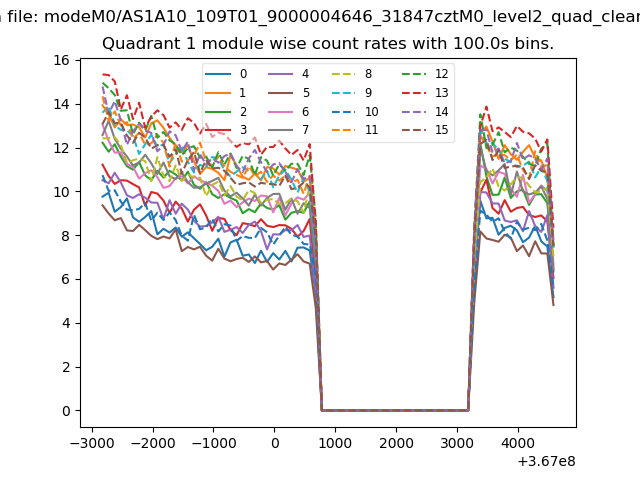
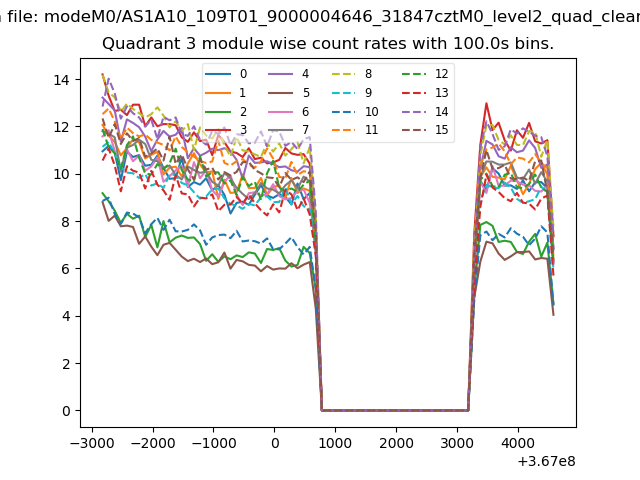
| Module-wise count rates for Quadrant A Data is divided into 100 sec bins |
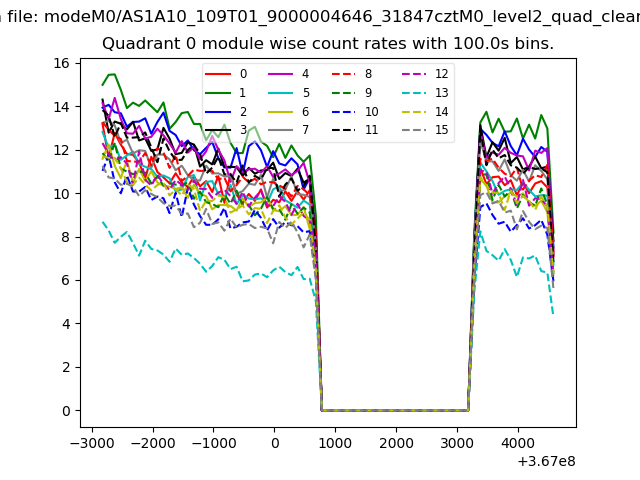 |
 |
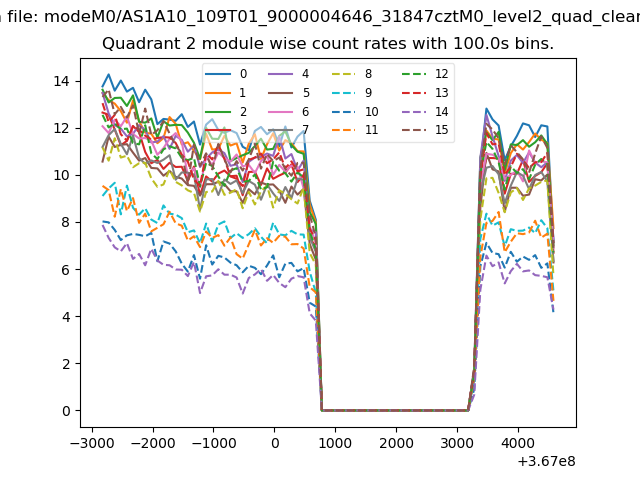
| Module-wise count rates for Quadrant B Data is divided into 100 sec bins |
 |
 |
| Module-wise count rates for Quadrant C Data is divided into 100 sec bins |
 |
 |
| Module-wise count rates for Quadrant D Data is divided into 100 sec bins |
 |
 |
| Parameter | Plot |
|---|---|
| CZT HV Monitor | 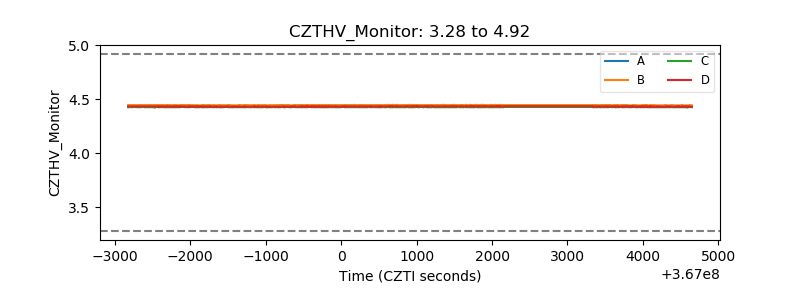 |
| D_VDD | 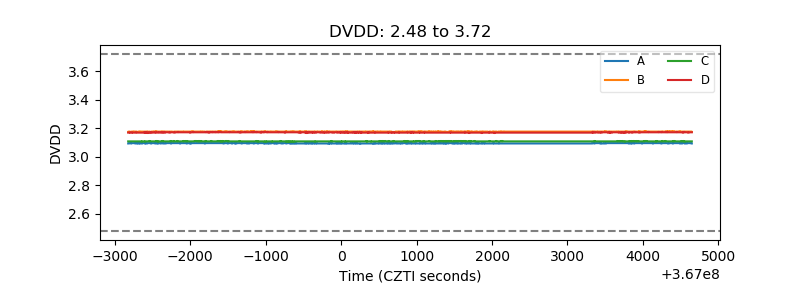 |
| Temperature 1 |  |
| Veto HV Monitor | 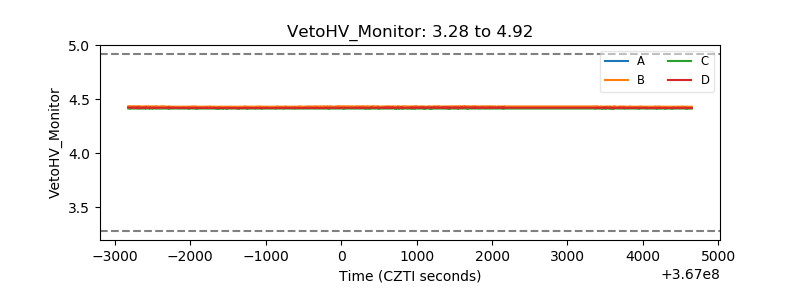 |
| Veto LLD | 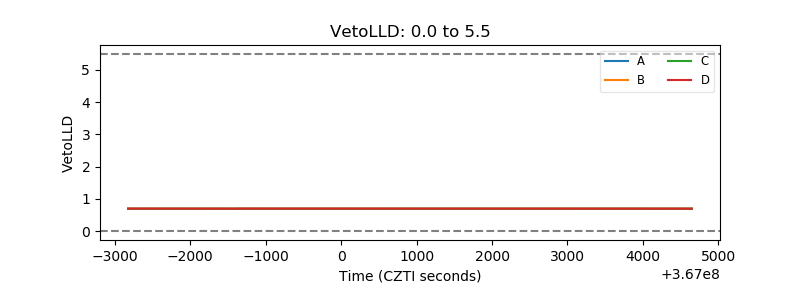 |
| Alpha Counter | 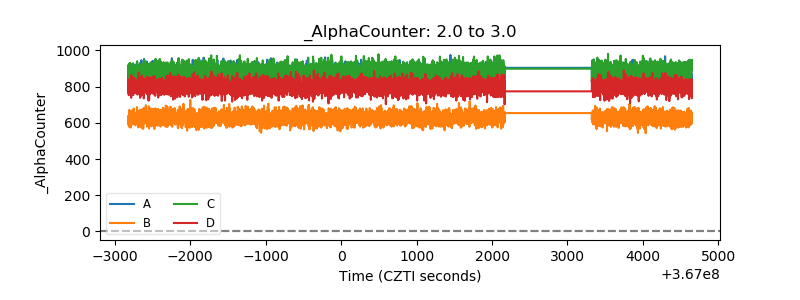 |
| _CPM_Rate | 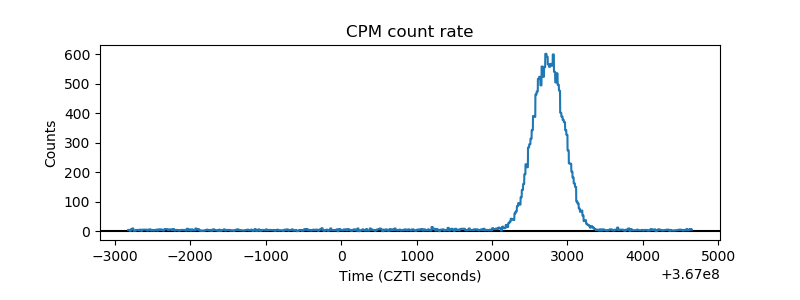 |
| CZT Counter |  |
| +2.5 Volts monitor |  |
| +5 Volts monitor |  |
| _ROLL_ROT | 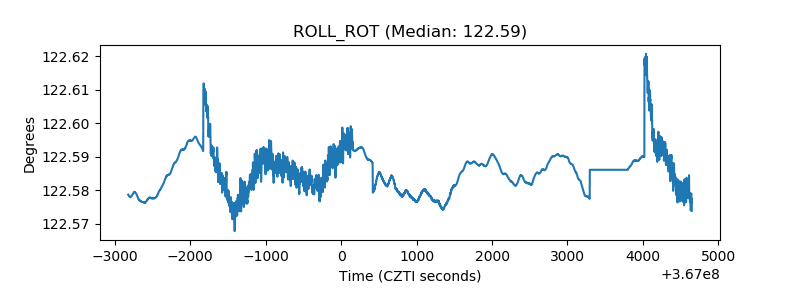 |
| _Roll_DEC | 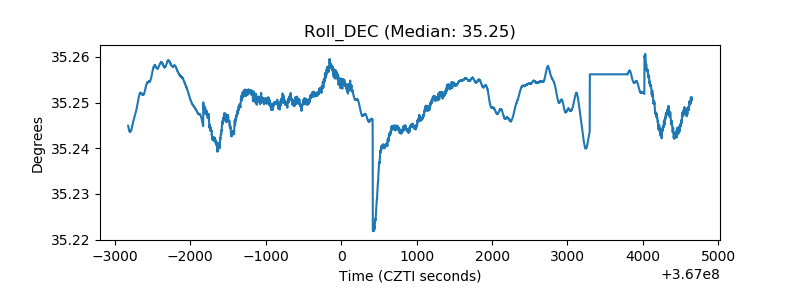 |
| _Roll_RA | 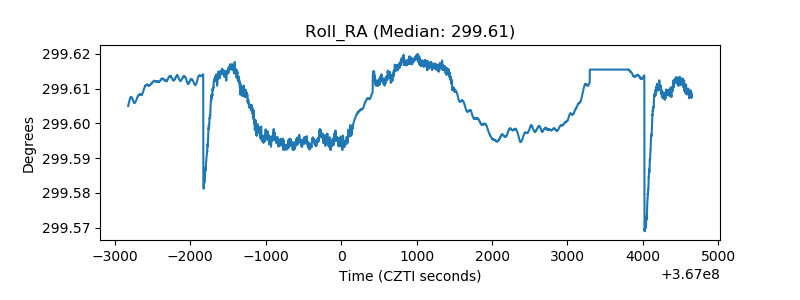 |
| Veto Counter | 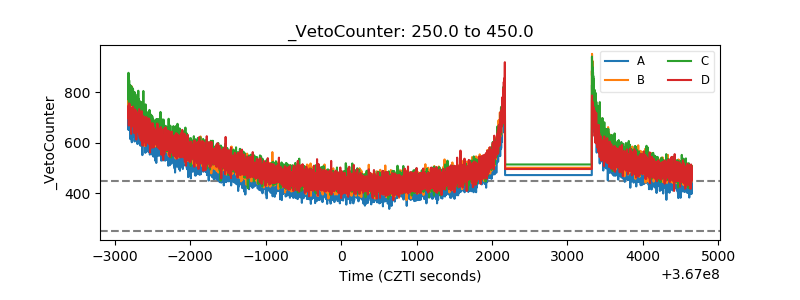 |