| Param | Original file | Final file |
|---|---|---|
| Filename | modeM0/AS1A10_109T01_9000004646_31848cztM0_level2.evt | modeM0/AS1A10_109T01_9000004646_31848cztM0_level2_quad_clean.evt |
| Size (bytes) | 520,087,680 | 97,562,880 |
| Size | 496.0 MB | 93.0 MB |
| Events in quadrant A | 3,155,405 | 652,461 |
| Events in quadrant B | 4,881,965 | 641,786 |
| Events in quadrant C | 3,902,989 | 608,569 |
| Events in quadrant D | 3,383,212 | 611,755 |
| Mode SS | |||
|---|---|---|---|
| Quadrant | BADHDUFLAG | Total packets | Discarded packets |
| A | 0 | 128 | 0 |
| B | 0 | 128 | 0 |
| C | 0 | 128 | 0 |
| D | 0 | 128 | 0 |
| Mode M0 | |||
|---|---|---|---|
| Quadrant | BADHDUFLAG | Total packets | Discarded packets |
| A | 0 | 13147 | 1 |
| B | 0 | 19156 | 1 |
| C | 0 | 15647 | 1 |
| D | 0 | 14066 | 1 |
| Mode M9 | |||
|---|---|---|---|
| Quadrant | BADHDUFLAG | Total packets | Discarded packets |
| A | 0 | 9 | 0 |
| B | 0 | 9 | 0 |
| C | 0 | 9 | 0 |
| D | 0 | 9 | 0 |
| Quadrant | Total seconds | Saturated seconds | Saturation percentage |
|---|---|---|---|
| A | 6305 | 53 | 0.840603% |
| B | 6306 | 118 | 1.871234% |
| C | 6306 | 402 | 6.374881% |
| D | 6306 | 46 | 0.729464% |
Noise dominated data is calculated using 1-second bins in cleaned event files. If a bin has >2000 counts, and if more than 50% of those come from <1% of pixels, then it is considered to be noise-dominated and hence unusable.
| Quadrant | # 1 sec bins | Bins with >0 counts | Bins with >2000 counts | High rate bins dominated by noise | Noise dominated (total time) | Noise dominated (detector-on time) | Marked lightcurve |
|---|---|---|---|---|---|---|---|
| A | 7170 | 6306 | 0 | 0 | 0.00% | 0.00% | 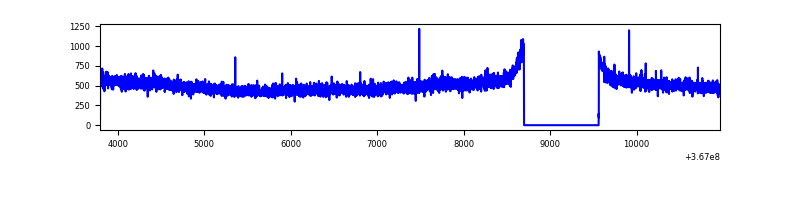 |
| B | 7171 | 6307 | 6 | 6 | 0.08% | 0.10% | 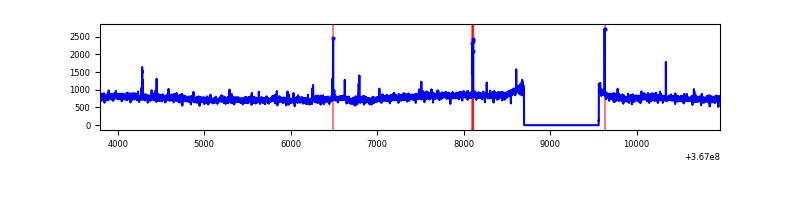 |
| C | 7171 | 6307 | 64 | 64 | 0.89% | 1.01% | 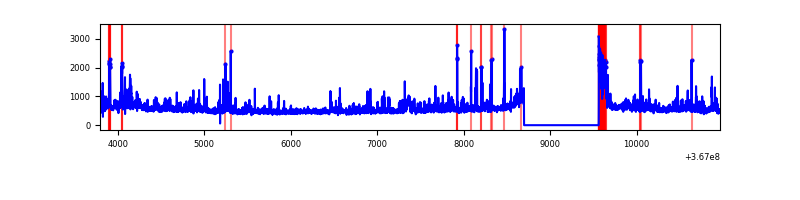 |
| D | 7171 | 6307 | 5 | 5 | 0.07% | 0.08% | 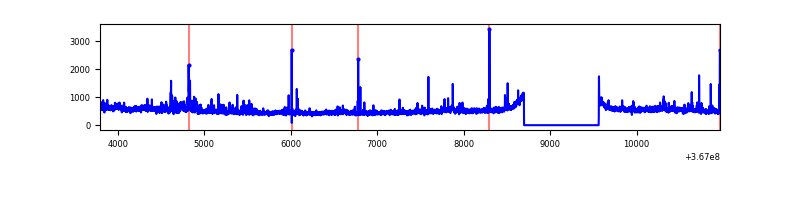 |
Top three noisy pixels from each quadrant. If the there are fewer than three noisy pixels in the level2.evt file, extra rows are filled as -1
| Pixel properties | Quadrant properties | ||||||
|---|---|---|---|---|---|---|---|
| Quadrant | DetID | PixID | Counts | Sigma | Mean | Median | Sigma |
| A | 13 | 6 | 14261 | 82.57 | 814 | 801 | 163.0 |
| A | 13 | 254 | 11066 | 62.97 | 814 | 801 | 163.0 |
| A | 3 | 137 | 8089 | 44.71 | 814 | 801 | 163.0 |
| B | 6 | 159 | 1687887 | 11130.4 | 797 | 780 | 151.6 |
| B | 10 | 247 | 27017 | 173.09 | 797 | 780 | 151.6 |
| B | 0 | 190 | 20793 | 132.03 | 797 | 780 | 151.6 |
| C | 0 | 10 | 357554 | 1968.99 | 770 | 779 | 181.2 |
| C | 14 | 238 | 194589 | 1069.61 | 770 | 779 | 181.2 |
| C | 3 | 233 | 163867 | 900.06 | 770 | 779 | 181.2 |
| D | 8 | 195 | 264289 | 1397.83 | 793 | 774 | 188.5 |
| D | 12 | 233 | 57475 | 300.77 | 793 | 774 | 188.5 |
| D | 2 | 250 | 37445 | 194.52 | 793 | 774 | 188.5 |
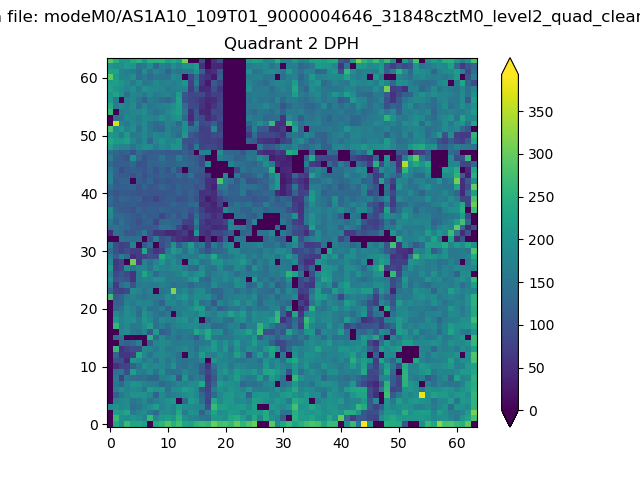
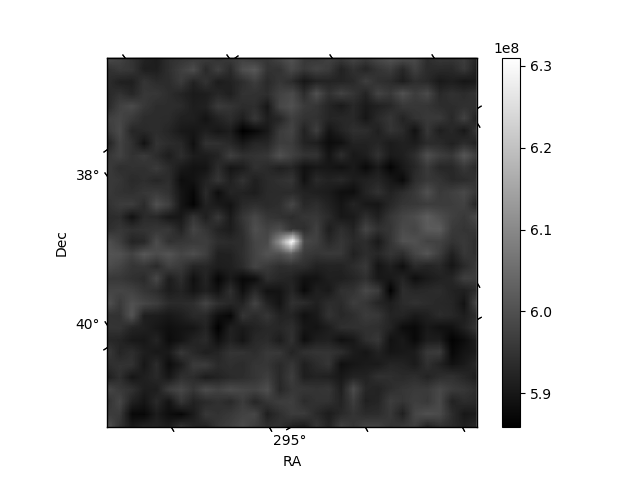
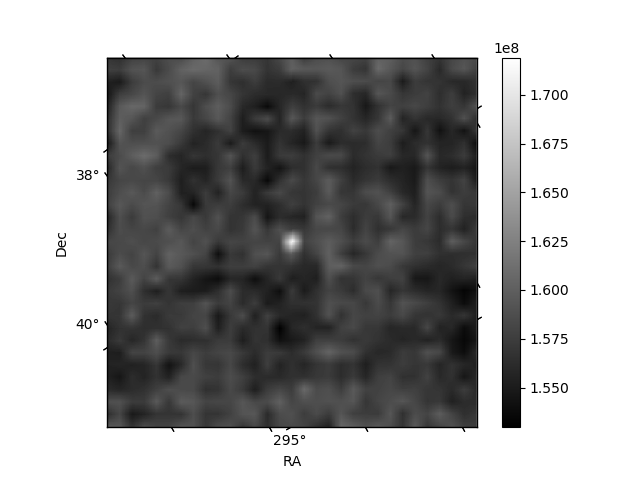
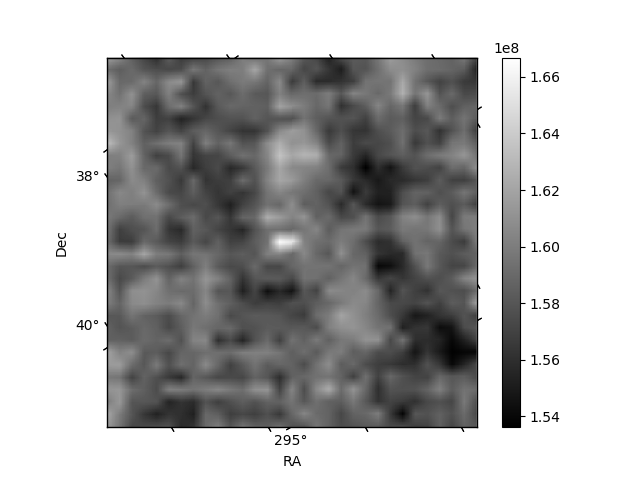
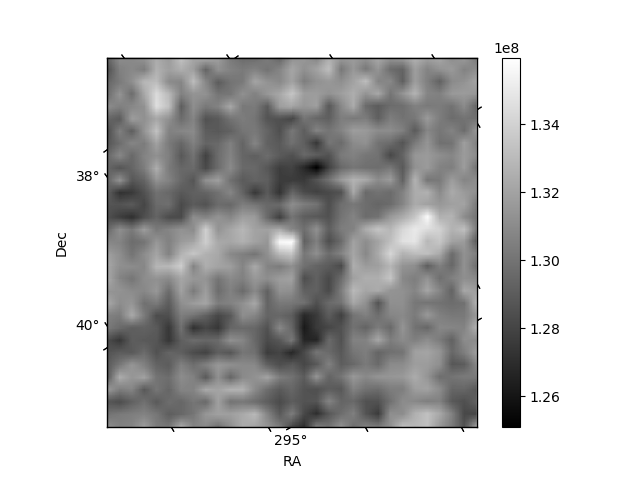
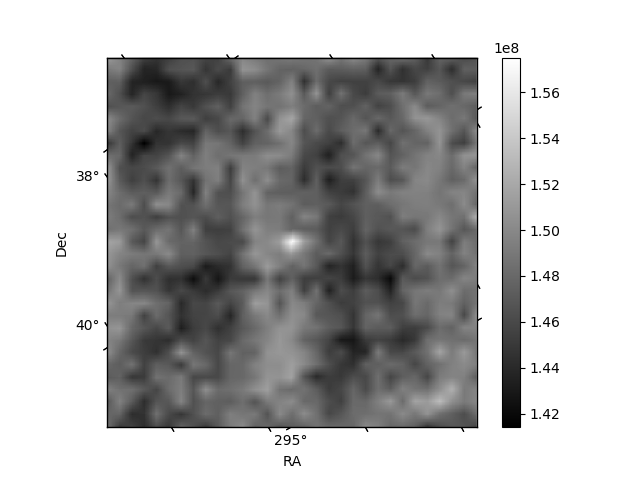
Histogram calculated using DETX and DETY for each event in the final _common_clean file
| Quadrant A | 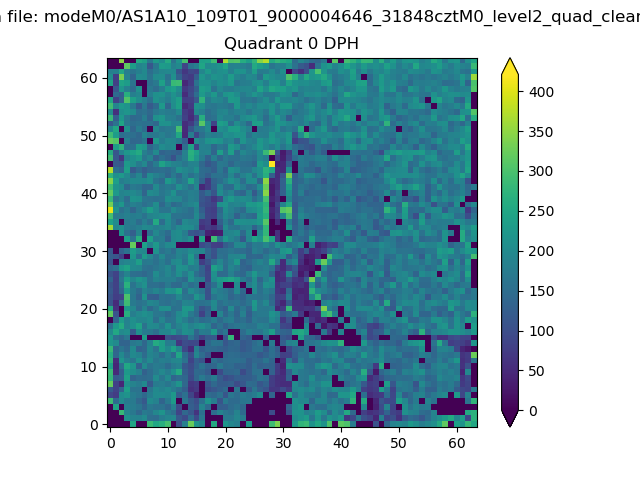 |
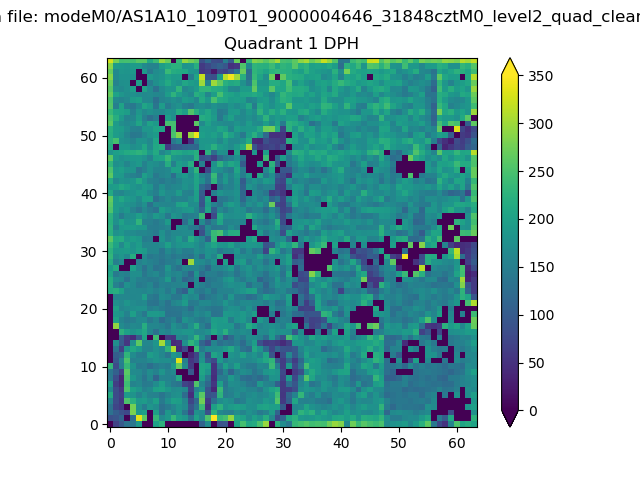 |
Quadrant B |
|---|---|---|---|
| Quadrant D | 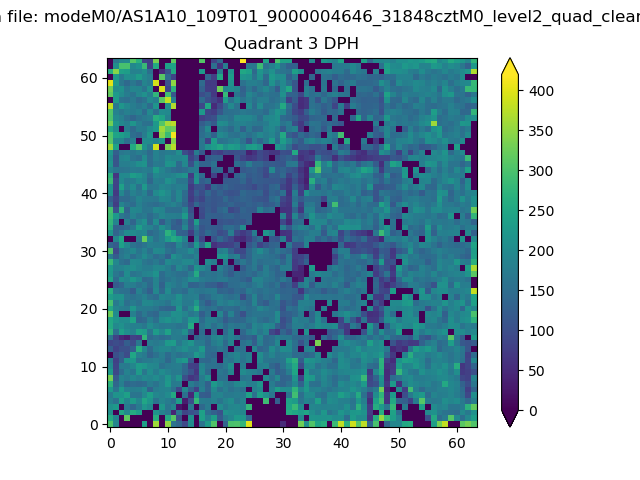 |
 |
Quadrant C |
| Plot type | Count rate plots | Images |
|---|---|---|
| Comparison with Poisson distribution Blue bars denote a histogram of data divided into 1 sec bins. Red curve is a Poisson curve with rate = median count rate of data. |
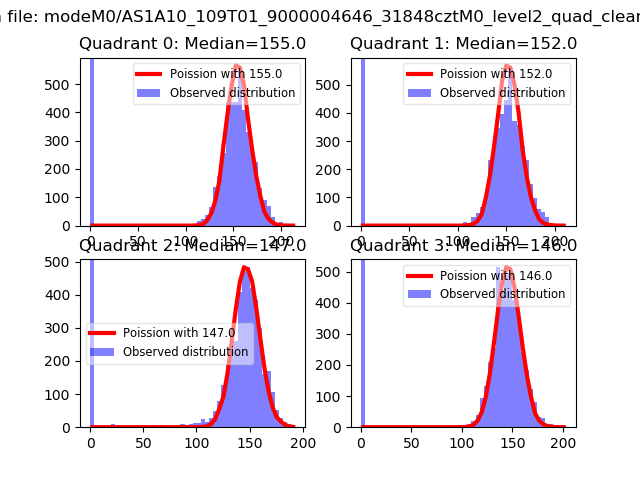 |
 |
| Quadrant-wise count rates Data is divided into 100 sec bins |
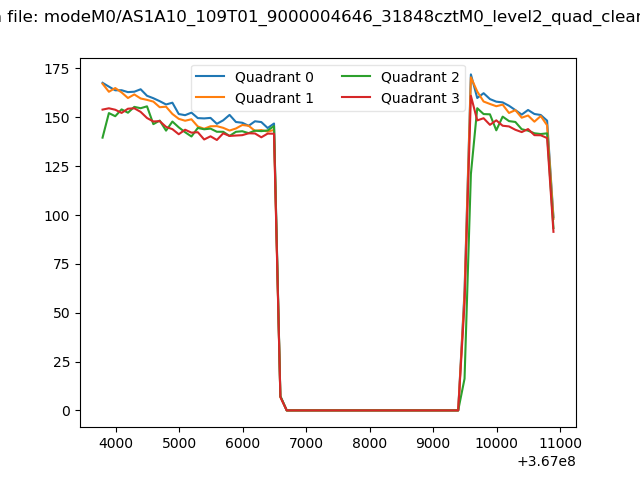 |
|
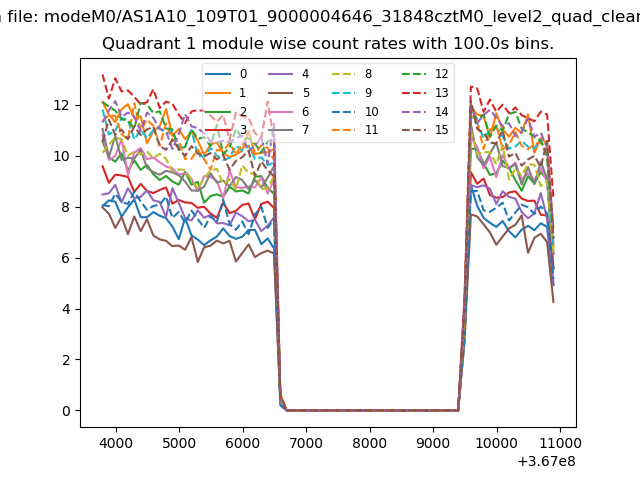
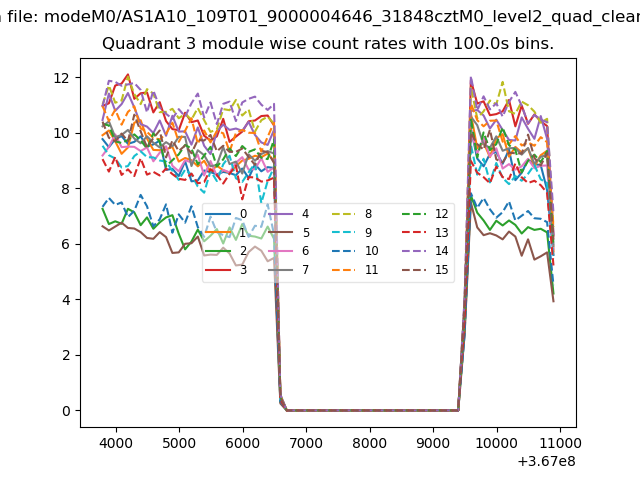
| Module-wise count rates for Quadrant A Data is divided into 100 sec bins |
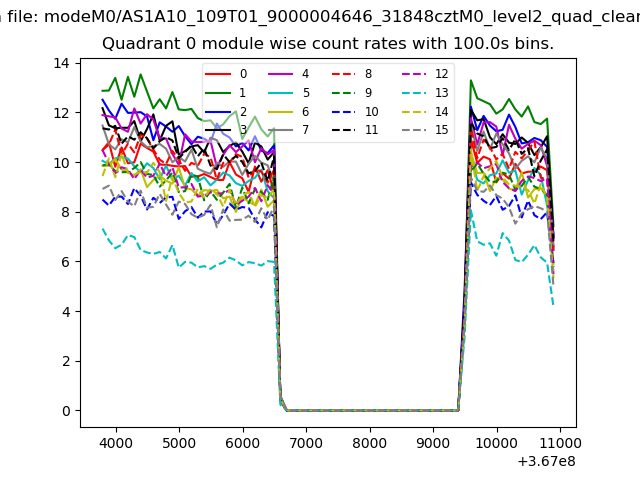 |
 |
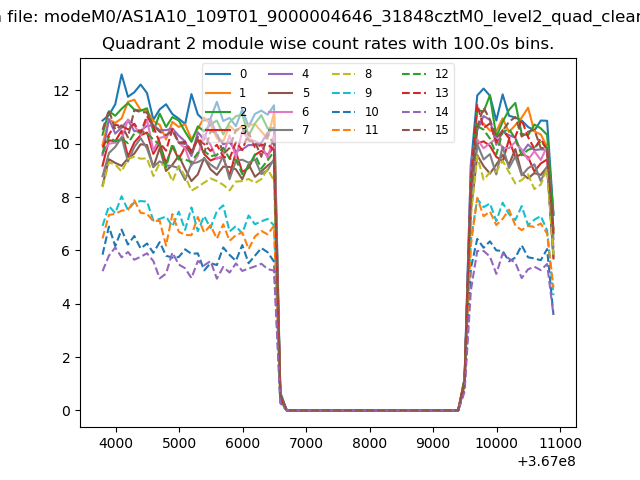
| Module-wise count rates for Quadrant B Data is divided into 100 sec bins |
 |
 |
| Module-wise count rates for Quadrant C Data is divided into 100 sec bins |
 |
 |
| Module-wise count rates for Quadrant D Data is divided into 100 sec bins |
 |
 |
| Parameter | Plot |
|---|---|
| CZT HV Monitor | 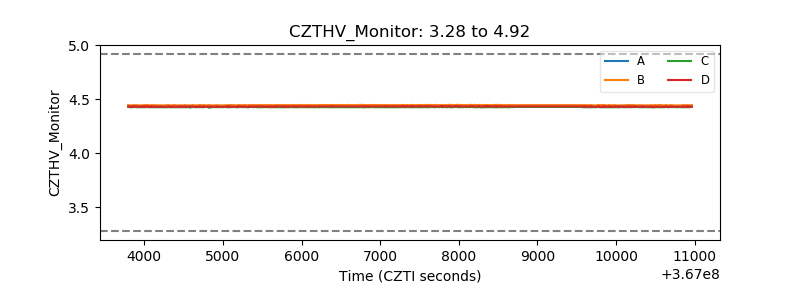 |
| D_VDD | 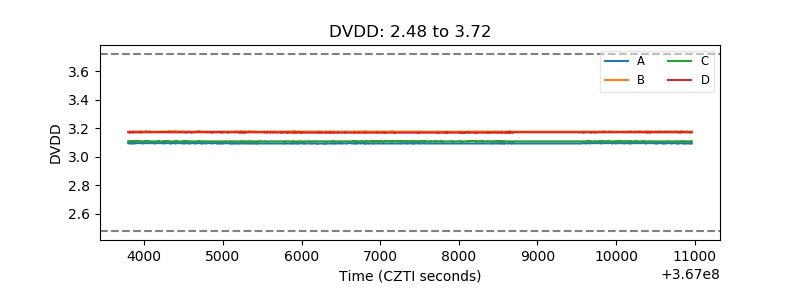 |
| Temperature 1 | 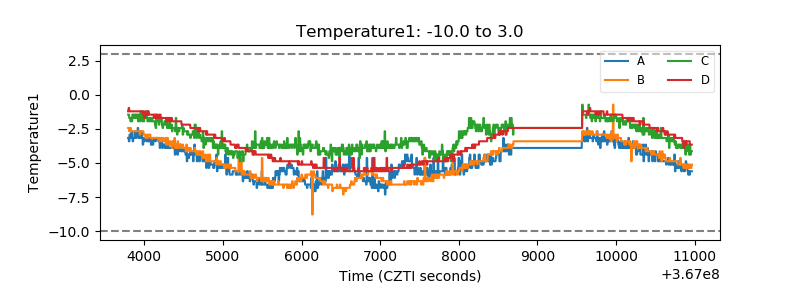 |
| Veto HV Monitor | 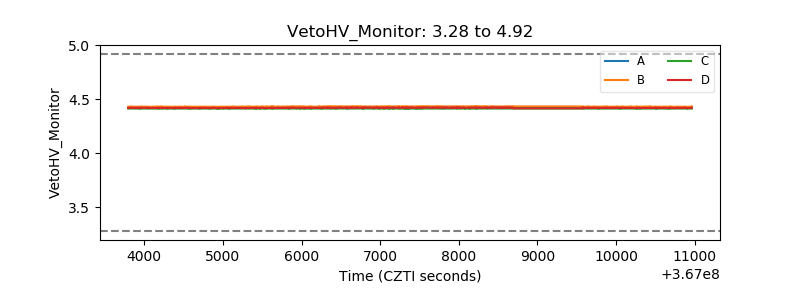 |
| Veto LLD | 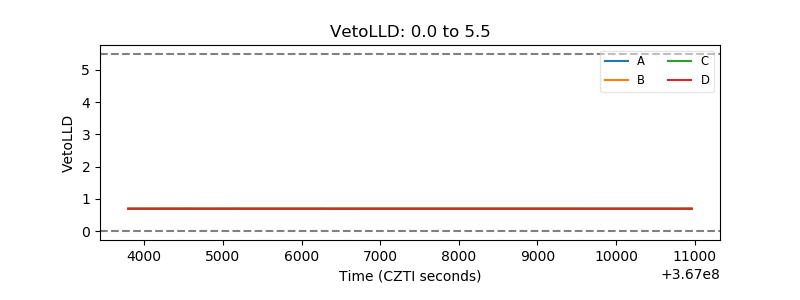 |
| Alpha Counter | 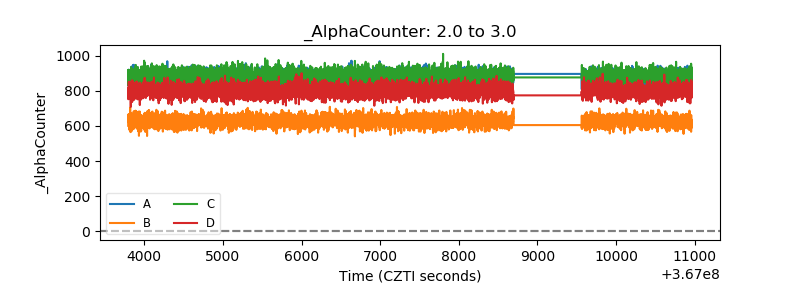 |
| _CPM_Rate | 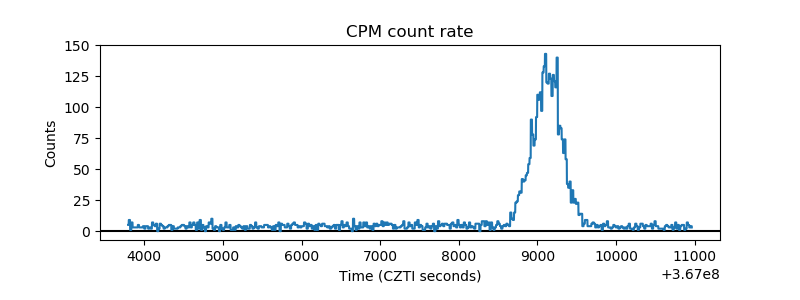 |
| CZT Counter | 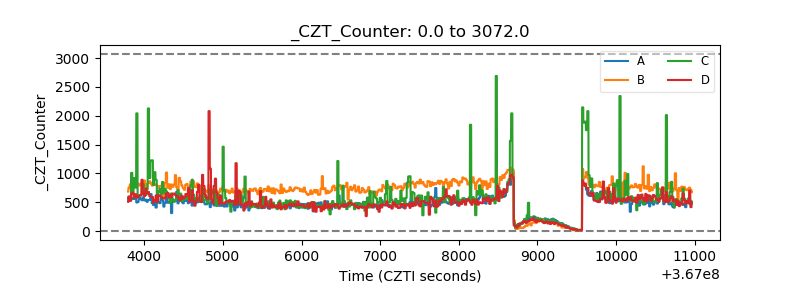 |
| +2.5 Volts monitor |  |
| +5 Volts monitor |  |
| _ROLL_ROT | 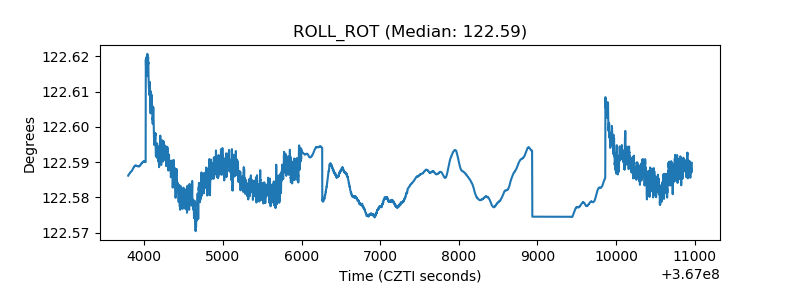 |
| _Roll_DEC | 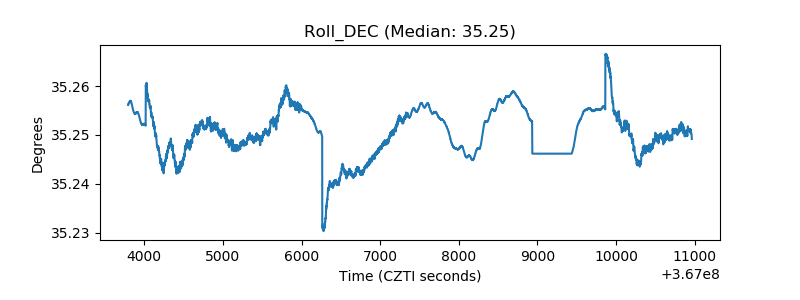 |
| _Roll_RA | 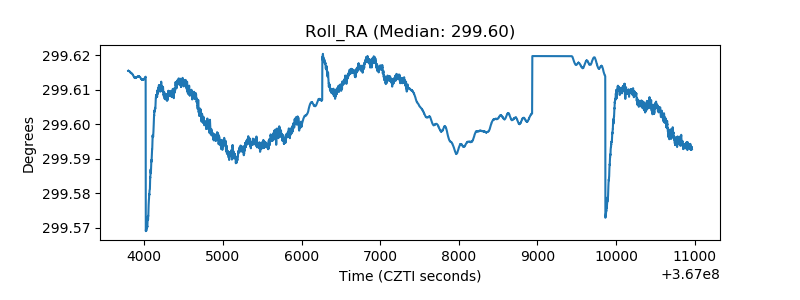 |
| Veto Counter | 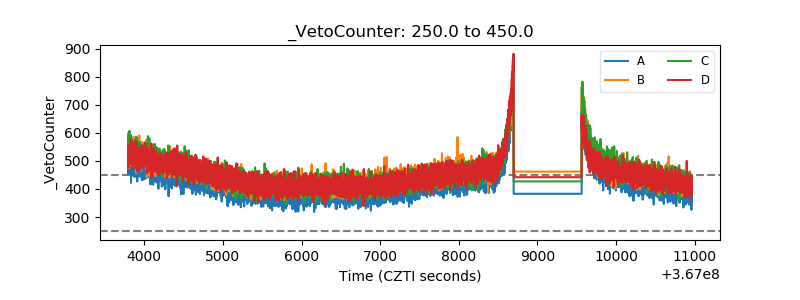 |