| Param | Original file | Final file |
|---|---|---|
| Filename | modeM0/AS1A10_109T01_9000004646_31849cztM0_level2.evt | modeM0/AS1A10_109T01_9000004646_31849cztM0_level2_quad_clean.evt |
| Size (bytes) | 593,075,520 | 115,945,920 |
| Size | 565.6 MB | 110.6 MB |
| Events in quadrant A | 3,667,304 | 779,481 |
| Events in quadrant B | 5,643,437 | 766,661 |
| Events in quadrant C | 4,151,666 | 729,418 |
| Events in quadrant D | 4,002,823 | 726,137 |
| Mode SS | |||
|---|---|---|---|
| Quadrant | BADHDUFLAG | Total packets | Discarded packets |
| A | 0 | 148 | 0 |
| B | 0 | 148 | 0 |
| C | 0 | 148 | 0 |
| D | 0 | 148 | 0 |
| Mode M0 | |||
|---|---|---|---|
| Quadrant | BADHDUFLAG | Total packets | Discarded packets |
| A | 0 | 15498 | 2 |
| B | 0 | 22333 | 2 |
| C | 0 | 16962 | 2 |
| D | 0 | 16577 | 2 |
| Mode M9 | |||
|---|---|---|---|
| Quadrant | BADHDUFLAG | Total packets | Discarded packets |
| A | 0 | 5 | 0 |
| B | 0 | 6 | 0 |
| C | 0 | 6 | 0 |
| D | 0 | 6 | 0 |
| Quadrant | Total seconds | Saturated seconds | Saturation percentage |
|---|---|---|---|
| A | 7324 | 80 | 1.092299% |
| B | 7324 | 172 | 2.348443% |
| C | 7324 | 350 | 4.778809% |
| D | 7324 | 106 | 1.447297% |
Noise dominated data is calculated using 1-second bins in cleaned event files. If a bin has >2000 counts, and if more than 50% of those come from <1% of pixels, then it is considered to be noise-dominated and hence unusable.
| Quadrant | # 1 sec bins | Bins with >0 counts | Bins with >2000 counts | High rate bins dominated by noise | Noise dominated (total time) | Noise dominated (detector-on time) | Marked lightcurve |
|---|---|---|---|---|---|---|---|
| A | 7729 | 7325 | 0 | 0 | 0.00% | 0.00% |  |
| B | 7729 | 7325 | 6 | 6 | 0.08% | 0.08% |  |
| C | 7729 | 7325 | 60 | 60 | 0.78% | 0.82% |  |
| D | 7729 | 7325 | 55 | 55 | 0.71% | 0.75% |  |
Top three noisy pixels from each quadrant. If the there are fewer than three noisy pixels in the level2.evt file, extra rows are filled as -1
| Pixel properties | Quadrant properties | ||||||
|---|---|---|---|---|---|---|---|
| Quadrant | DetID | PixID | Counts | Sigma | Mean | Median | Sigma |
| A | 13 | 6 | 14781 | 72.56 | 947 | 930 | 190.9 |
| A | 13 | 254 | 12869 | 62.54 | 947 | 930 | 190.9 |
| A | 3 | 137 | 9773 | 46.32 | 947 | 930 | 190.9 |
| B | 6 | 159 | 1916243 | 10625.02 | 929 | 907 | 180.3 |
| B | 10 | 247 | 34402 | 185.81 | 929 | 907 | 180.3 |
| B | 10 | 245 | 25944 | 138.89 | 929 | 907 | 180.3 |
| C | 0 | 10 | 324793 | 1534.41 | 895 | 904 | 211.1 |
| C | 14 | 238 | 170587 | 803.87 | 895 | 904 | 211.1 |
| C | 3 | 233 | 95158 | 446.52 | 895 | 904 | 211.1 |
| D | 8 | 195 | 197834 | 893.68 | 916 | 895 | 220.4 |
| D | 2 | 120 | 123435 | 556.07 | 916 | 895 | 220.4 |
| D | 12 | 233 | 85426 | 383.59 | 916 | 895 | 220.4 |
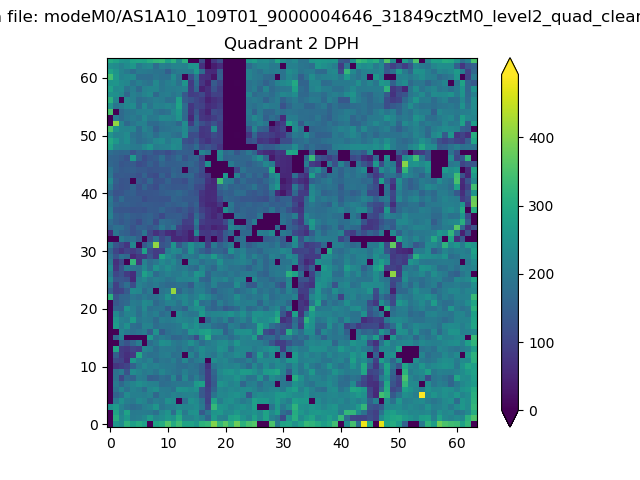
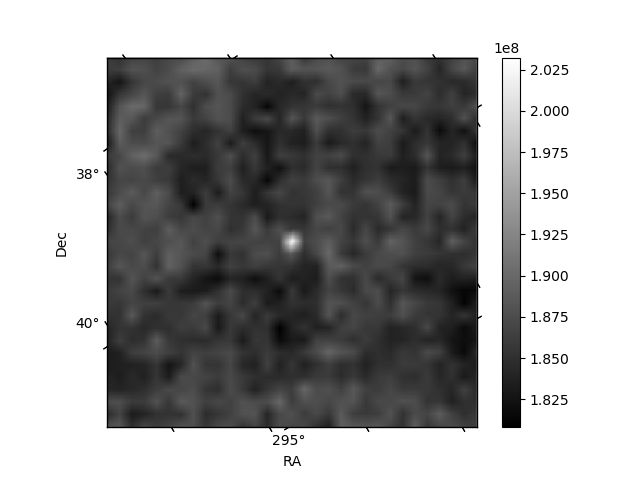
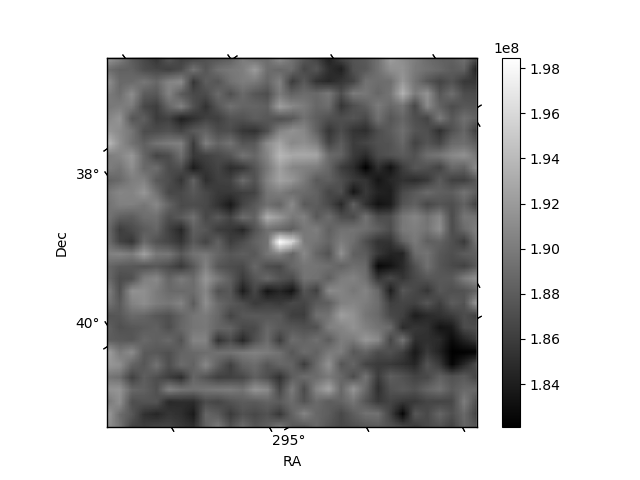
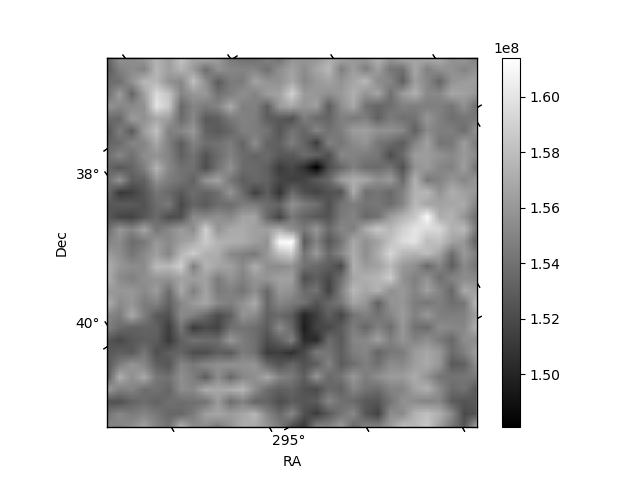
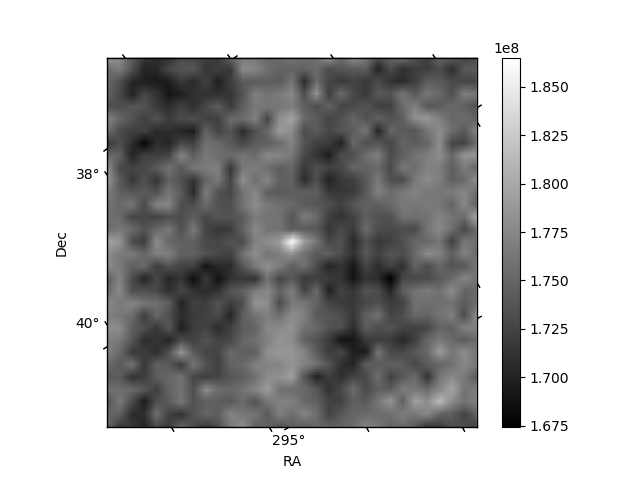
Histogram calculated using DETX and DETY for each event in the final _common_clean file
| Quadrant A | 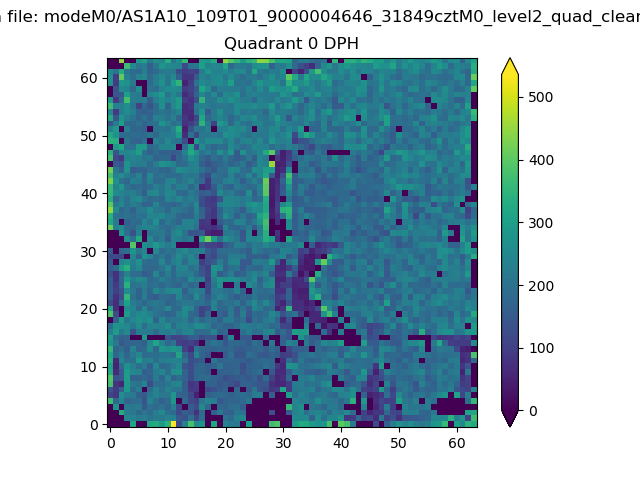 |
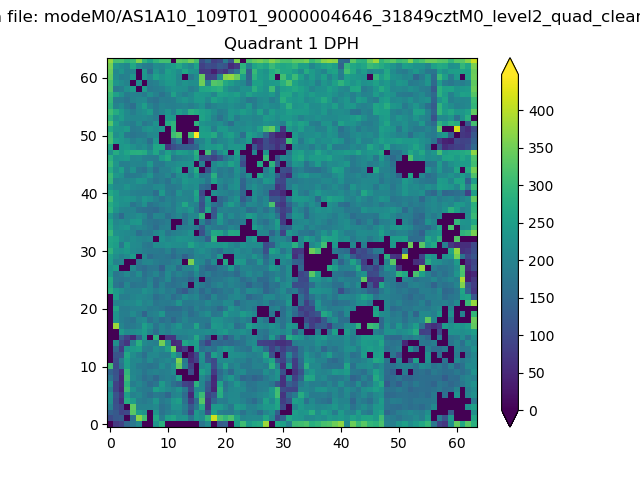 |
Quadrant B |
|---|---|---|---|
| Quadrant D | 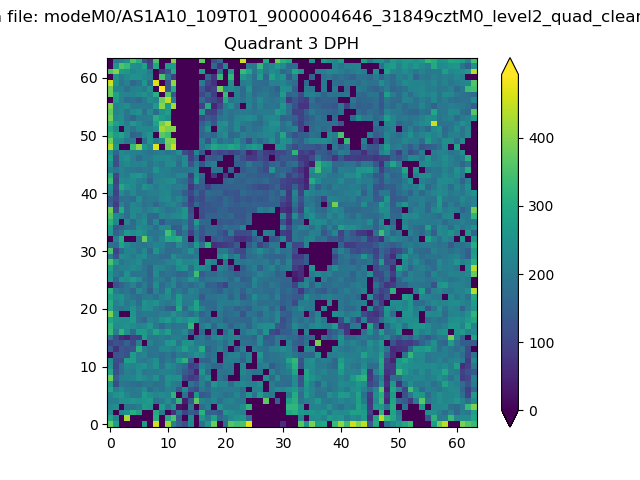 |
 |
Quadrant C |
| Plot type | Count rate plots | Images |
|---|---|---|
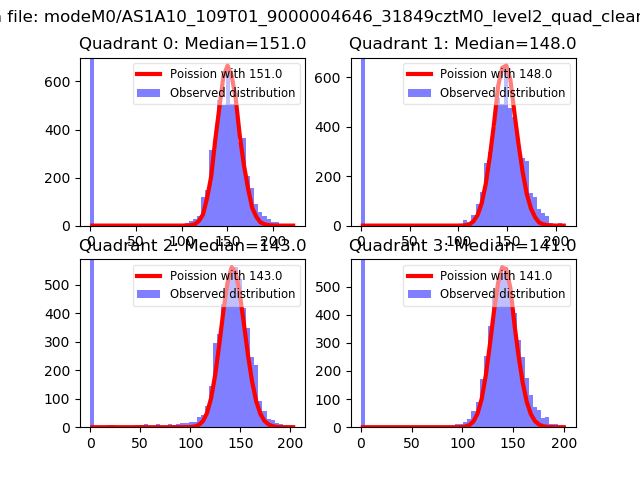
| Comparison with Poisson distribution Blue bars denote a histogram of data divided into 1 sec bins. Red curve is a Poisson curve with rate = median count rate of data. |
 |
 |
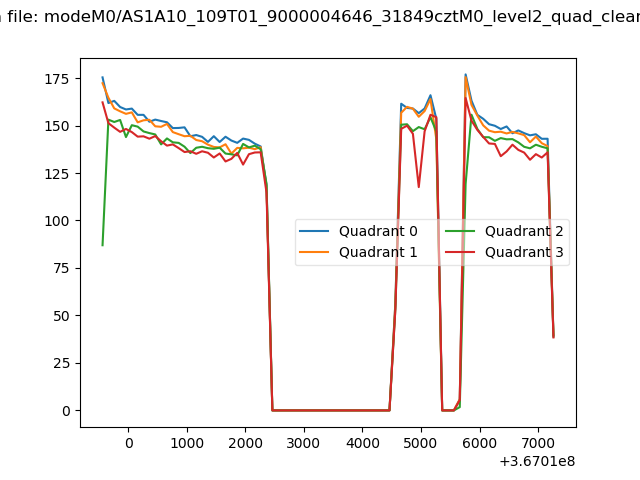
| Quadrant-wise count rates Data is divided into 100 sec bins |
 |
|
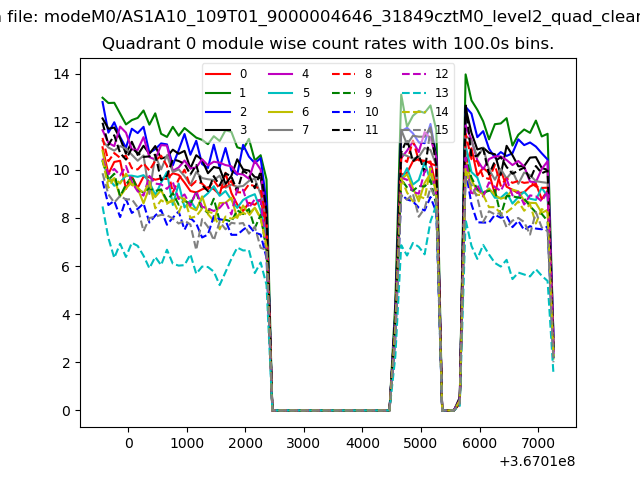
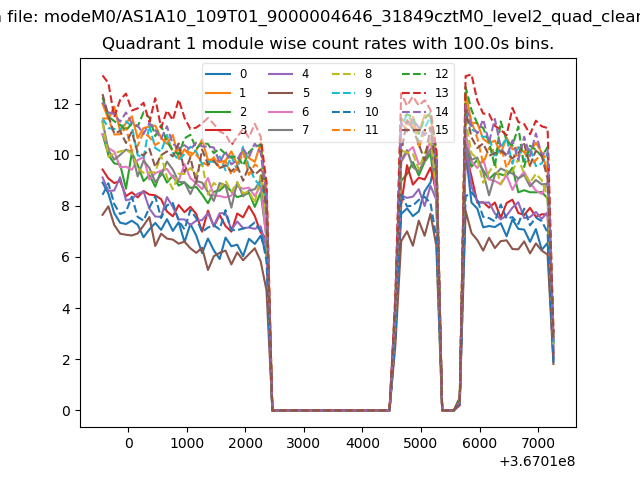
| Module-wise count rates for Quadrant A Data is divided into 100 sec bins |
 |
 |
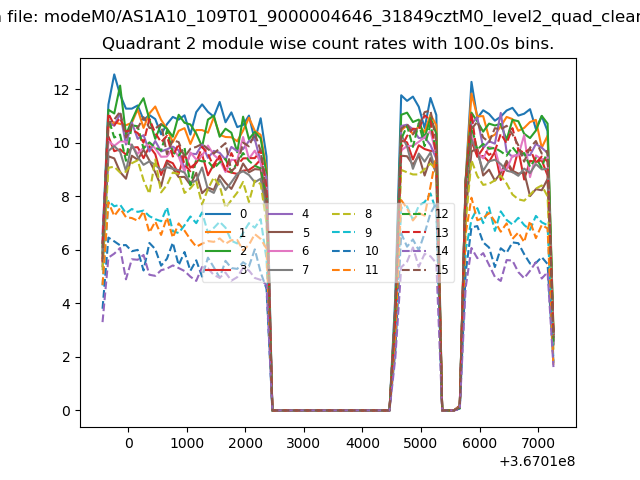
| Module-wise count rates for Quadrant B Data is divided into 100 sec bins |
 |
 |
| Module-wise count rates for Quadrant C Data is divided into 100 sec bins |
 |
 |
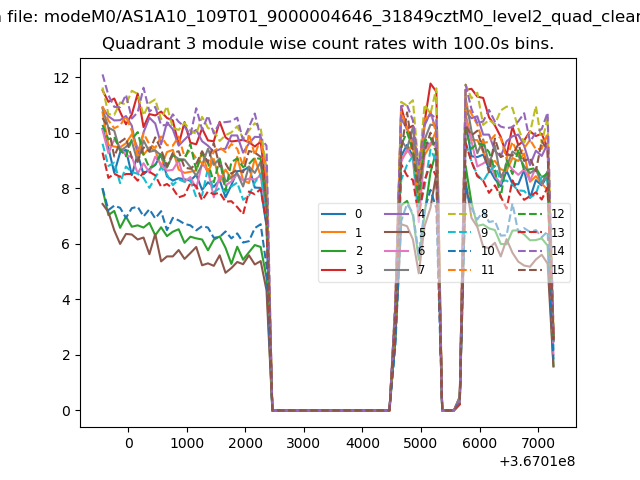
| Module-wise count rates for Quadrant D Data is divided into 100 sec bins |
 |
 |
| Parameter | Plot |
|---|---|
| CZT HV Monitor | 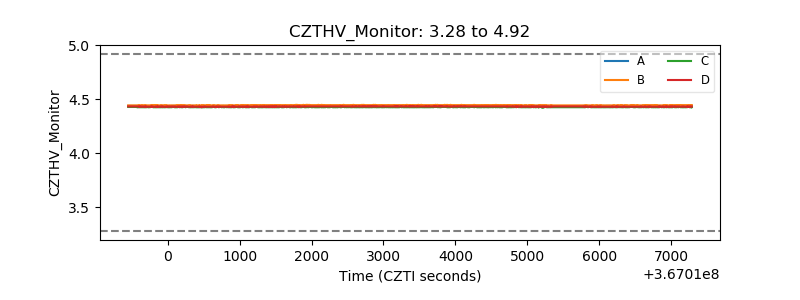 |
| D_VDD | 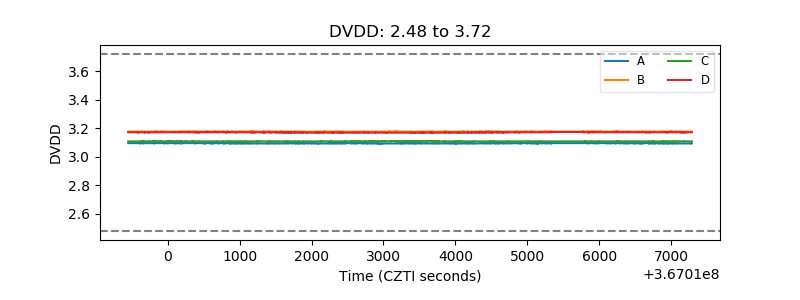 |
| Temperature 1 | 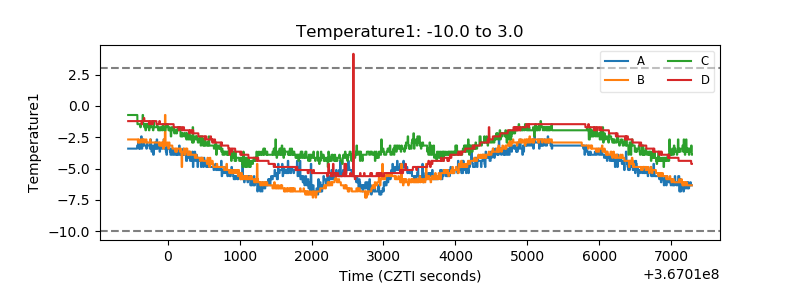 |
| Veto HV Monitor | 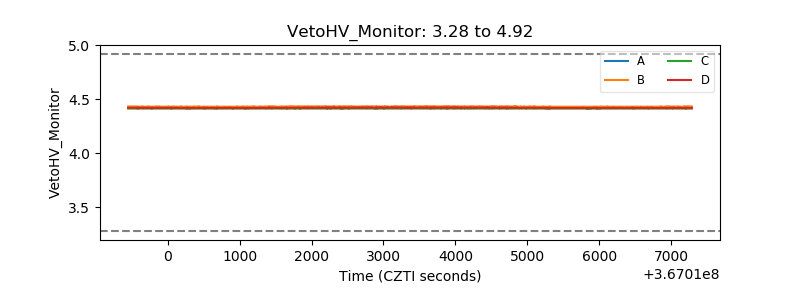 |
| Veto LLD | 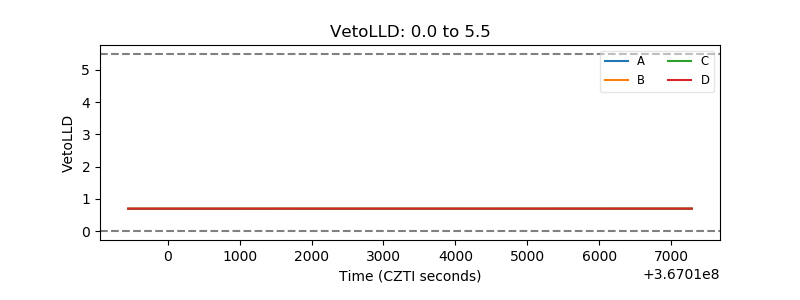 |
| Alpha Counter | 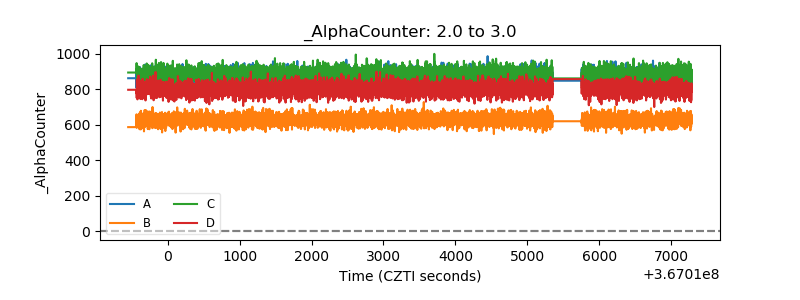 |
| _CPM_Rate | 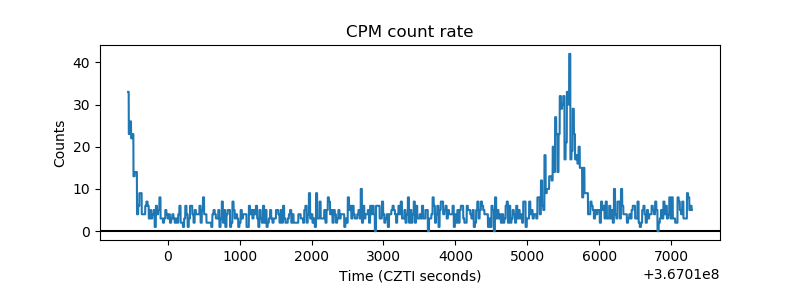 |
| CZT Counter | 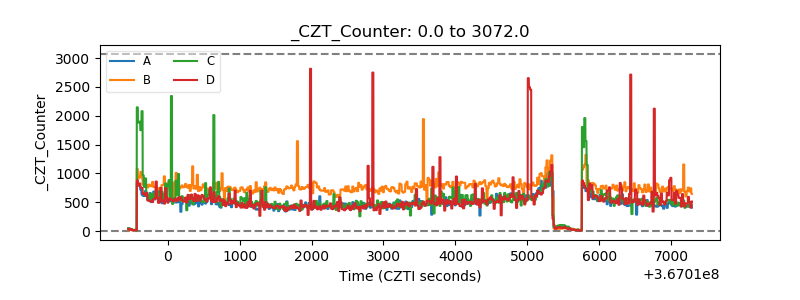 |
| +2.5 Volts monitor |  |
| +5 Volts monitor |  |
| _ROLL_ROT | 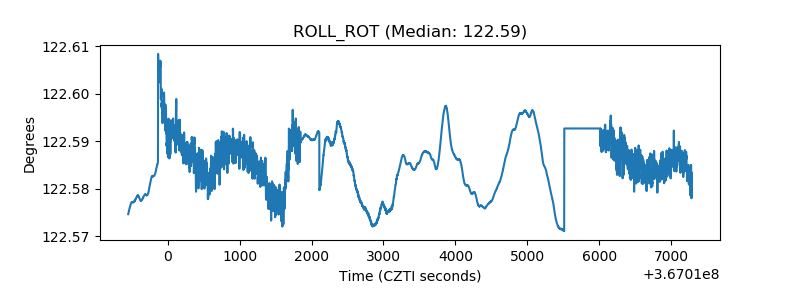 |
| _Roll_DEC | 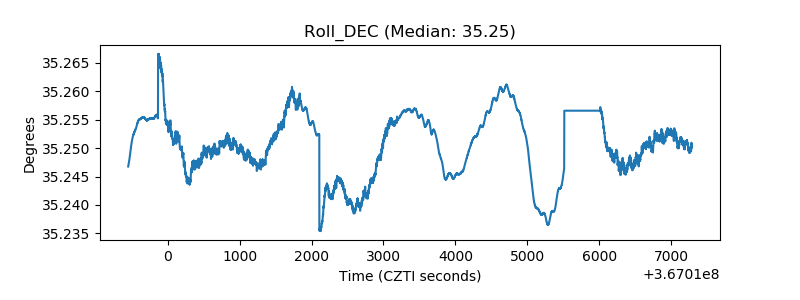 |
| _Roll_RA | 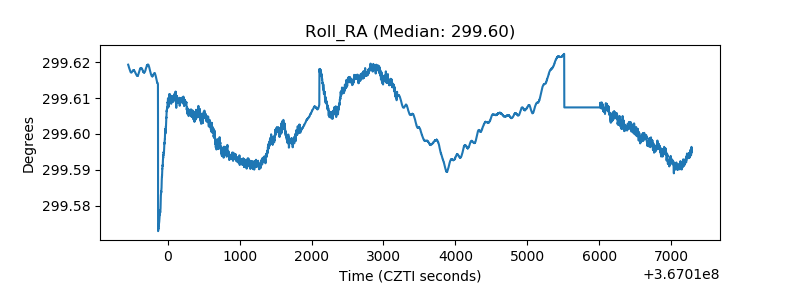 |
| Veto Counter | 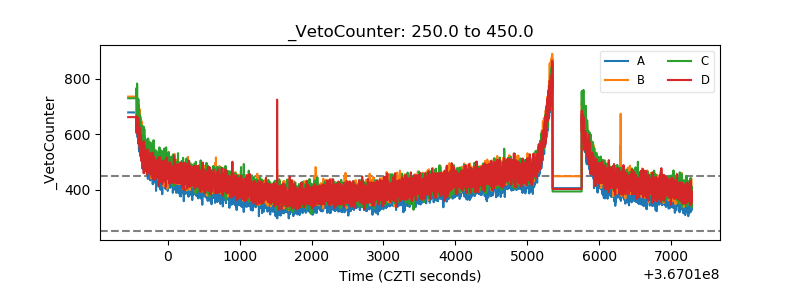 |