| Param | Original file | Final file |
|---|---|---|
| Filename | modeM0/AS1A10_109T01_9000004646_31857cztM0_level2.evt | modeM0/AS1A10_109T01_9000004646_31857cztM0_level2_quad_clean.evt |
| Size (bytes) | 578,476,800 | 81,008,640 |
| Size | 551.7 MB | 77.3 MB |
| Events in quadrant A | 3,636,171 | 513,224 |
| Events in quadrant B | 5,294,888 | 508,597 |
| Events in quadrant C | 4,411,091 | 485,517 |
| Events in quadrant D | 3,724,582 | 479,649 |
| Mode SS | |||
|---|---|---|---|
| Quadrant | BADHDUFLAG | Total packets | Discarded packets |
| A | 0 | 140 | 0 |
| B | 0 | 140 | 0 |
| C | 0 | 140 | 0 |
| D | 0 | 140 | 0 |
| Mode M0 | |||
|---|---|---|---|
| Quadrant | BADHDUFLAG | Total packets | Discarded packets |
| A | 0 | 14713 | 2 |
| B | 0 | 20425 | 2 |
| C | 0 | 17268 | 6 |
| D | 0 | 15039 | 2 |
| Mode M9 | |||
|---|---|---|---|
| Quadrant | BADHDUFLAG | Total packets | Discarded packets |
| A | 0 | 21 | 0 |
| B | 0 | 21 | 0 |
| C | 0 | 21 | 0 |
| D | 0 | 21 | 0 |
| Quadrant | Total seconds | Saturated seconds | Saturation percentage |
|---|---|---|---|
| A | 6678 | 96 | 1.437556% |
| B | 6679 | 183 | 2.739931% |
| C | 6678 | 354 | 5.300988% |
| D | 6678 | 76 | 1.138065% |
Noise dominated data is calculated using 1-second bins in cleaned event files. If a bin has >2000 counts, and if more than 50% of those come from <1% of pixels, then it is considered to be noise-dominated and hence unusable.
| Quadrant | # 1 sec bins | Bins with >0 counts | Bins with >2000 counts | High rate bins dominated by noise | Noise dominated (total time) | Noise dominated (detector-on time) | Marked lightcurve |
|---|---|---|---|---|---|---|---|
| A | 8823 | 6680 | 0 | 0 | 0.00% | 0.00% | 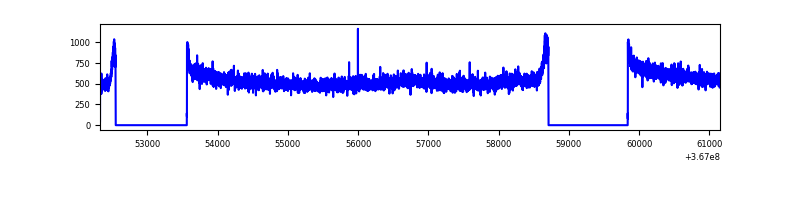 |
| B | 8824 | 6681 | 0 | 0 | 0.00% | 0.00% | 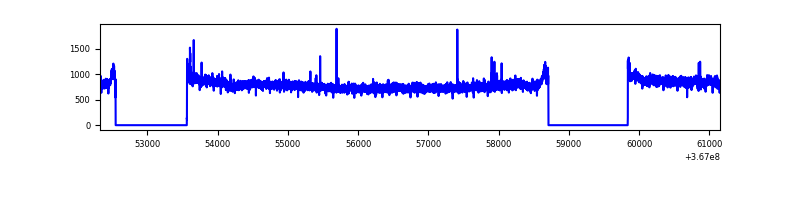 |
| C | 8823 | 6680 | 130 | 130 | 1.47% | 1.95% | 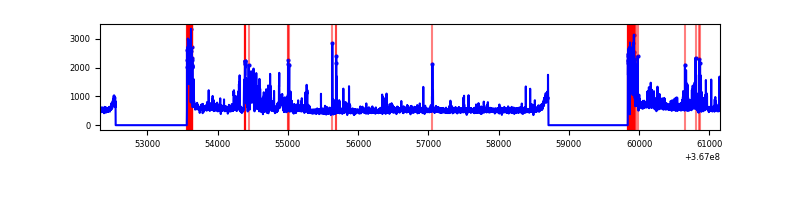 |
| D | 8823 | 6680 | 9 | 9 | 0.10% | 0.13% | 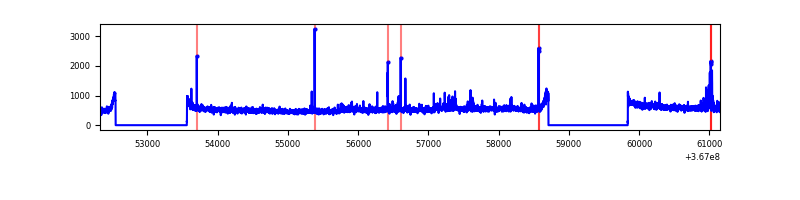 |
Top three noisy pixels from each quadrant. If the there are fewer than three noisy pixels in the level2.evt file, extra rows are filled as -1
| Pixel properties | Quadrant properties | ||||||
|---|---|---|---|---|---|---|---|
| Quadrant | DetID | PixID | Counts | Sigma | Mean | Median | Sigma |
| A | 13 | 6 | 59225 | 314.99 | 929 | 914 | 185.1 |
| A | 13 | 254 | 10681 | 52.76 | 929 | 914 | 185.1 |
| A | 3 | 137 | 8931 | 43.31 | 929 | 914 | 185.1 |
| B | 6 | 159 | 1719301 | 10010.29 | 905 | 881 | 171.7 |
| B | 12 | 111 | 20953 | 116.93 | 905 | 881 | 171.7 |
| B | 11 | 111 | 19395 | 107.85 | 905 | 881 | 171.7 |
| C | 0 | 10 | 855389 | 4267.85 | 855 | 860 | 200.2 |
| C | 14 | 238 | 144189 | 715.84 | 855 | 860 | 200.2 |
| C | 3 | 233 | 42317 | 207.05 | 855 | 860 | 200.2 |
| D | 8 | 195 | 164693 | 793.89 | 884 | 865 | 206.4 |
| D | 10 | 203 | 100551 | 483.07 | 884 | 865 | 206.4 |
| D | 12 | 79 | 41309 | 195.99 | 884 | 865 | 206.4 |
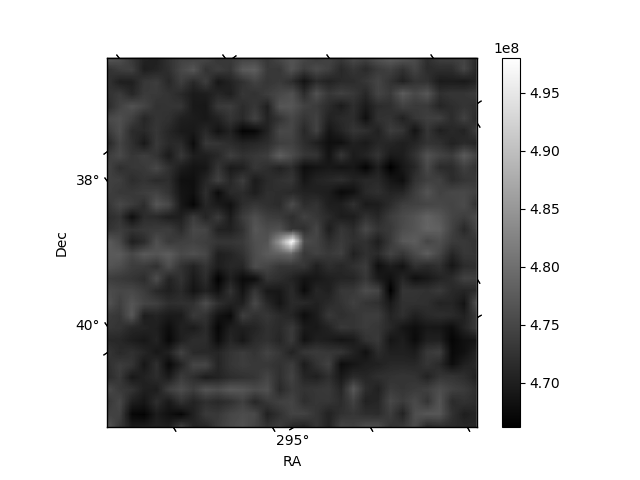
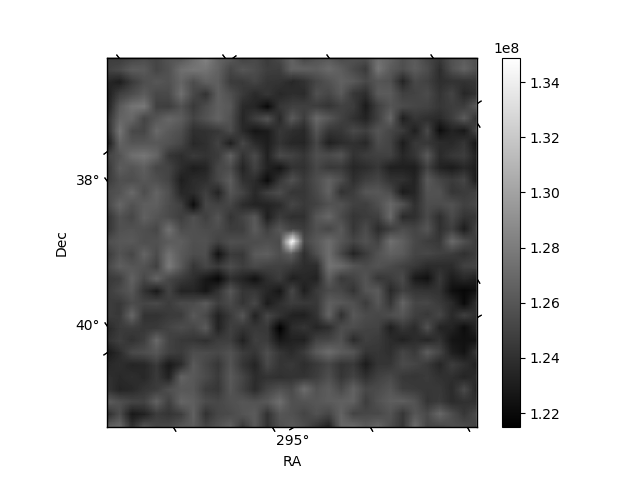
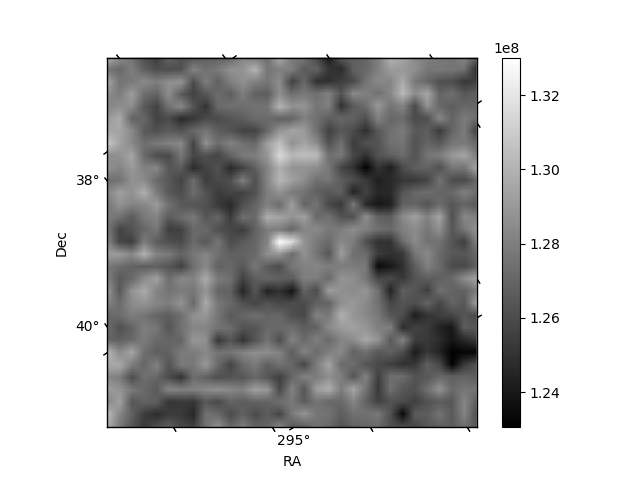
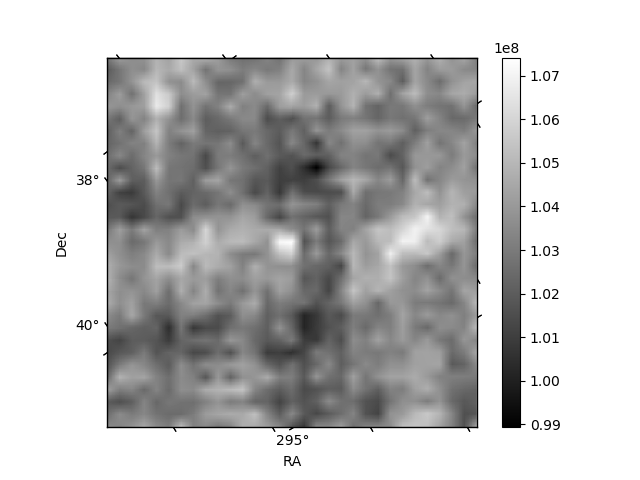
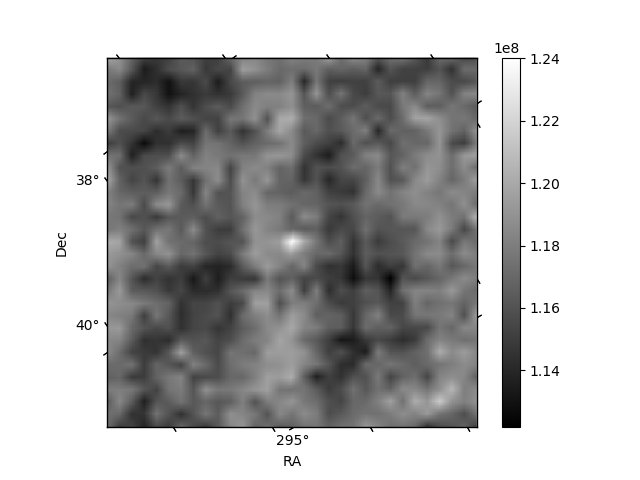
Histogram calculated using DETX and DETY for each event in the final _common_clean file
| Quadrant A | 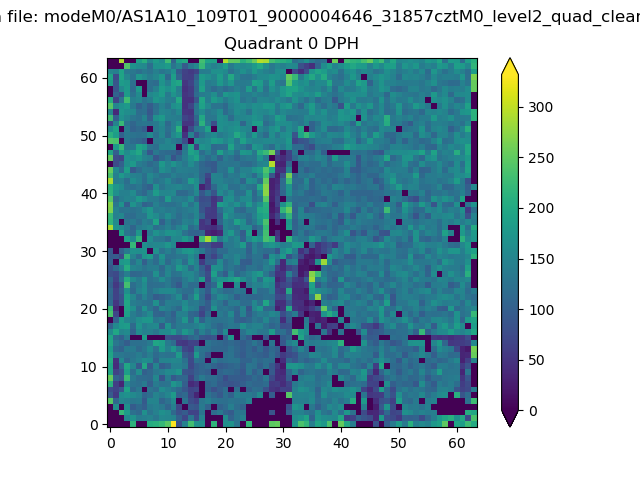 |
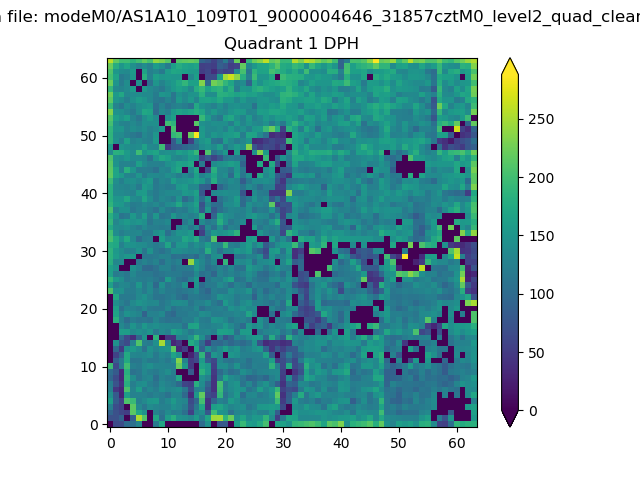 |
Quadrant B |
|---|---|---|---|
| Quadrant D | 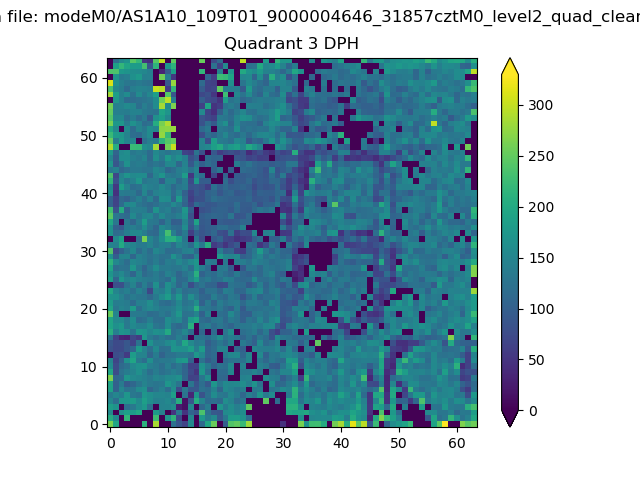 |
 |
Quadrant C |
| Plot type | Count rate plots | Images |
|---|---|---|
| Comparison with Poisson distribution Blue bars denote a histogram of data divided into 1 sec bins. Red curve is a Poisson curve with rate = median count rate of data. |
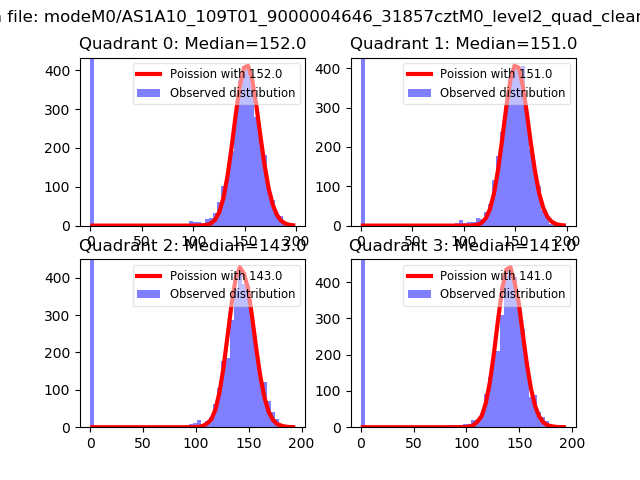 |
 |
| Quadrant-wise count rates Data is divided into 100 sec bins |
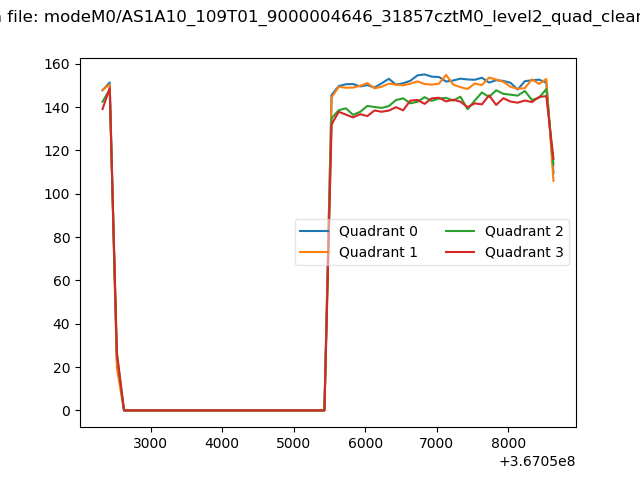 |
|
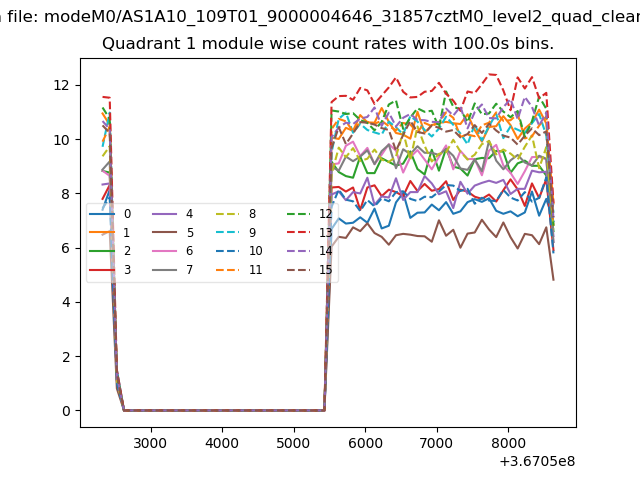
| Module-wise count rates for Quadrant A Data is divided into 100 sec bins |
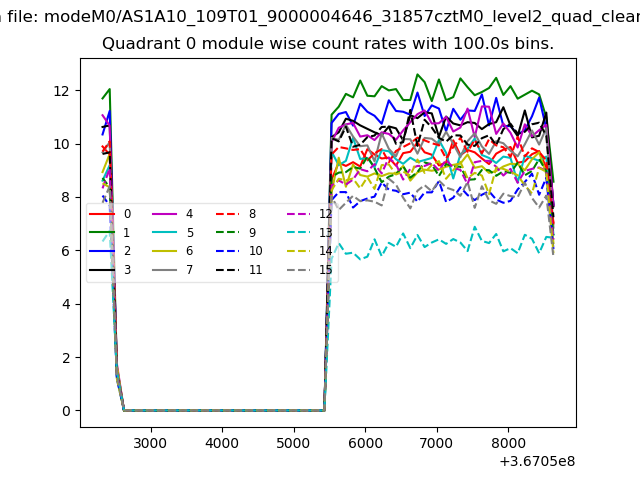 |
 |
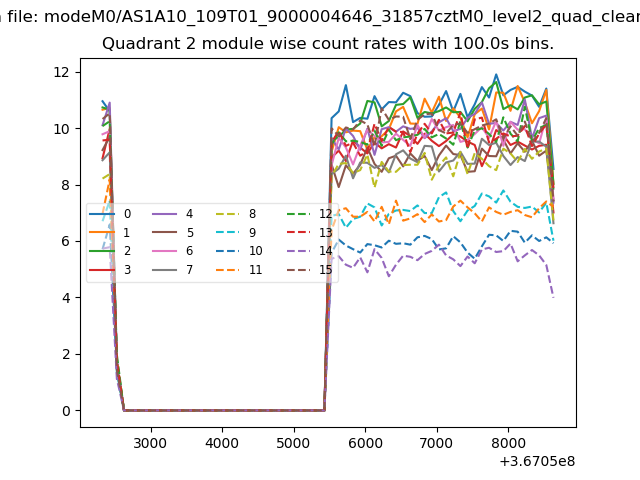
| Module-wise count rates for Quadrant B Data is divided into 100 sec bins |
 |
 |
| Module-wise count rates for Quadrant C Data is divided into 100 sec bins |
 |
 |
| Module-wise count rates for Quadrant D Data is divided into 100 sec bins |
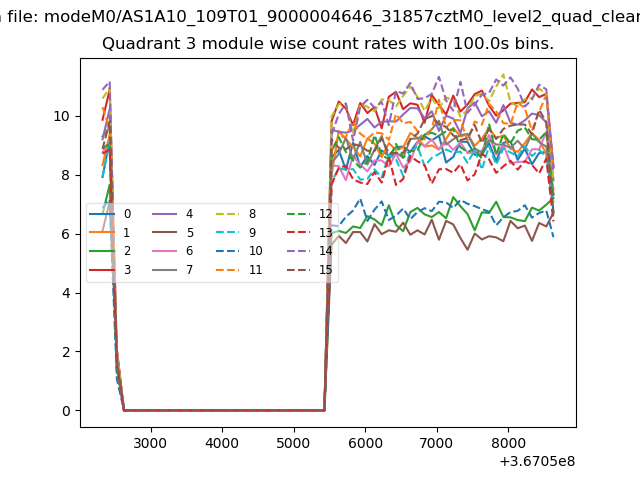 |
 |
| Parameter | Plot |
|---|---|
| CZT HV Monitor | 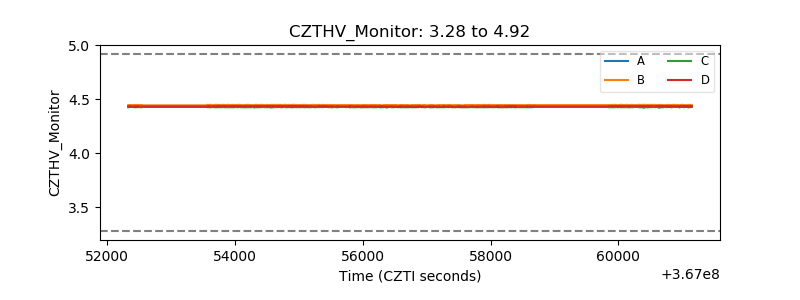 |
| D_VDD | 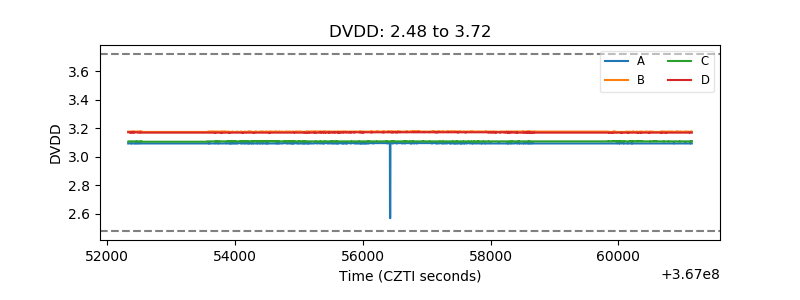 |
| Temperature 1 | 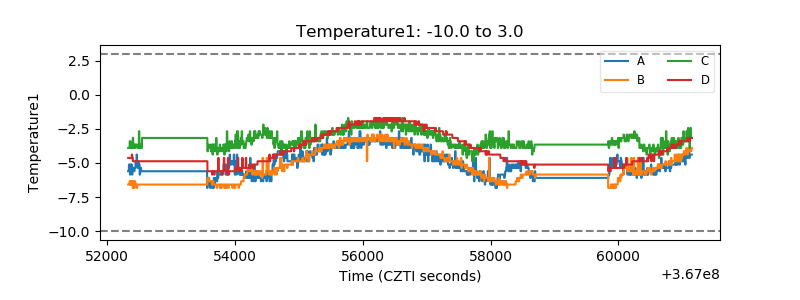 |
| Veto HV Monitor | 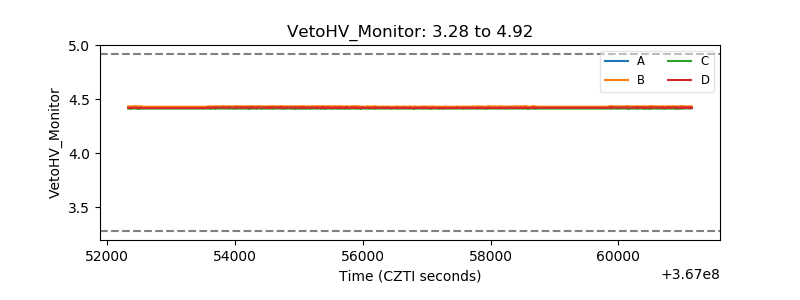 |
| Veto LLD | 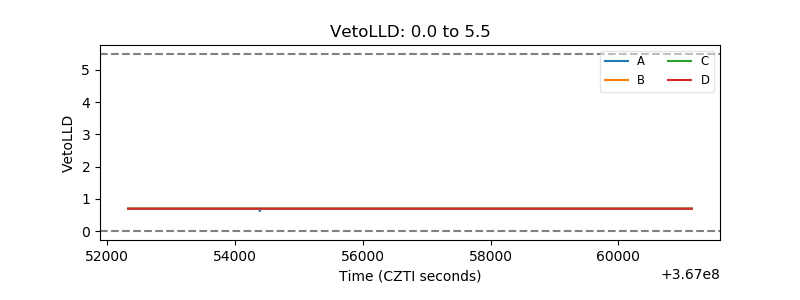 |
| Alpha Counter | 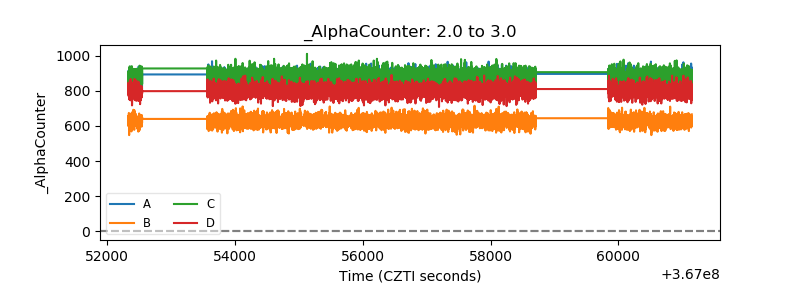 |
| _CPM_Rate | 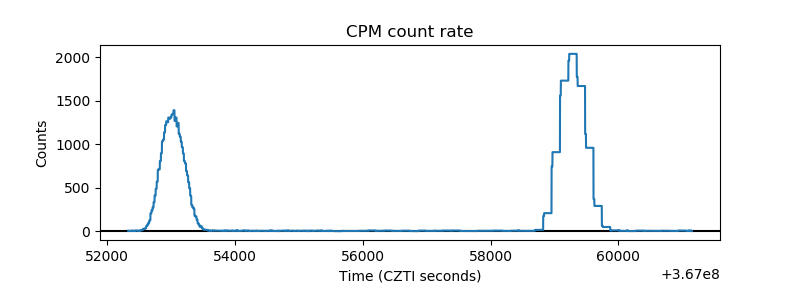 |
| CZT Counter | 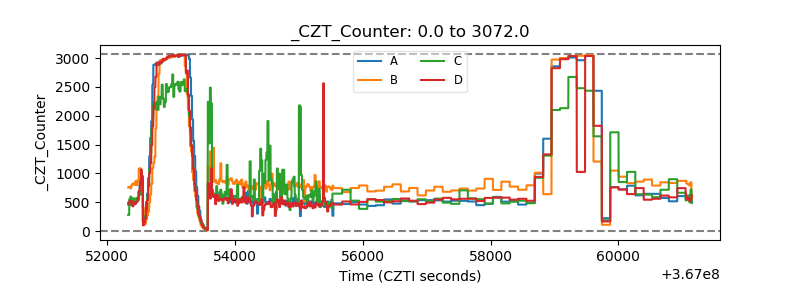 |
| +2.5 Volts monitor |  |
| +5 Volts monitor | 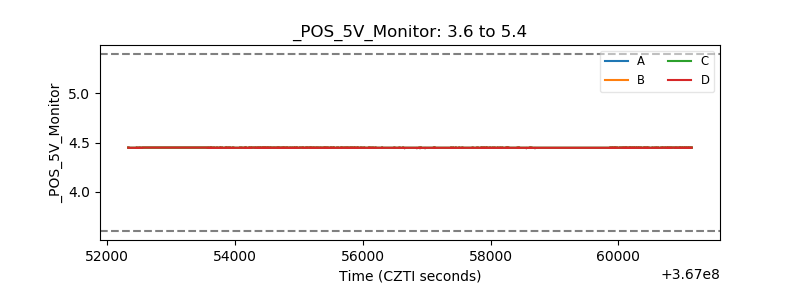 |
| _ROLL_ROT | 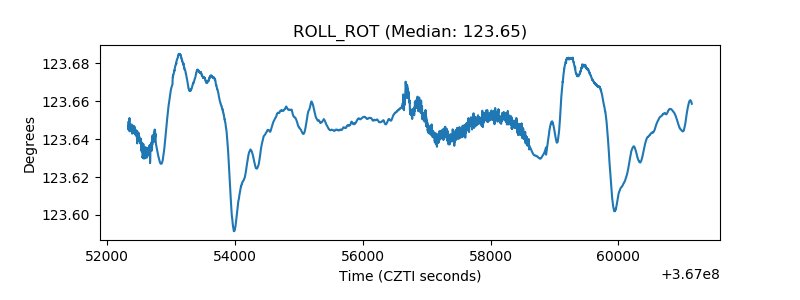 |
| _Roll_DEC | 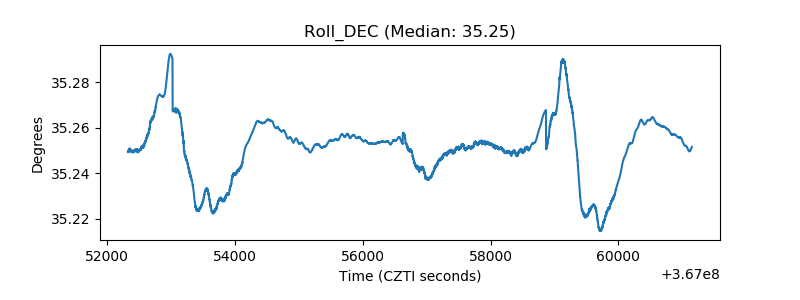 |
| _Roll_RA | 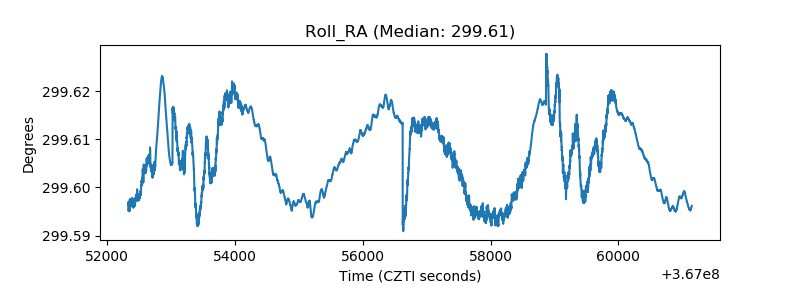 |
| Veto Counter | 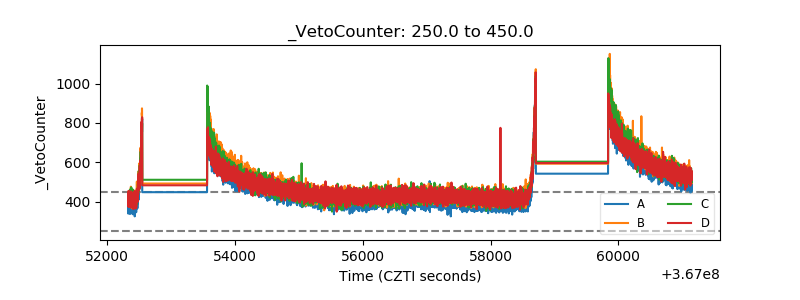 |