| Param | Original file | Final file |
|---|---|---|
| Filename | modeM0/AS1A10_109T01_9000004646_31860cztM0_level2.evt | modeM0/AS1A10_109T01_9000004646_31860cztM0_level2_quad_clean.evt |
| Size (bytes) | 536,880,960 | 122,232,960 |
| Size | 512.0 MB | 116.6 MB |
| Events in quadrant A | 3,433,559 | 853,293 |
| Events in quadrant B | 4,862,156 | 840,442 |
| Events in quadrant C | 3,869,678 | 801,404 |
| Events in quadrant D | 3,688,122 | 788,275 |
| Mode SS | |||
|---|---|---|---|
| Quadrant | BADHDUFLAG | Total packets | Discarded packets |
| A | 0 | 122 | 0 |
| B | 0 | 122 | 0 |
| C | 0 | 122 | 0 |
| D | 0 | 122 | 0 |
| Mode M0 | |||
|---|---|---|---|
| Quadrant | BADHDUFLAG | Total packets | Discarded packets |
| A | 0 | 14131 | 1 |
| B | 0 | 18360 | 1 |
| C | 0 | 15507 | 1 |
| D | 0 | 14941 | 1 |
| Mode M9 | |||
|---|---|---|---|
| Quadrant | BADHDUFLAG | Total packets | Discarded packets |
| A | 0 | 13 | 0 |
| B | 0 | 13 | 0 |
| C | 0 | 13 | 0 |
| D | 0 | 13 | 0 |
| Quadrant | Total seconds | Saturated seconds | Saturation percentage |
|---|---|---|---|
| A | 5996 | 130 | 2.168112% |
| B | 5996 | 189 | 3.152101% |
| C | 5996 | 279 | 4.653102% |
| D | 5996 | 116 | 1.934623% |
Noise dominated data is calculated using 1-second bins in cleaned event files. If a bin has >2000 counts, and if more than 50% of those come from <1% of pixels, then it is considered to be noise-dominated and hence unusable.
| Quadrant | # 1 sec bins | Bins with >0 counts | Bins with >2000 counts | High rate bins dominated by noise | Noise dominated (total time) | Noise dominated (detector-on time) | Marked lightcurve |
|---|---|---|---|---|---|---|---|
| A | 7271 | 5997 | 0 | 0 | 0.00% | 0.00% | 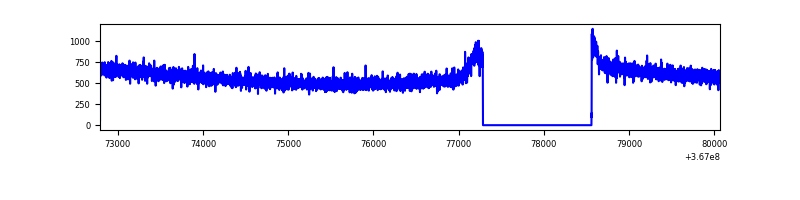 |
| B | 7271 | 5997 | 2 | 2 | 0.03% | 0.03% | 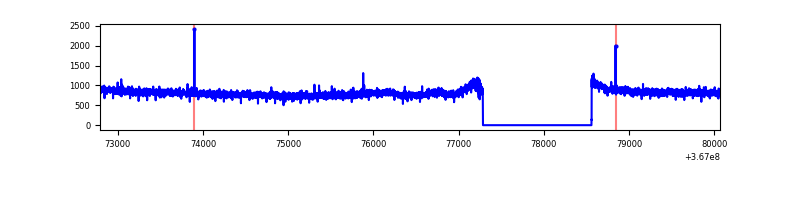 |
| C | 7271 | 5997 | 62 | 62 | 0.85% | 1.03% | 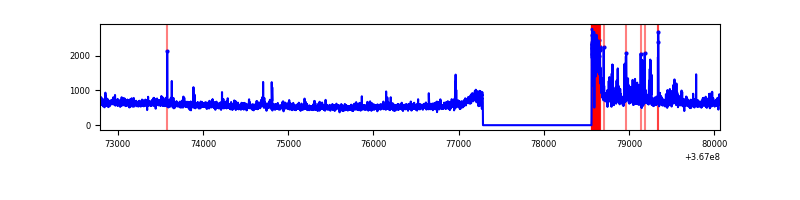 |
| D | 7271 | 5997 | 12 | 12 | 0.17% | 0.20% | 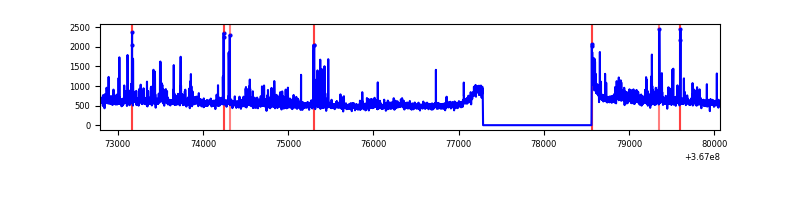 |
Top three noisy pixels from each quadrant. If the there are fewer than three noisy pixels in the level2.evt file, extra rows are filled as -1
| Pixel properties | Quadrant properties | ||||||
|---|---|---|---|---|---|---|---|
| Quadrant | DetID | PixID | Counts | Sigma | Mean | Median | Sigma |
| A | 13 | 254 | 10735 | 56.06 | 889 | 878 | 175.8 |
| A | 3 | 137 | 8028 | 40.66 | 889 | 878 | 175.8 |
| A | 0 | 226 | 7512 | 37.73 | 889 | 878 | 175.8 |
| B | 6 | 159 | 1491650 | 9313.93 | 856 | 837 | 160.1 |
| B | 12 | 111 | 18504 | 110.38 | 856 | 837 | 160.1 |
| B | 11 | 111 | 17030 | 101.17 | 856 | 837 | 160.1 |
| C | 0 | 10 | 334302 | 1749.97 | 828 | 838 | 190.6 |
| C | 3 | 233 | 146393 | 763.85 | 828 | 838 | 190.6 |
| C | 14 | 238 | 136425 | 711.54 | 828 | 838 | 190.6 |
| D | 8 | 195 | 211765 | 1055.63 | 857 | 840 | 199.8 |
| D | 12 | 218 | 85165 | 422.03 | 857 | 840 | 199.8 |
| D | 13 | 174 | 52971 | 260.9 | 857 | 840 | 199.8 |
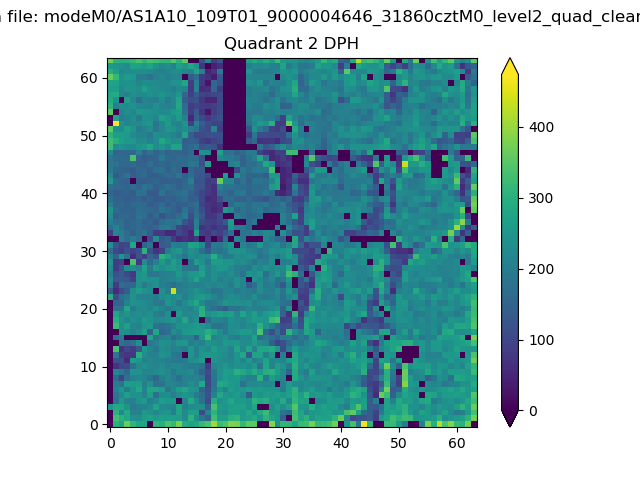
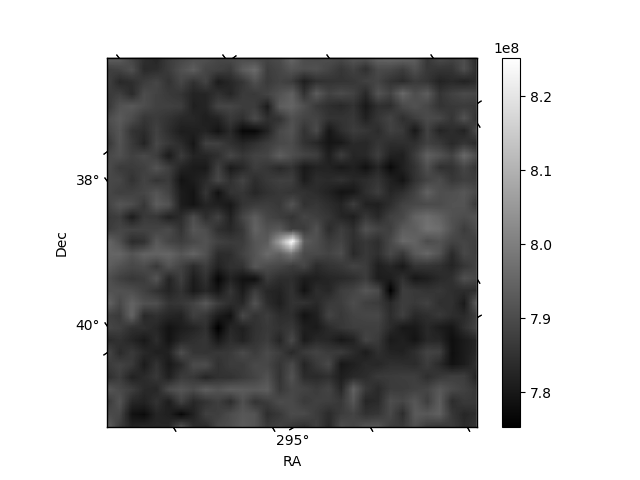
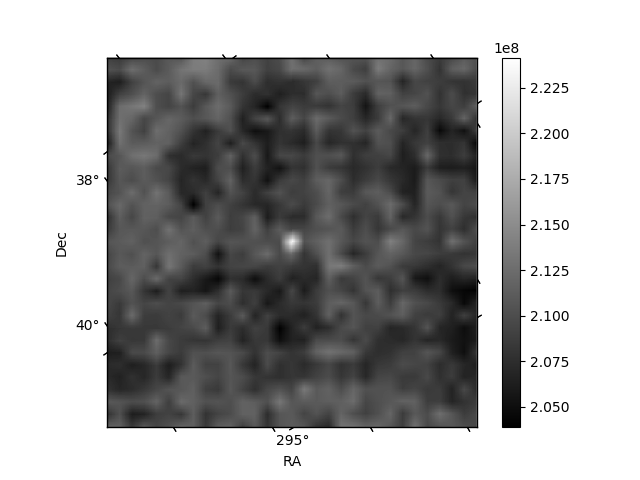
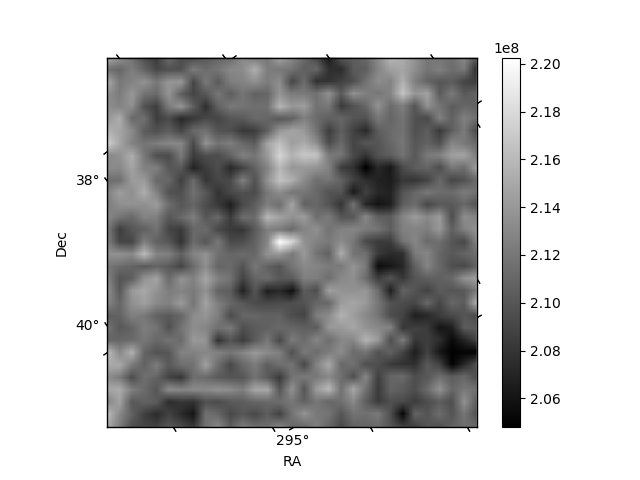
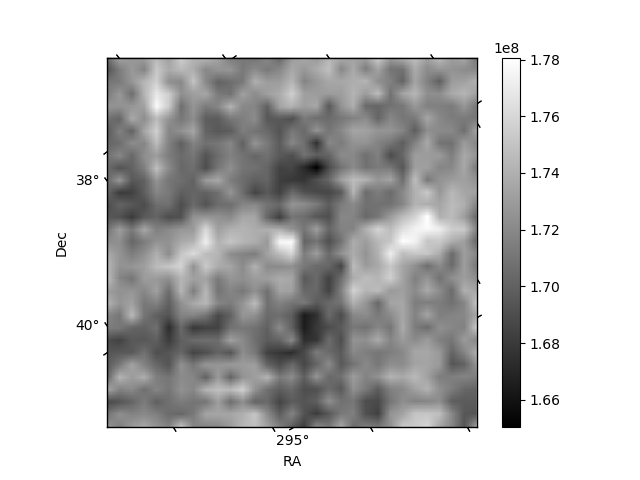
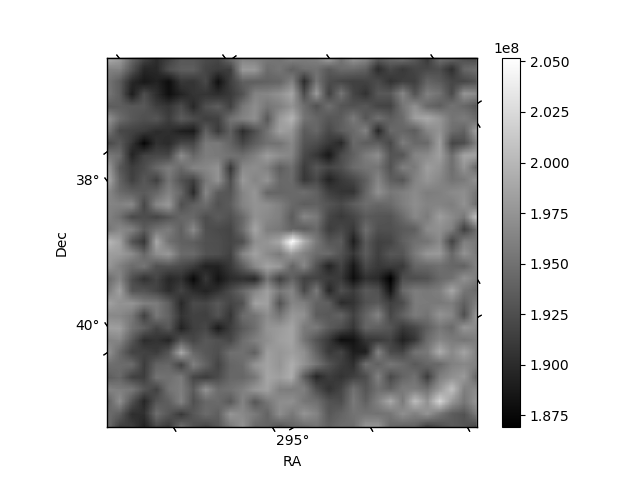
Histogram calculated using DETX and DETY for each event in the final _common_clean file
| Quadrant A | 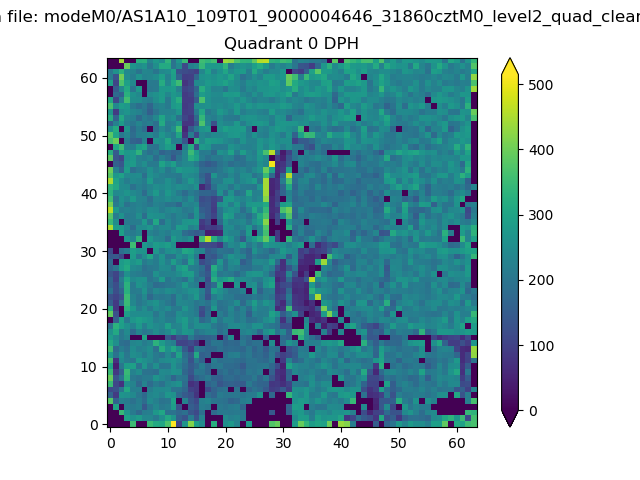 |
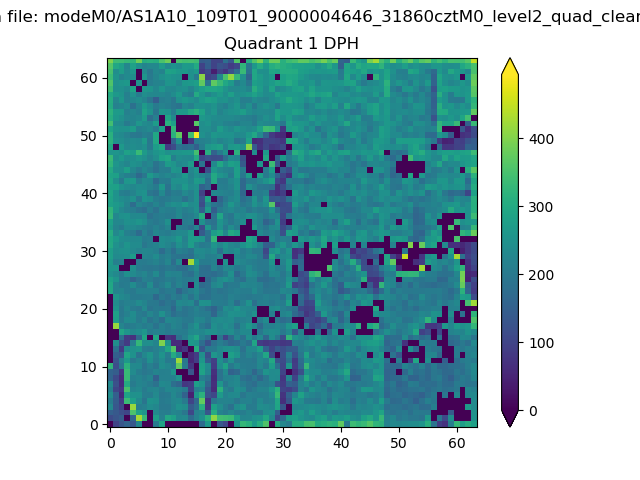 |
Quadrant B |
|---|---|---|---|
| Quadrant D | 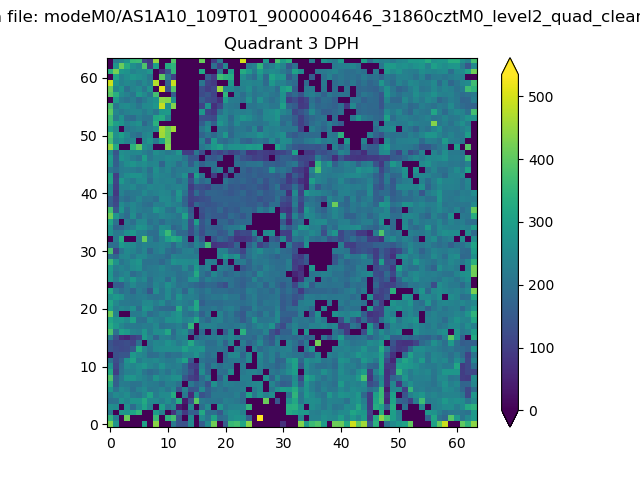 |
 |
Quadrant C |
| Plot type | Count rate plots | Images |
|---|---|---|
| Comparison with Poisson distribution Blue bars denote a histogram of data divided into 1 sec bins. Red curve is a Poisson curve with rate = median count rate of data. |
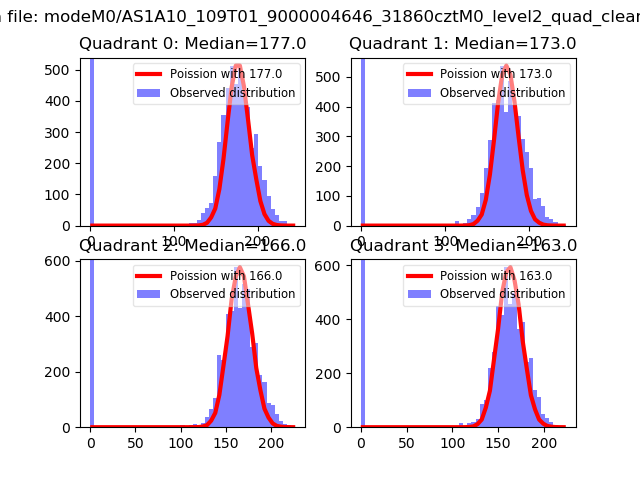 |
 |
| Quadrant-wise count rates Data is divided into 100 sec bins |
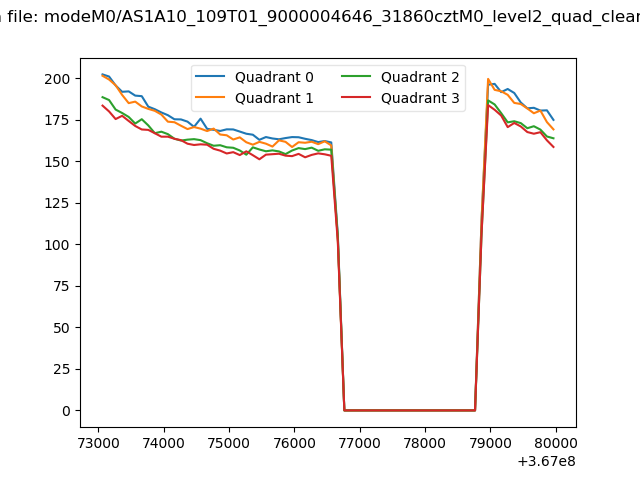 |
|
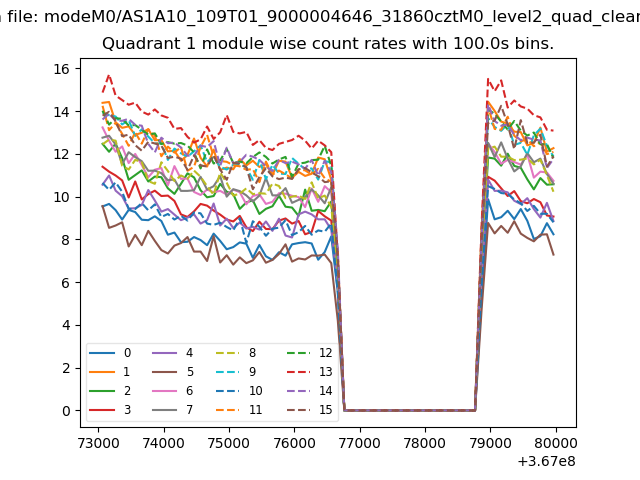
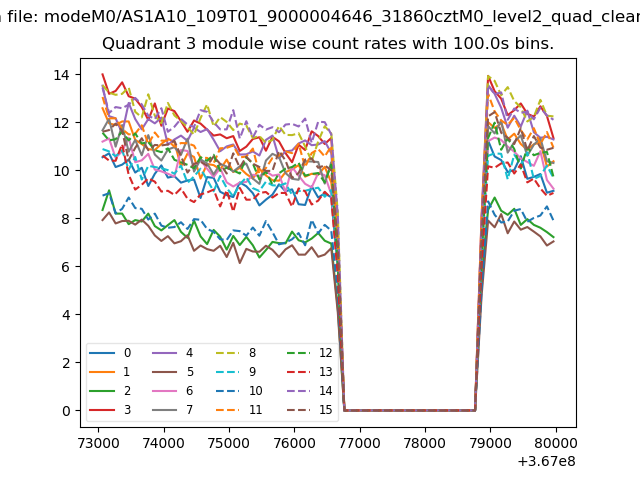
| Module-wise count rates for Quadrant A Data is divided into 100 sec bins |
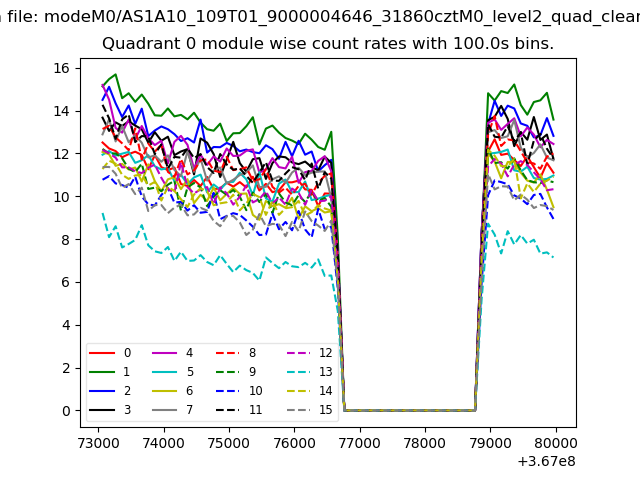 |
 |
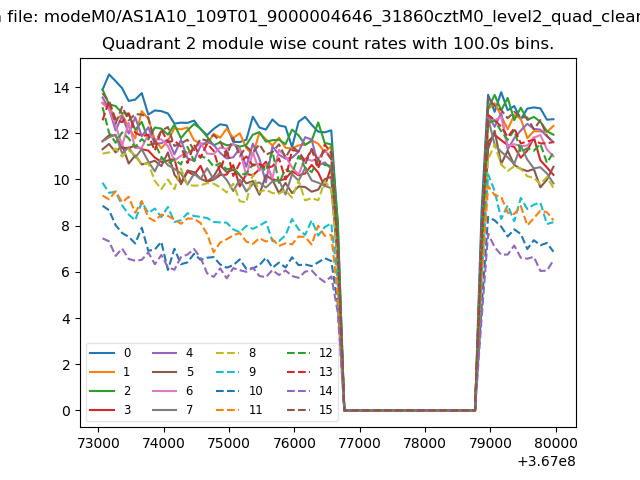
| Module-wise count rates for Quadrant B Data is divided into 100 sec bins |
 |
 |
| Module-wise count rates for Quadrant C Data is divided into 100 sec bins |
 |
 |
| Module-wise count rates for Quadrant D Data is divided into 100 sec bins |
 |
 |
| Parameter | Plot |
|---|---|
| CZT HV Monitor | 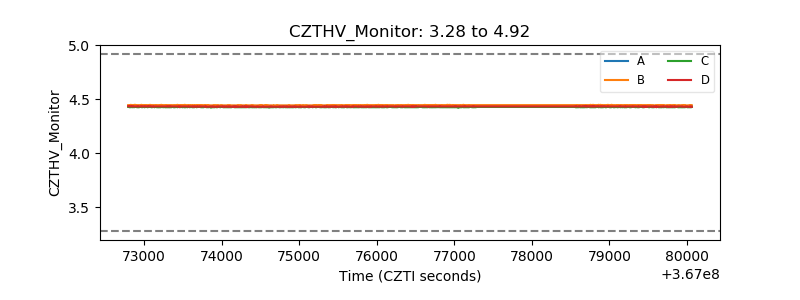 |
| D_VDD | 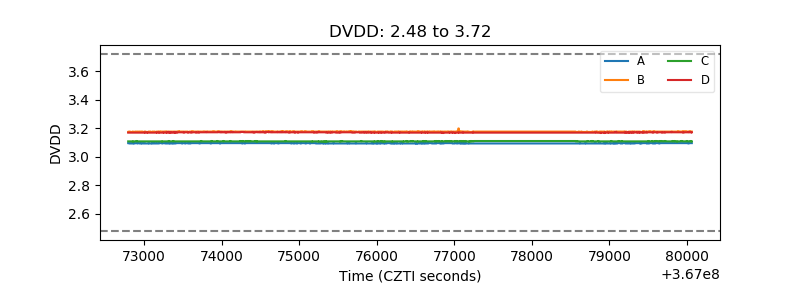 |
| Temperature 1 | 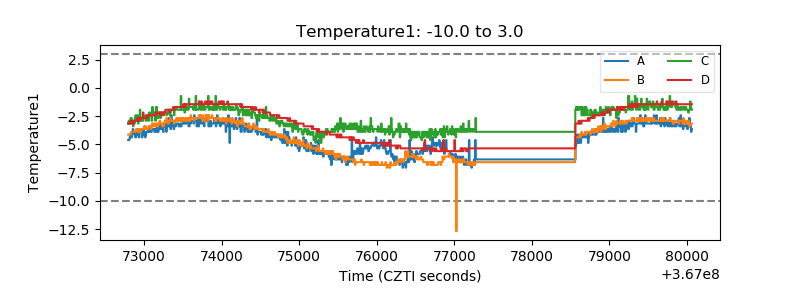 |
| Veto HV Monitor | 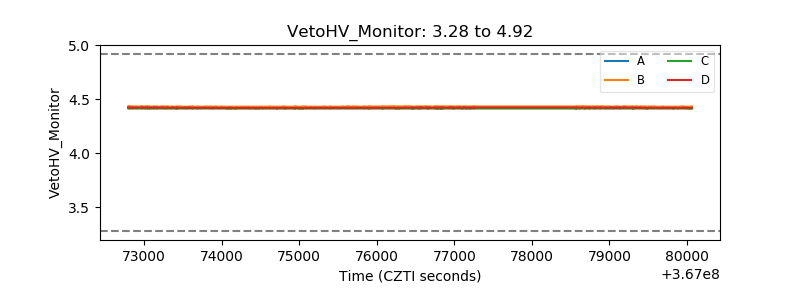 |
| Veto LLD | 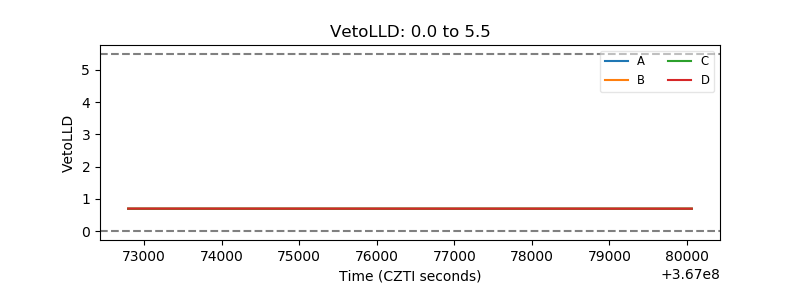 |
| Alpha Counter | 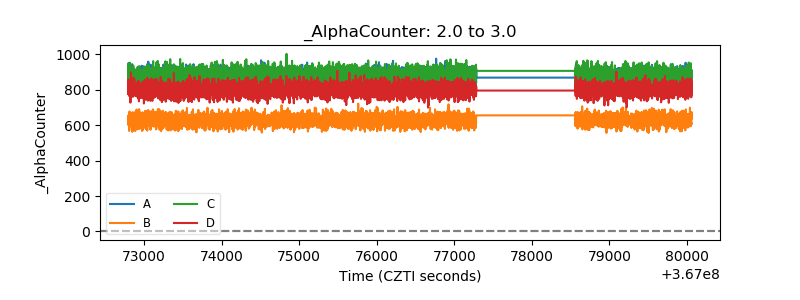 |
| _CPM_Rate | 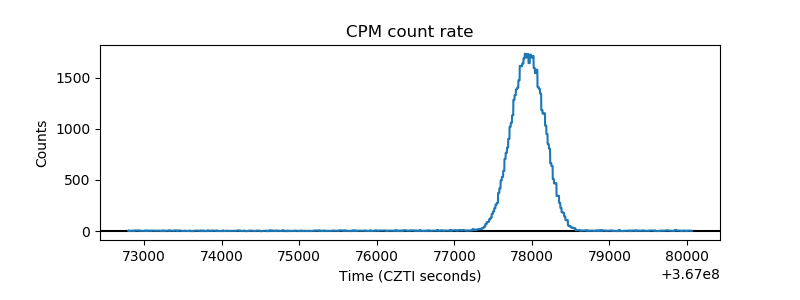 |
| CZT Counter | 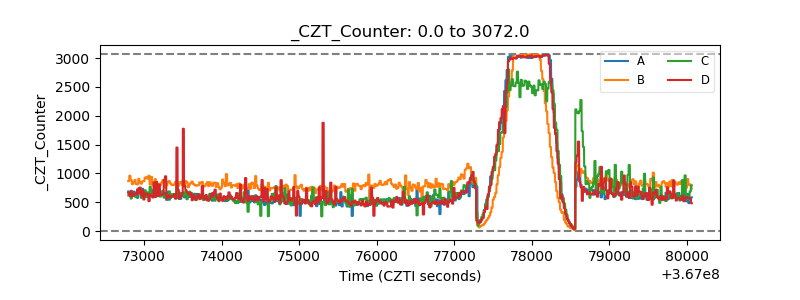 |
| +2.5 Volts monitor | 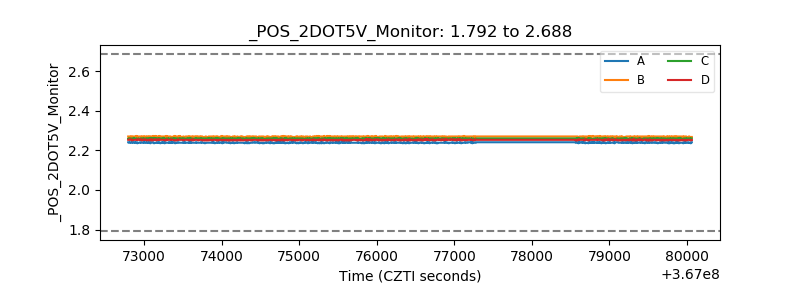 |
| +5 Volts monitor |  |
| _ROLL_ROT | 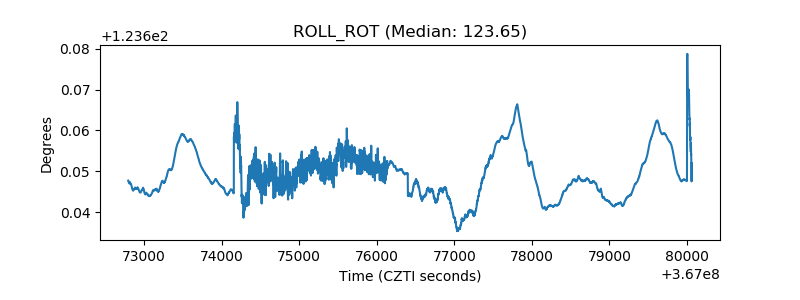 |
| _Roll_DEC | 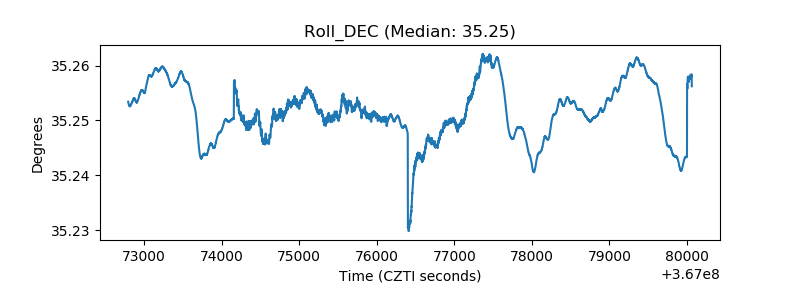 |
| _Roll_RA | 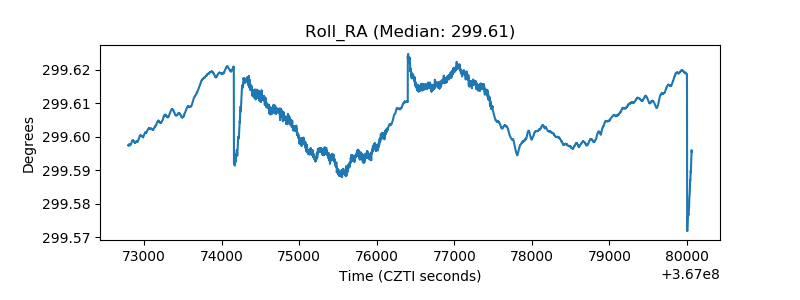 |
| Veto Counter | 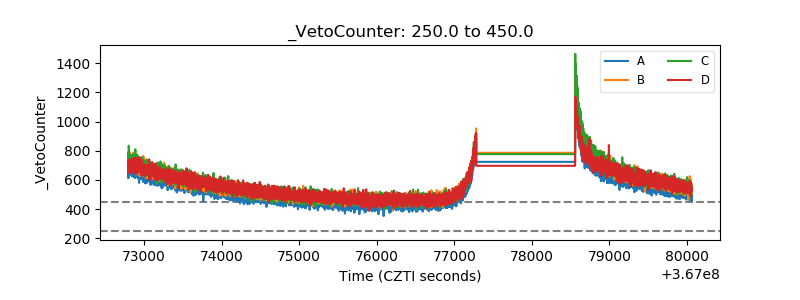 |