| Param | Original file | Final file |
|---|---|---|
| Filename | modeM0/AS1A10_109T01_9000004646_31862cztM0_level2.evt | modeM0/AS1A10_109T01_9000004646_31862cztM0_level2_quad_clean.evt |
| Size (bytes) | 956,183,040 | 191,165,760 |
| Size | 911.9 MB | 182.3 MB |
| Events in quadrant A | 5,598,564 | 1,319,773 |
| Events in quadrant B | 8,432,015 | 1,297,996 |
| Events in quadrant C | 7,244,881 | 1,222,080 |
| Events in quadrant D | 6,956,429 | 1,205,393 |
| Mode SS | |||
|---|---|---|---|
| Quadrant | BADHDUFLAG | Total packets | Discarded packets |
| A | 0 | 220 | 0 |
| B | 0 | 220 | 0 |
| C | 0 | 220 | 0 |
| D | 0 | 220 | 0 |
| Mode M0 | |||
|---|---|---|---|
| Quadrant | BADHDUFLAG | Total packets | Discarded packets |
| A | 0 | 23102 | 2 |
| B | 0 | 32874 | 2 |
| C | 0 | 28641 | 2 |
| D | 0 | 27333 | 2 |
| Mode M9 | |||
|---|---|---|---|
| Quadrant | BADHDUFLAG | Total packets | Discarded packets |
| A | 0 | 22 | 0 |
| B | 0 | 22 | 0 |
| C | 0 | 22 | 0 |
| D | 0 | 22 | 0 |
| Quadrant | Total seconds | Saturated seconds | Saturation percentage |
|---|---|---|---|
| A | 10758 | 156 | 1.450084% |
| B | 10758 | 312 | 2.900167% |
| C | 10758 | 588 | 5.465700% |
| D | 10759 | 494 | 4.591505% |
Noise dominated data is calculated using 1-second bins in cleaned event files. If a bin has >2000 counts, and if more than 50% of those come from <1% of pixels, then it is considered to be noise-dominated and hence unusable.
| Quadrant | # 1 sec bins | Bins with >0 counts | Bins with >2000 counts | High rate bins dominated by noise | Noise dominated (total time) | Noise dominated (detector-on time) | Marked lightcurve |
|---|---|---|---|---|---|---|---|
| A | 13003 | 10760 | 0 | 0 | 0.00% | 0.00% | 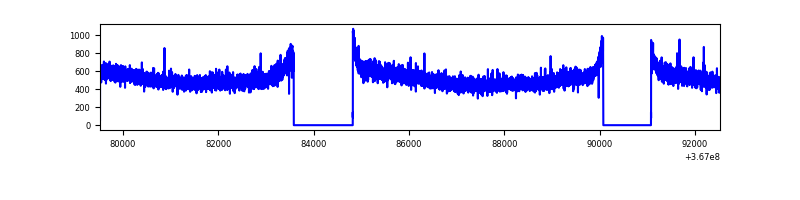 |
| B | 13003 | 10760 | 12 | 12 | 0.09% | 0.11% | 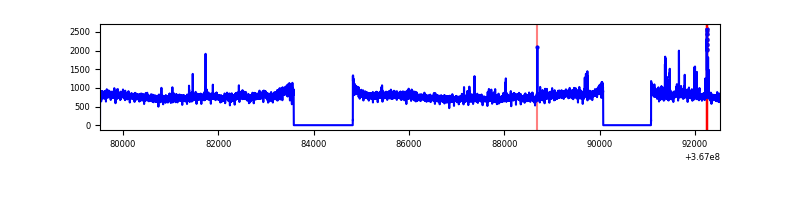 |
| C | 13003 | 10760 | 187 | 187 | 1.44% | 1.74% | 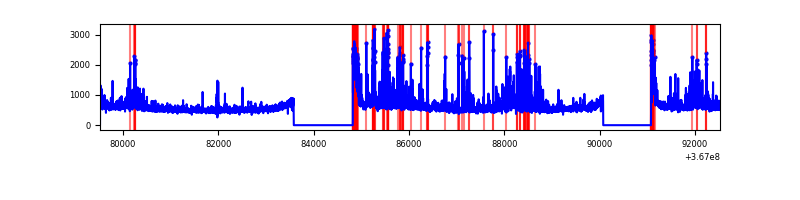 |
| D | 13004 | 10761 | 335 | 335 | 2.58% | 3.11% | 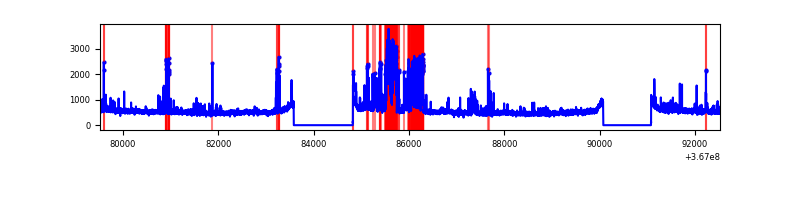 |
Top three noisy pixels from each quadrant. If the there are fewer than three noisy pixels in the level2.evt file, extra rows are filled as -1
| Pixel properties | Quadrant properties | ||||||
|---|---|---|---|---|---|---|---|
| Quadrant | DetID | PixID | Counts | Sigma | Mean | Median | Sigma |
| A | 13 | 254 | 20224 | 65.58 | 1450 | 1430 | 286.6 |
| A | 3 | 137 | 13933 | 43.63 | 1450 | 1430 | 286.6 |
| A | 0 | 226 | 12085 | 37.18 | 1450 | 1430 | 286.6 |
| B | 6 | 159 | 2752113 | 10315.3 | 1414 | 1383 | 266.7 |
| B | 0 | 190 | 41664 | 151.05 | 1414 | 1383 | 266.7 |
| B | 0 | 229 | 41558 | 150.66 | 1414 | 1383 | 266.7 |
| C | 0 | 10 | 1134448 | 3589.59 | 1364 | 1377 | 315.7 |
| C | 3 | 233 | 475211 | 1501.12 | 1364 | 1377 | 315.7 |
| C | 14 | 238 | 228045 | 718.09 | 1364 | 1377 | 315.7 |
| D | 12 | 233 | 624787 | 1922.5 | 1386 | 1357 | 324.3 |
| D | 12 | 218 | 547828 | 1685.17 | 1386 | 1357 | 324.3 |
| D | 8 | 195 | 417030 | 1281.83 | 1386 | 1357 | 324.3 |
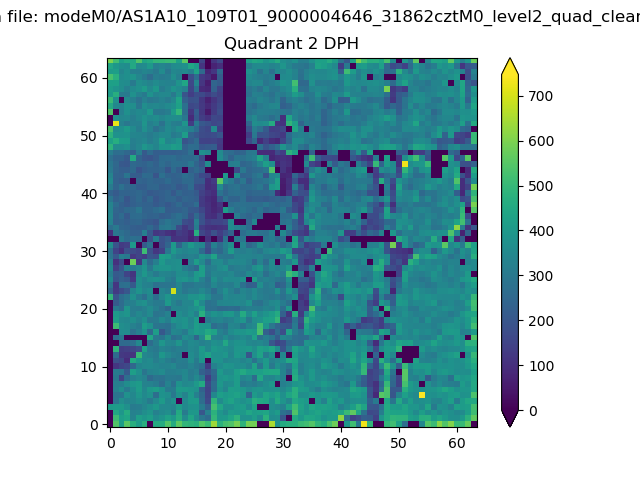
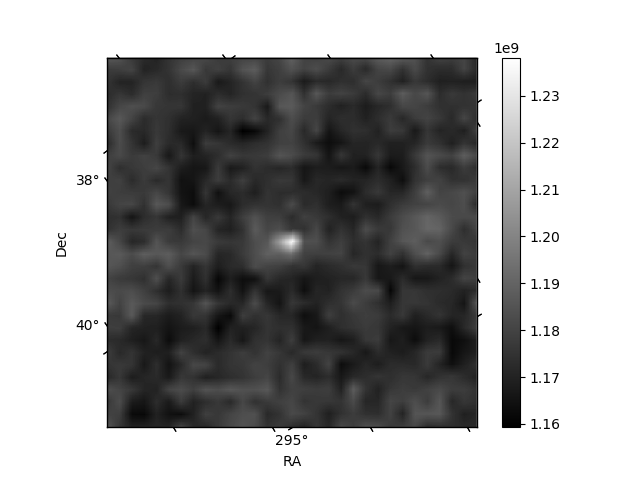
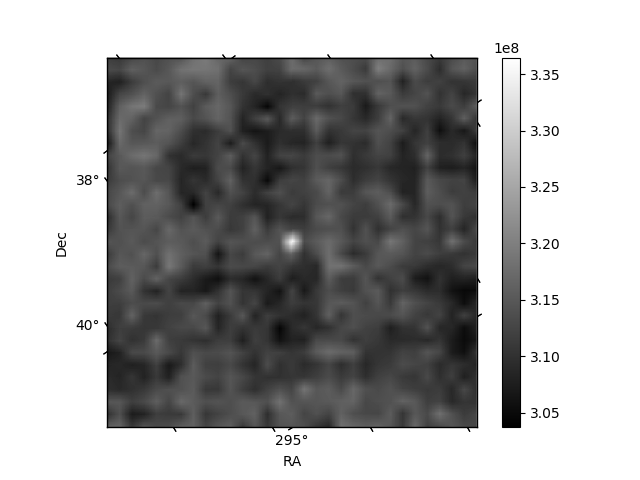
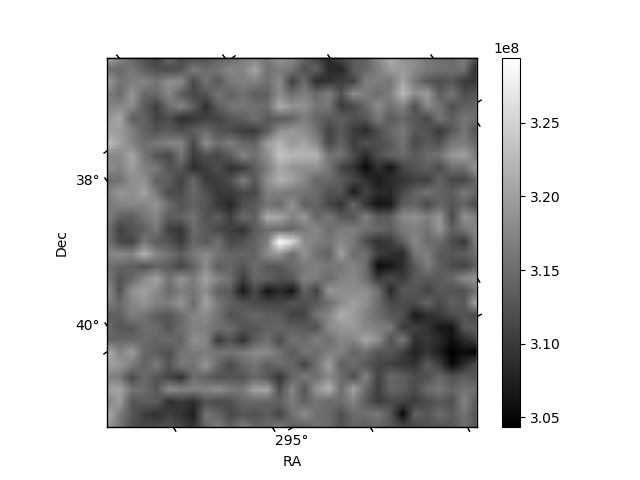
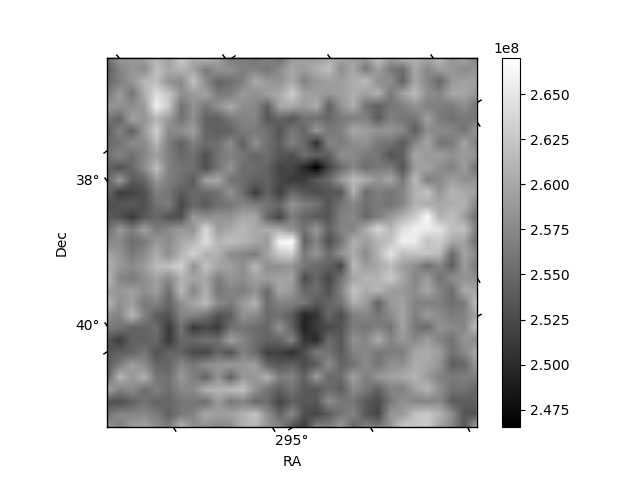
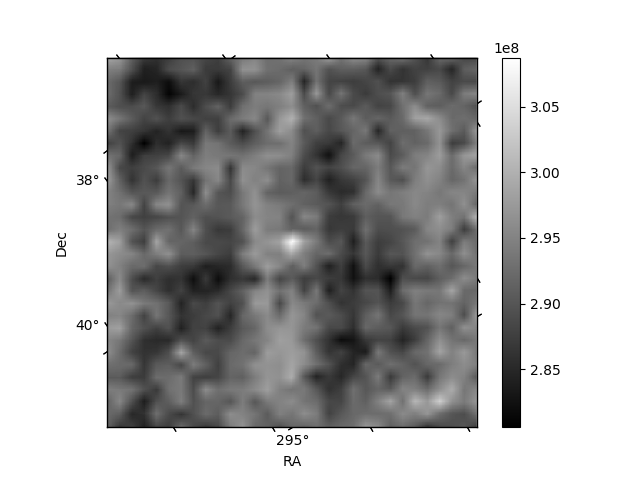
Histogram calculated using DETX and DETY for each event in the final _common_clean file
| Quadrant A | 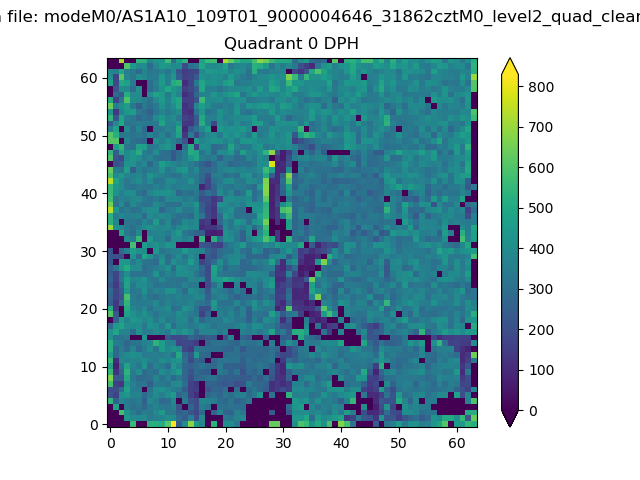 |
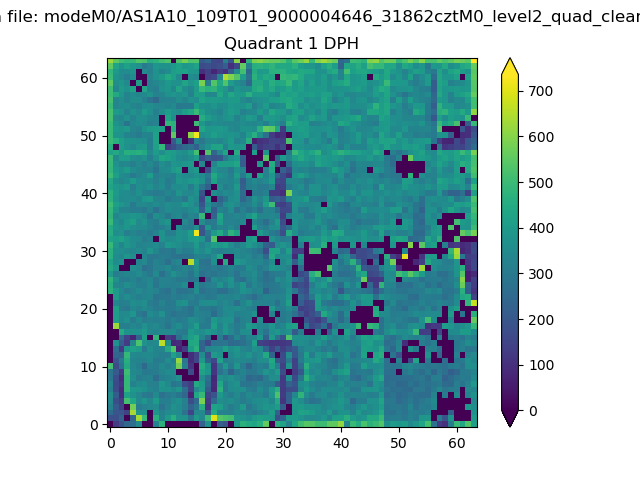 |
Quadrant B |
|---|---|---|---|
| Quadrant D | 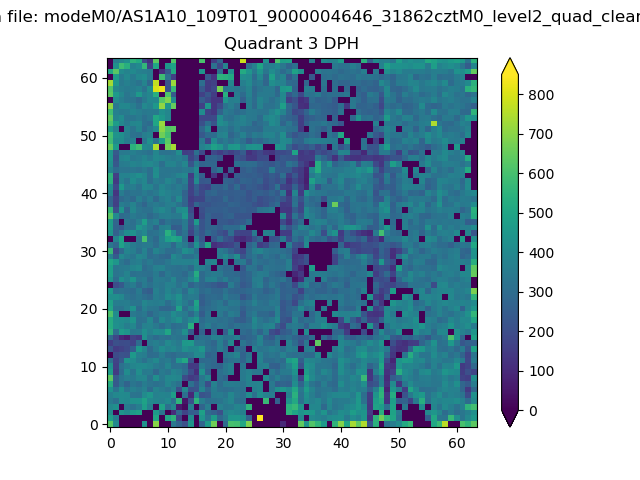 |
 |
Quadrant C |
| Plot type | Count rate plots | Images |
|---|---|---|
| Comparison with Poisson distribution Blue bars denote a histogram of data divided into 1 sec bins. Red curve is a Poisson curve with rate = median count rate of data. |
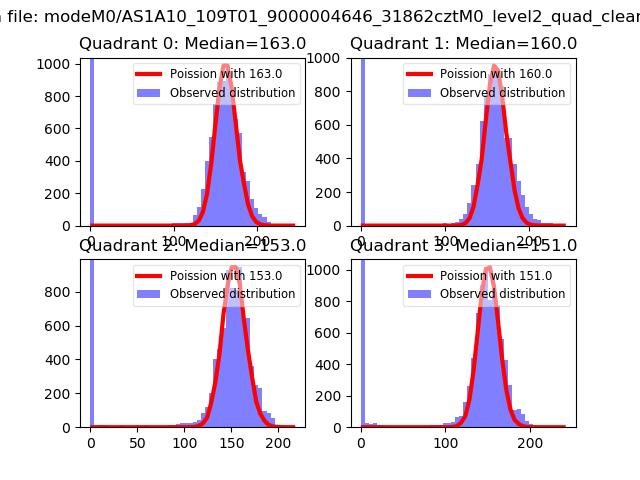 |
 |
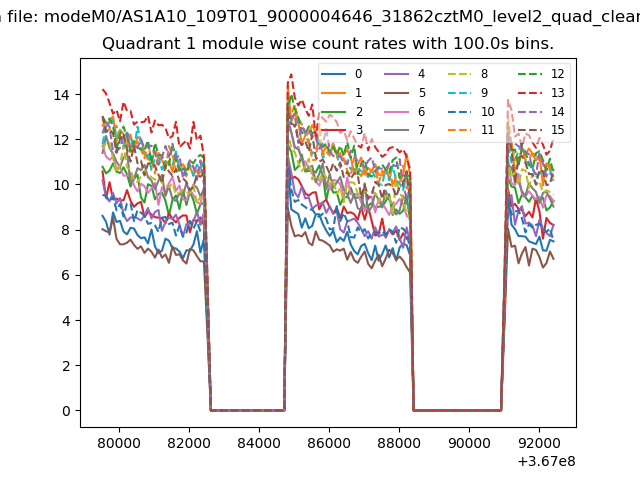
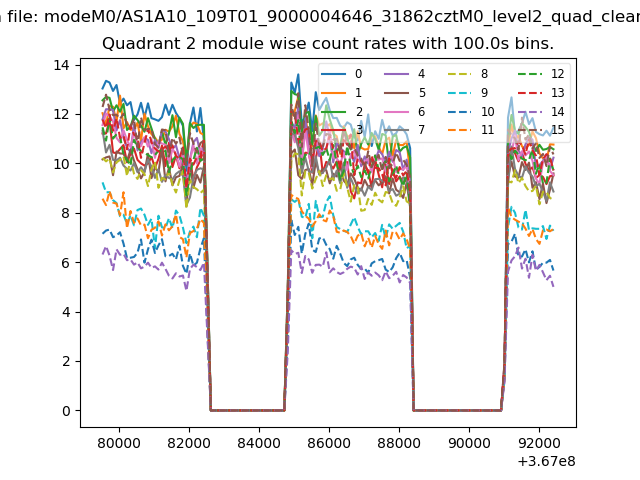
| Quadrant-wise count rates Data is divided into 100 sec bins |
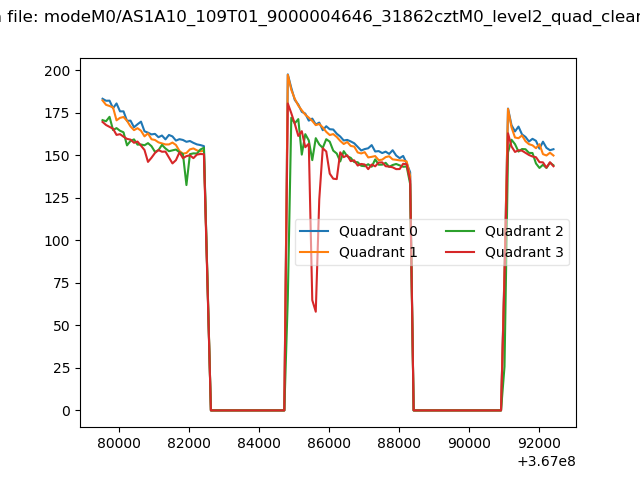 |
|
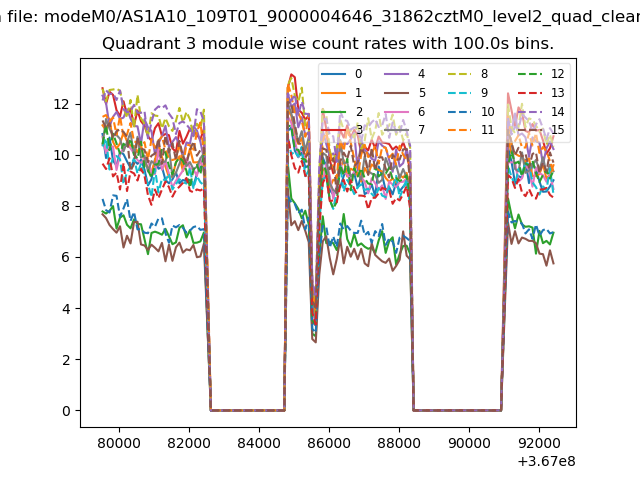
| Module-wise count rates for Quadrant A Data is divided into 100 sec bins |
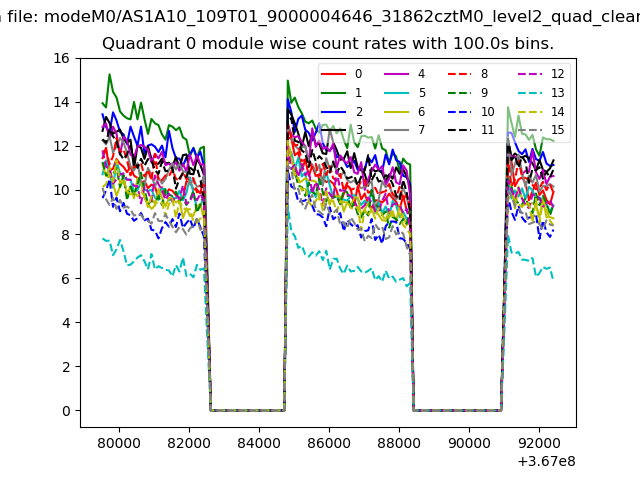 |
 |
| Module-wise count rates for Quadrant B Data is divided into 100 sec bins |
 |
 |
| Module-wise count rates for Quadrant C Data is divided into 100 sec bins |
 |
 |
| Module-wise count rates for Quadrant D Data is divided into 100 sec bins |
 |
 |
| Parameter | Plot |
|---|---|
| CZT HV Monitor | 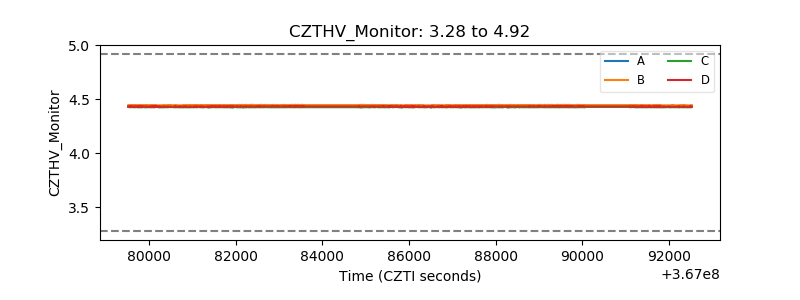 |
| D_VDD | 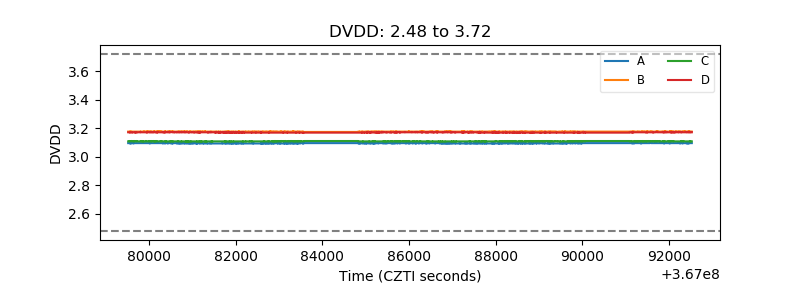 |
| Temperature 1 | 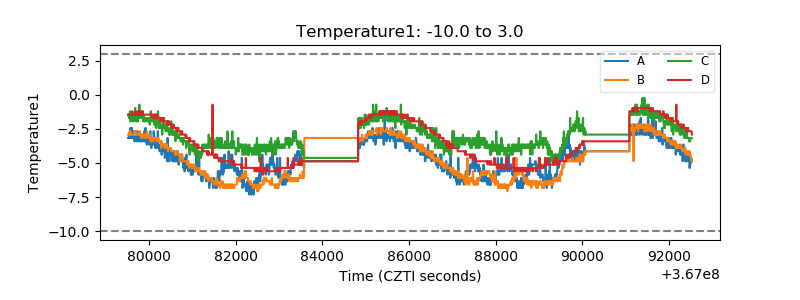 |
| Veto HV Monitor | 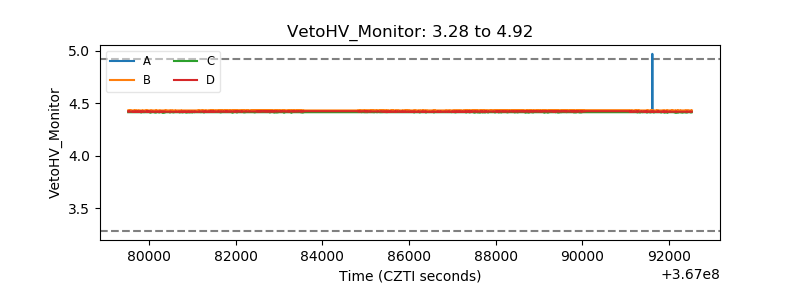 |
| Veto LLD |  |
| Alpha Counter | 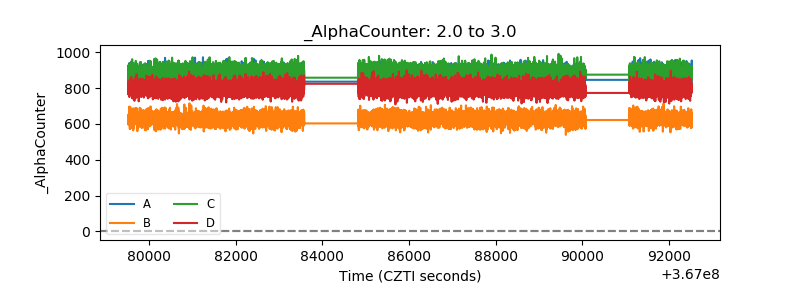 |
| _CPM_Rate | 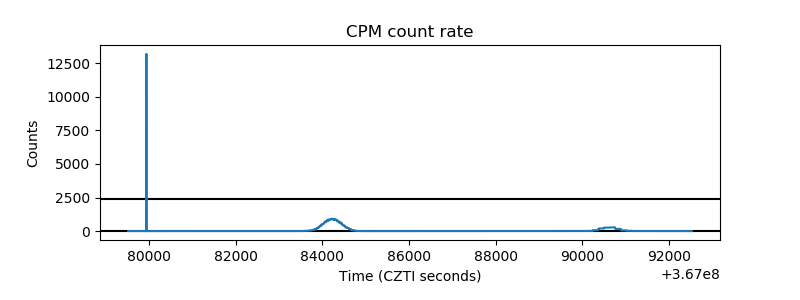 |
| CZT Counter | 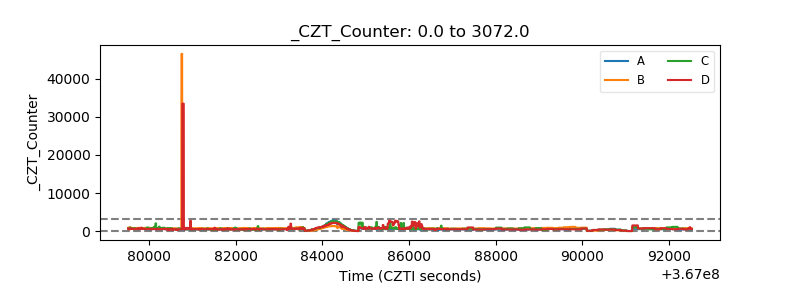 |
| +2.5 Volts monitor |  |
| +5 Volts monitor |  |
| _ROLL_ROT | 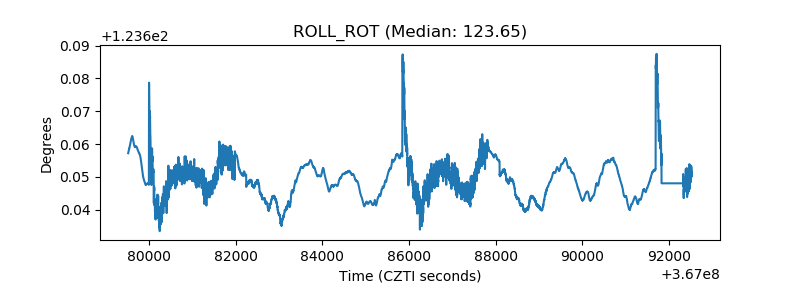 |
| _Roll_DEC | 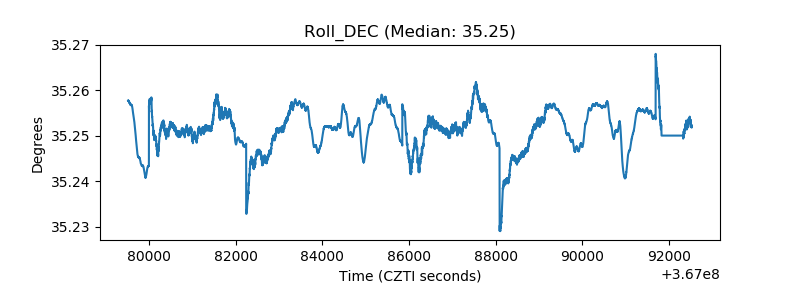 |
| _Roll_RA | 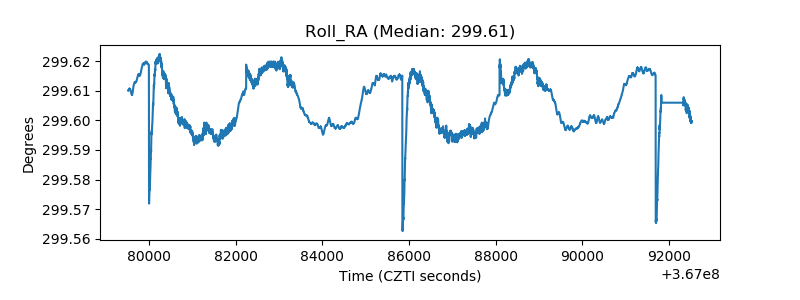 |
| Veto Counter | 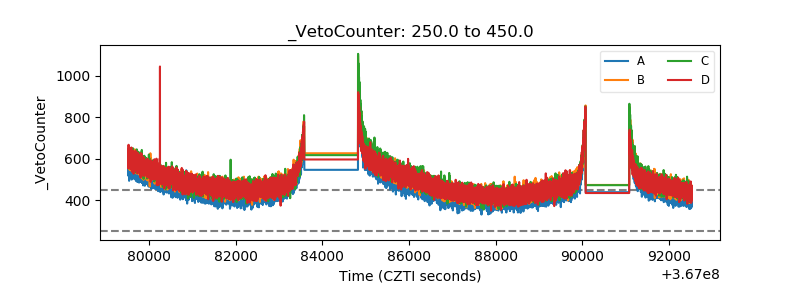 |