| Param | Original file | Final file |
|---|---|---|
| Filename | modeM0/AS1A10_109T01_9000004646_31865cztM0_level2.evt | modeM0/AS1A10_109T01_9000004646_31865cztM0_level2_quad_clean.evt |
| Size (bytes) | 579,493,440 | 108,336,960 |
| Size | 552.6 MB | 103.3 MB |
| Events in quadrant A | 3,396,031 | 722,070 |
| Events in quadrant B | 5,488,305 | 709,330 |
| Events in quadrant C | 4,243,626 | 683,453 |
| Events in quadrant D | 3,944,175 | 674,595 |
| Mode SS | |||
|---|---|---|---|
| Quadrant | BADHDUFLAG | Total packets | Discarded packets |
| A | 0 | 144 | 0 |
| B | 0 | 144 | 0 |
| C | 0 | 144 | 0 |
| D | 0 | 144 | 0 |
| Mode M0 | |||
|---|---|---|---|
| Quadrant | BADHDUFLAG | Total packets | Discarded packets |
| A | 0 | 14719 | 1 |
| B | 0 | 21502 | 1 |
| C | 0 | 17254 | 1 |
| D | 0 | 16311 | 1 |
| Mode M9 | |||
|---|---|---|---|
| Quadrant | BADHDUFLAG | Total packets | Discarded packets |
| A | 0 | 3 | 0 |
| B | 0 | 3 | 0 |
| C | 0 | 3 | 0 |
| D | 0 | 3 | 0 |
| Quadrant | Total seconds | Saturated seconds | Saturation percentage |
|---|---|---|---|
| A | 7055 | 26 | 0.368533% |
| B | 7056 | 116 | 1.643991% |
| C | 7056 | 208 | 2.947846% |
| D | 7056 | 73 | 1.034580% |
Noise dominated data is calculated using 1-second bins in cleaned event files. If a bin has >2000 counts, and if more than 50% of those come from <1% of pixels, then it is considered to be noise-dominated and hence unusable.
| Quadrant | # 1 sec bins | Bins with >0 counts | Bins with >2000 counts | High rate bins dominated by noise | Noise dominated (total time) | Noise dominated (detector-on time) | Marked lightcurve |
|---|---|---|---|---|---|---|---|
| A | 7350 | 7056 | 0 | 0 | 0.00% | 0.00% | 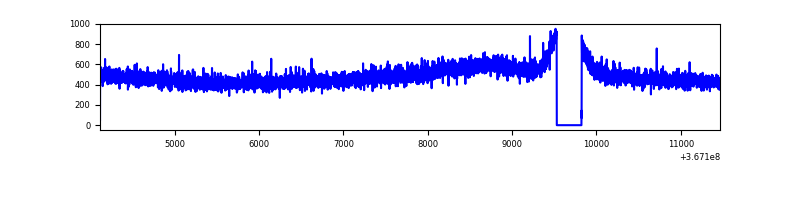 |
| B | 7351 | 7057 | 6 | 6 | 0.08% | 0.09% | 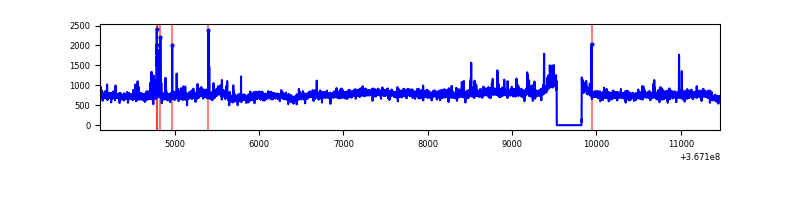 |
| C | 7351 | 7057 | 17 | 17 | 0.23% | 0.24% | 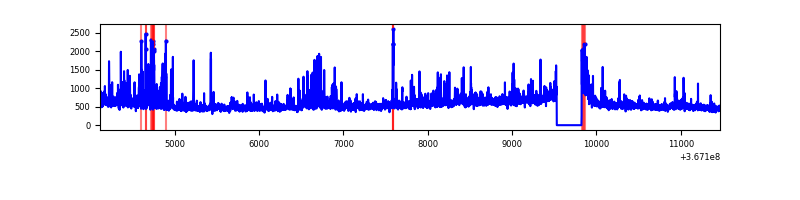 |
| D | 7351 | 7057 | 32 | 32 | 0.44% | 0.45% | 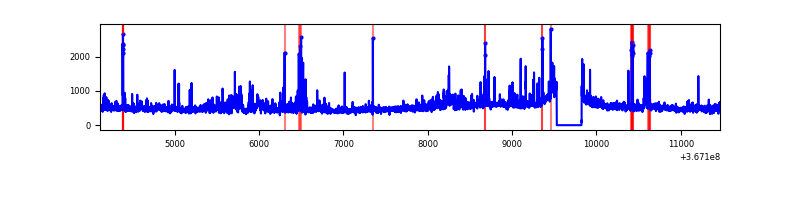 |
Top three noisy pixels from each quadrant. If the there are fewer than three noisy pixels in the level2.evt file, extra rows are filled as -1
| Pixel properties | Quadrant properties | ||||||
|---|---|---|---|---|---|---|---|
| Quadrant | DetID | PixID | Counts | Sigma | Mean | Median | Sigma |
| A | 13 | 254 | 11028 | 56.98 | 878 | 861 | 178.4 |
| A | 3 | 137 | 8944 | 45.3 | 878 | 861 | 178.4 |
| A | 13 | 6 | 8412 | 42.32 | 878 | 861 | 178.4 |
| B | 6 | 159 | 1928663 | 11571.98 | 865 | 847 | 166.6 |
| B | 0 | 229 | 71499 | 424.1 | 865 | 847 | 166.6 |
| B | 10 | 247 | 36159 | 211.97 | 865 | 847 | 166.6 |
| C | 0 | 10 | 483738 | 2435.38 | 840 | 848 | 198.3 |
| C | 3 | 233 | 307391 | 1546.0 | 840 | 848 | 198.3 |
| C | 14 | 238 | 141987 | 711.81 | 840 | 848 | 198.3 |
| D | 8 | 195 | 242098 | 1177.67 | 849 | 826 | 204.9 |
| D | 12 | 79 | 226024 | 1099.21 | 849 | 826 | 204.9 |
| D | 1 | 52 | 78212 | 377.73 | 849 | 826 | 204.9 |
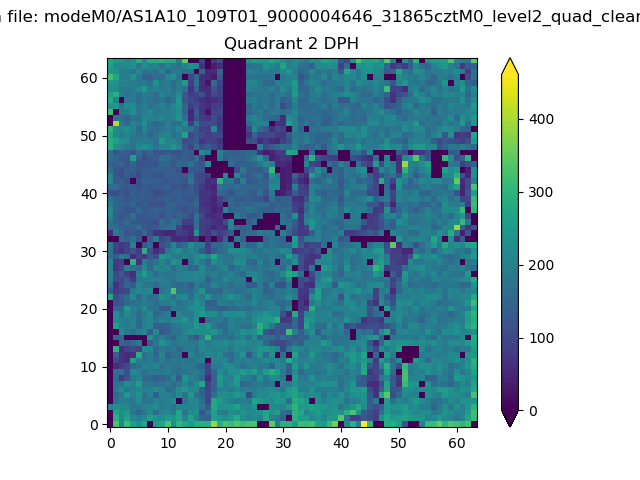
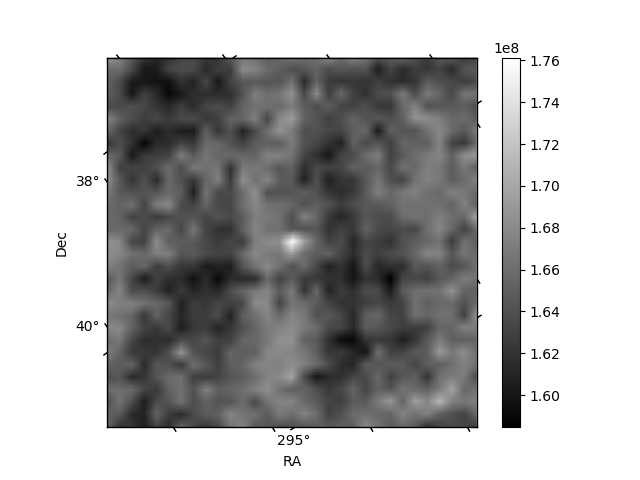
Histogram calculated using DETX and DETY for each event in the final _common_clean file
| Quadrant A | 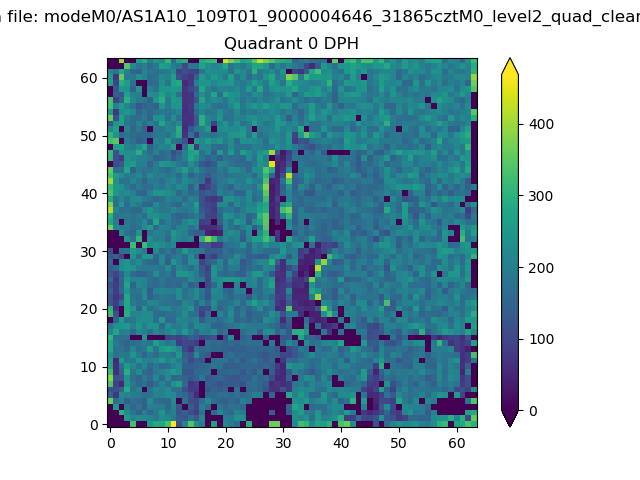 |
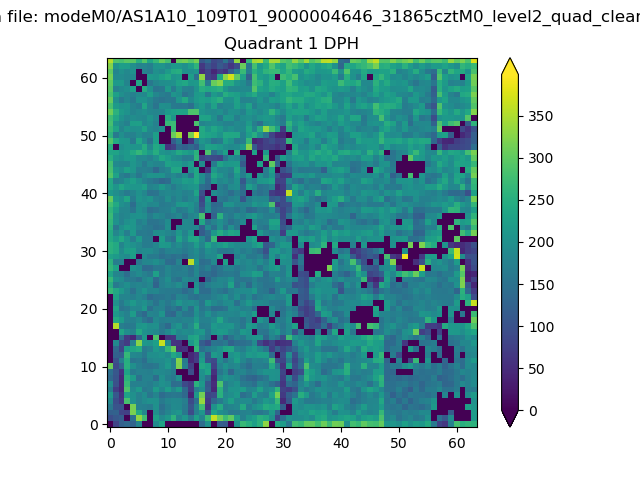 |
Quadrant B |
|---|---|---|---|
| Quadrant D | 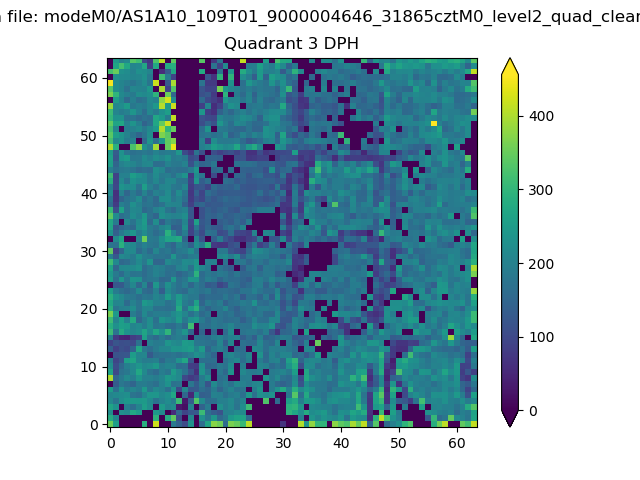 |
 |
Quadrant C |
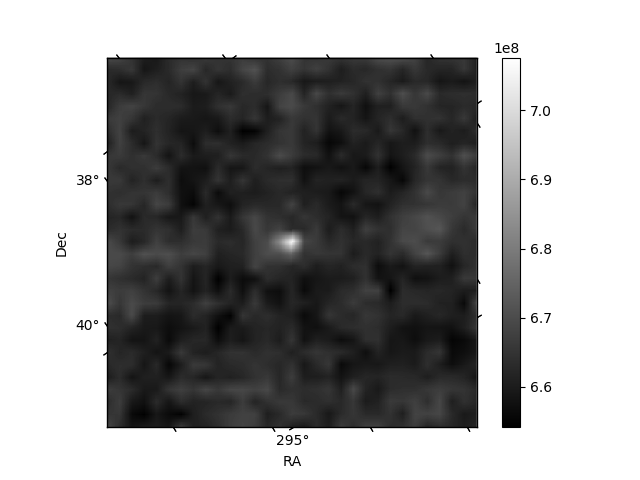
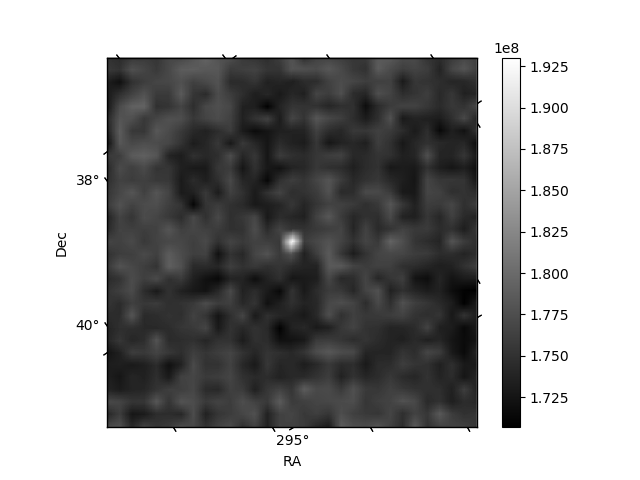
| Plot type | Count rate plots | Images |
|---|---|---|
| Comparison with Poisson distribution Blue bars denote a histogram of data divided into 1 sec bins. Red curve is a Poisson curve with rate = median count rate of data. |
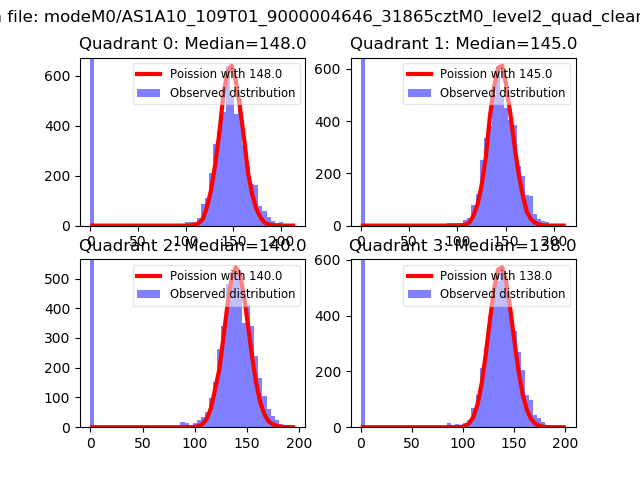 |
 |
| Quadrant-wise count rates Data is divided into 100 sec bins |
 |
|
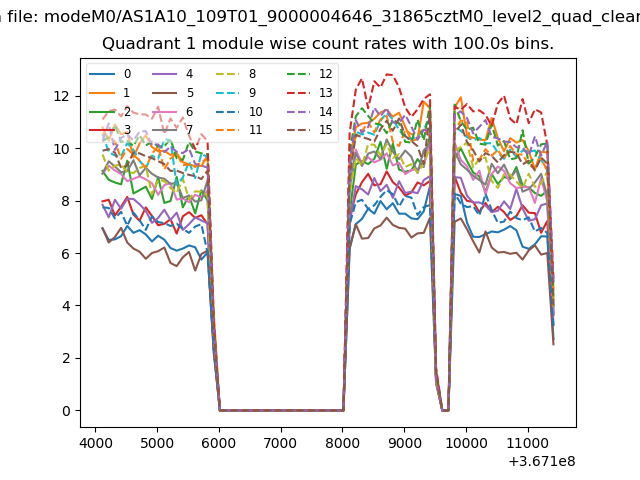
| Module-wise count rates for Quadrant A Data is divided into 100 sec bins |
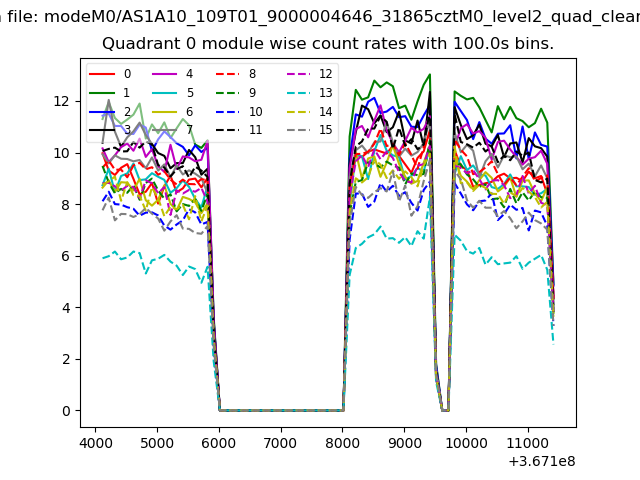 |
 |
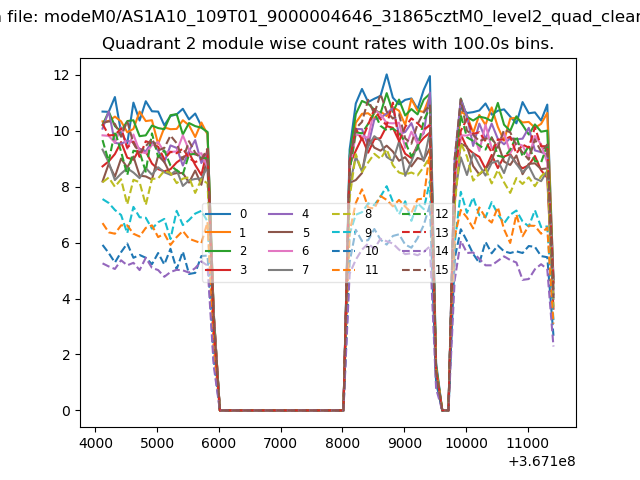
| Module-wise count rates for Quadrant B Data is divided into 100 sec bins |
 |
 |
| Module-wise count rates for Quadrant C Data is divided into 100 sec bins |
 |
 |
| Module-wise count rates for Quadrant D Data is divided into 100 sec bins |
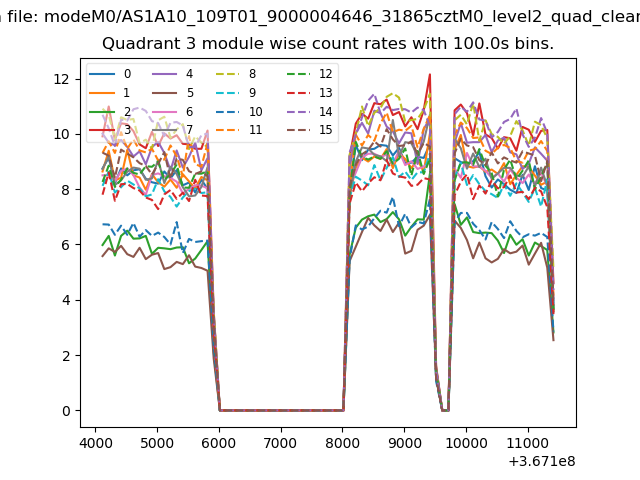 |
 |
| Parameter | Plot |
|---|---|
| CZT HV Monitor | 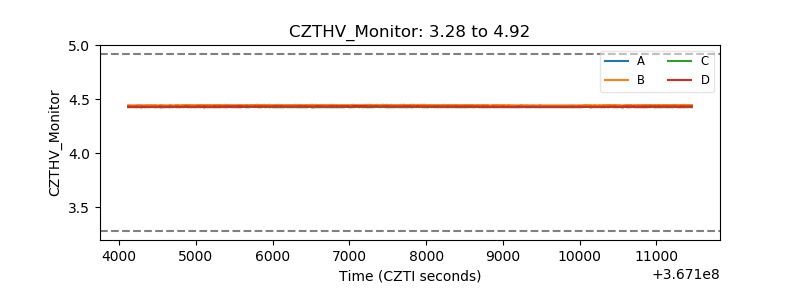 |
| D_VDD | 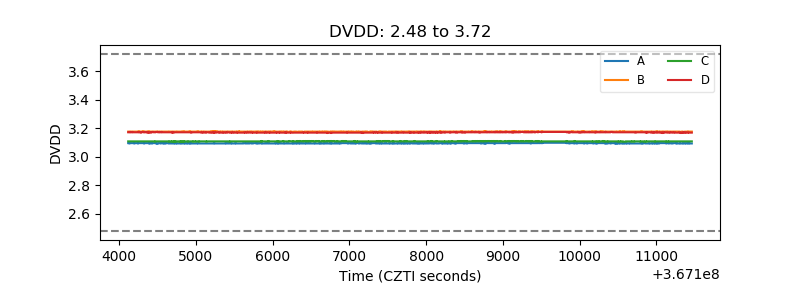 |
| Temperature 1 | 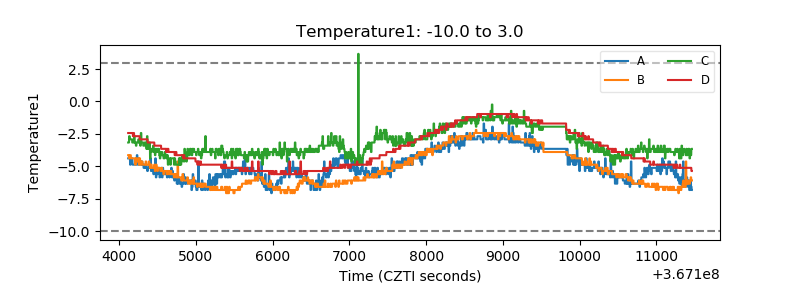 |
| Veto HV Monitor | 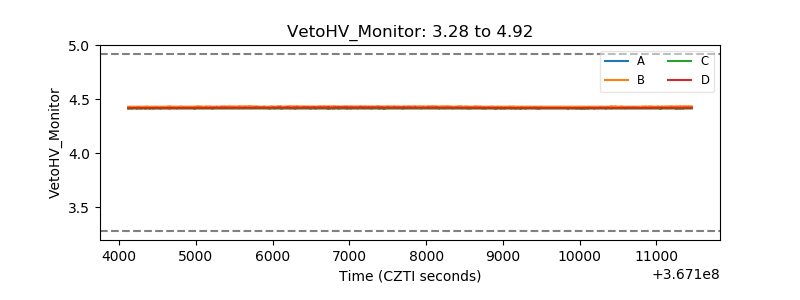 |
| Veto LLD | 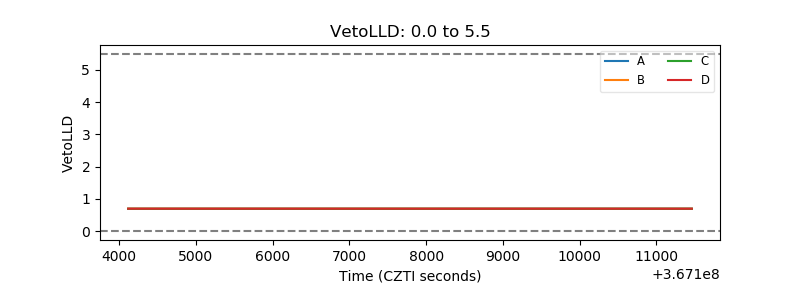 |
| Alpha Counter | 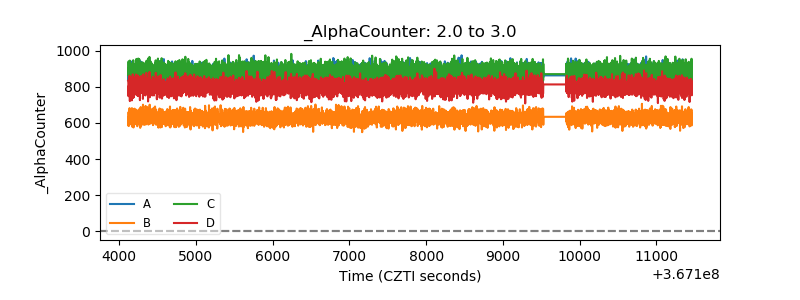 |
| _CPM_Rate | 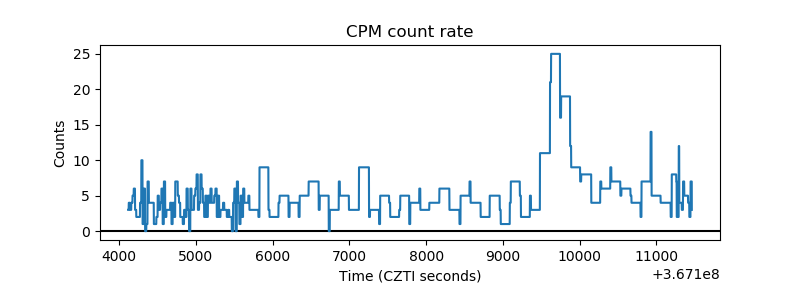 |
| CZT Counter | 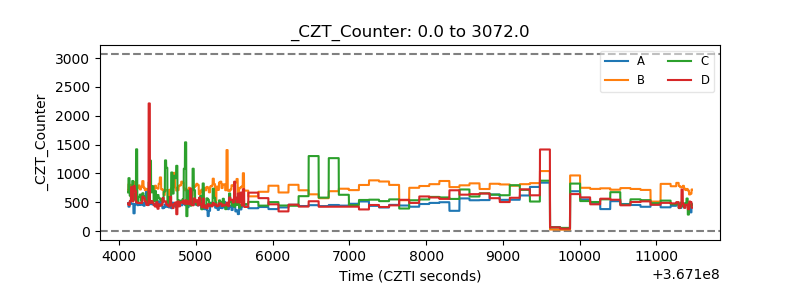 |
| +2.5 Volts monitor | 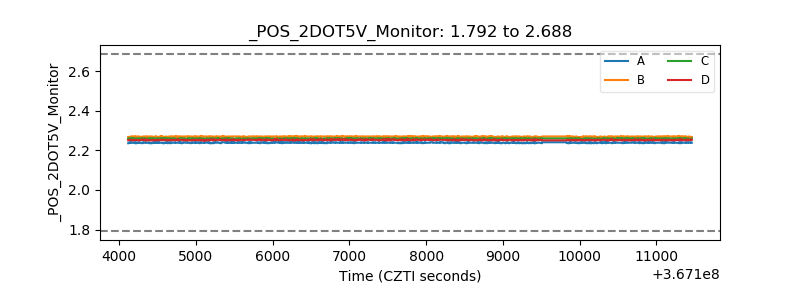 |
| +5 Volts monitor |  |
| _ROLL_ROT |  |
| _Roll_DEC | 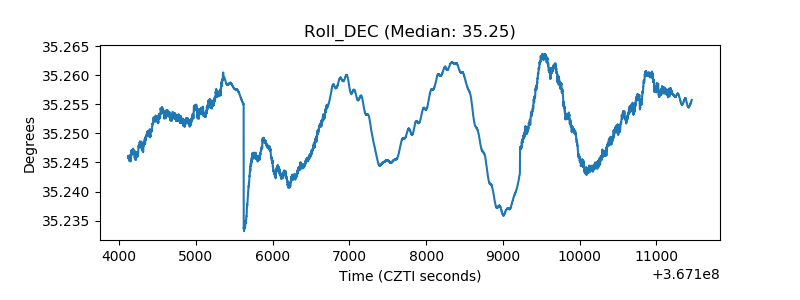 |
| _Roll_RA | 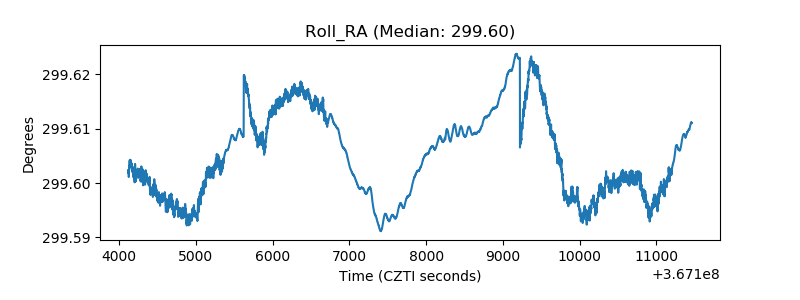 |
| Veto Counter | 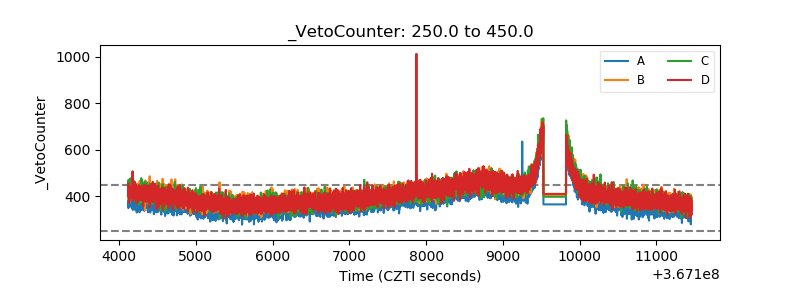 |