| Param | Original file | Final file |
|---|---|---|
| Filename | modeM0/AS1A10_109T01_9000004646_31868cztM0_level2.evt | modeM0/AS1A10_109T01_9000004646_31868cztM0_level2_quad_clean.evt |
| Size (bytes) | 1,547,858,880 | 254,056,320 |
| Size | 1.4 GB | 242.3 MB |
| Events in quadrant A | 8,929,127 | 1,663,897 |
| Events in quadrant B | 14,227,556 | 1,644,628 |
| Events in quadrant C | 11,433,027 | 1,562,978 |
| Events in quadrant D | 11,036,891 | 1,544,395 |
| Mode SS | |||
|---|---|---|---|
| Quadrant | BADHDUFLAG | Total packets | Discarded packets |
| A | 0 | 380 | 0 |
| B | 0 | 380 | 0 |
| C | 0 | 380 | 0 |
| D | 0 | 380 | 0 |
| Mode M0 | |||
|---|---|---|---|
| Quadrant | BADHDUFLAG | Total packets | Discarded packets |
| A | 0 | 38150 | 4 |
| B | 0 | 56458 | 6 |
| C | 0 | 46051 | 4 |
| D | 0 | 45233 | 4 |
| Mode M9 | |||
|---|---|---|---|
| Quadrant | BADHDUFLAG | Total packets | Discarded packets |
| A | 0 | 22 | 0 |
| B | 0 | 22 | 0 |
| C | 0 | 22 | 0 |
| D | 0 | 22 | 0 |
| Quadrant | Total seconds | Saturated seconds | Saturation percentage |
|---|---|---|---|
| A | 18559 | 49 | 0.264023% |
| B | 18558 | 270 | 1.454898% |
| C | 18559 | 635 | 3.421521% |
| D | 18559 | 196 | 1.056091% |
Noise dominated data is calculated using 1-second bins in cleaned event files. If a bin has >2000 counts, and if more than 50% of those come from <1% of pixels, then it is considered to be noise-dominated and hence unusable.
| Quadrant | # 1 sec bins | Bins with >0 counts | Bins with >2000 counts | High rate bins dominated by noise | Noise dominated (total time) | Noise dominated (detector-on time) | Marked lightcurve |
|---|---|---|---|---|---|---|---|
| A | 20734 | 18563 | 0 | 0 | 0.00% | 0.00% | 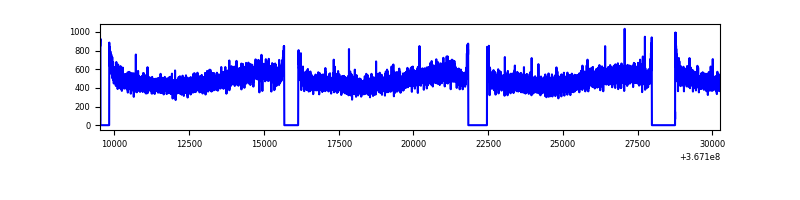 |
| B | 20733 | 18562 | 25 | 25 | 0.12% | 0.13% | 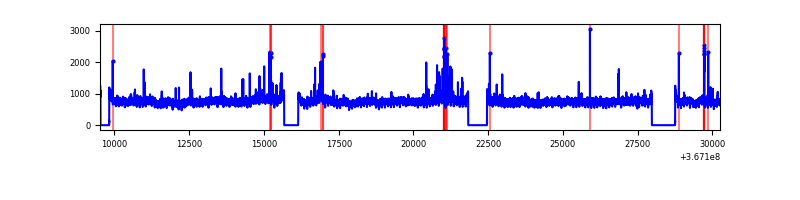 |
| C | 20734 | 18563 | 128 | 128 | 0.62% | 0.69% | 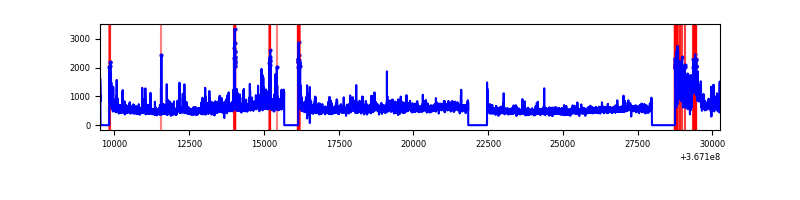 |
| D | 20734 | 18563 | 99 | 99 | 0.48% | 0.53% | 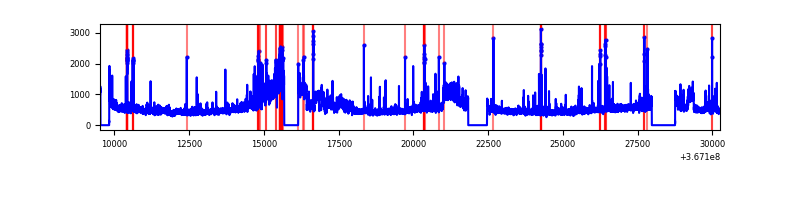 |
Top three noisy pixels from each quadrant. If the there are fewer than three noisy pixels in the level2.evt file, extra rows are filled as -1
| Pixel properties | Quadrant properties | ||||||
|---|---|---|---|---|---|---|---|
| Quadrant | DetID | PixID | Counts | Sigma | Mean | Median | Sigma |
| A | 13 | 254 | 28152 | 55.89 | 2313 | 2272 | 463.1 |
| A | 3 | 137 | 24029 | 46.98 | 2313 | 2272 | 463.1 |
| A | 0 | 226 | 19089 | 36.32 | 2313 | 2272 | 463.1 |
| B | 6 | 159 | 4899254 | 11271.85 | 2279 | 2221 | 434.4 |
| B | 0 | 213 | 112674 | 254.24 | 2279 | 2221 | 434.4 |
| B | 10 | 247 | 98213 | 220.95 | 2279 | 2221 | 434.4 |
| C | 3 | 233 | 866942 | 1677.93 | 2201 | 2218 | 515.4 |
| C | 10 | 22 | 784245 | 1517.46 | 2201 | 2218 | 515.4 |
| C | 0 | 10 | 610133 | 1179.61 | 2201 | 2218 | 515.4 |
| D | 8 | 195 | 1959289 | 3646.47 | 2233 | 2176 | 536.7 |
| D | 12 | 233 | 171706 | 315.87 | 2233 | 2176 | 536.7 |
| D | 2 | 250 | 131860 | 241.63 | 2233 | 2176 | 536.7 |
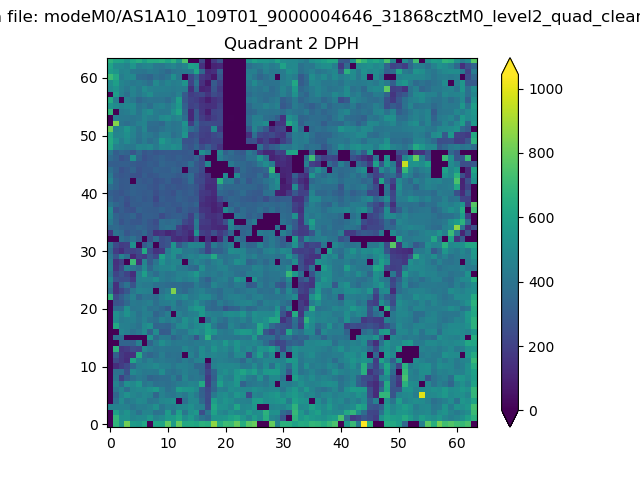
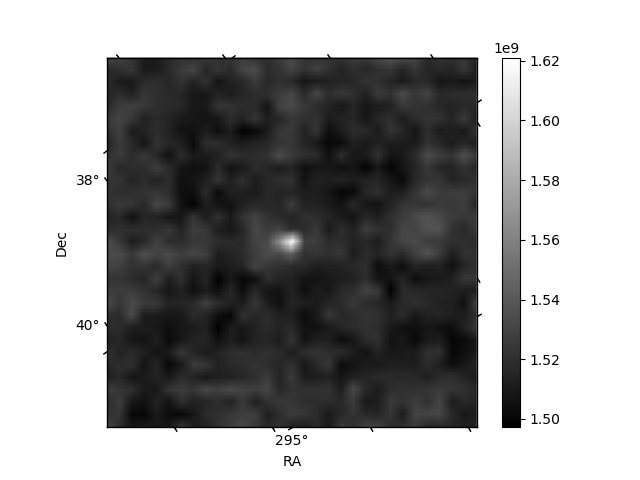
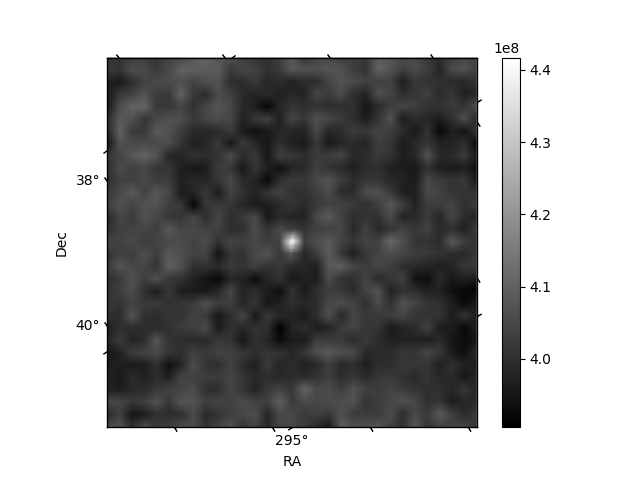
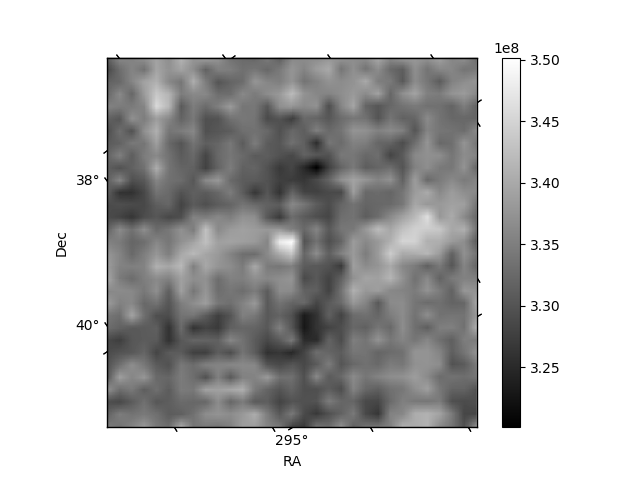
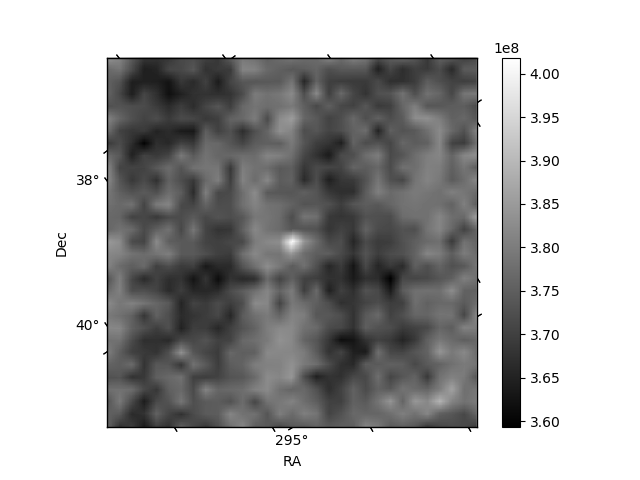
Histogram calculated using DETX and DETY for each event in the final _common_clean file
| Quadrant A | 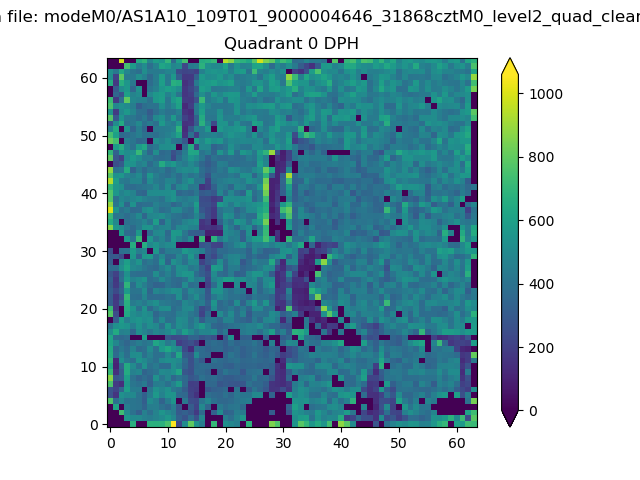 |
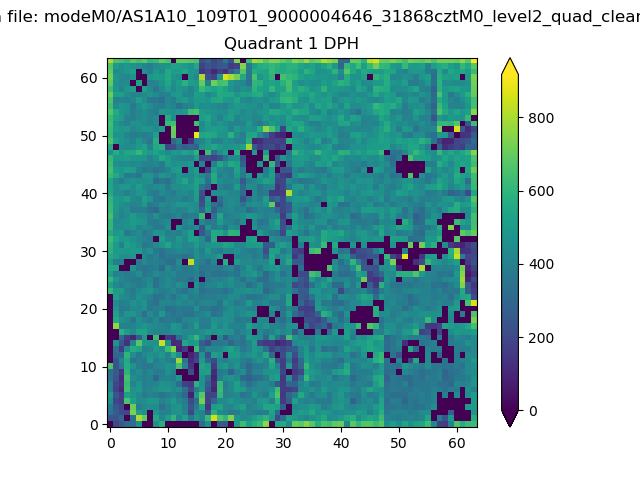 |
Quadrant B |
|---|---|---|---|
| Quadrant D | 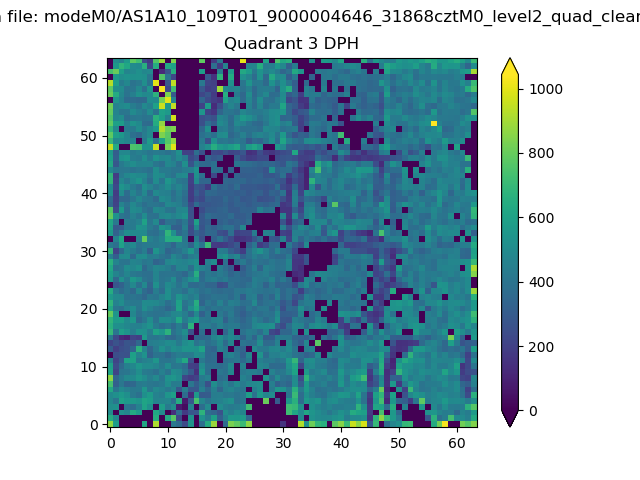 |
 |
Quadrant C |
| Plot type | Count rate plots | Images |
|---|---|---|
| Comparison with Poisson distribution Blue bars denote a histogram of data divided into 1 sec bins. Red curve is a Poisson curve with rate = median count rate of data. |
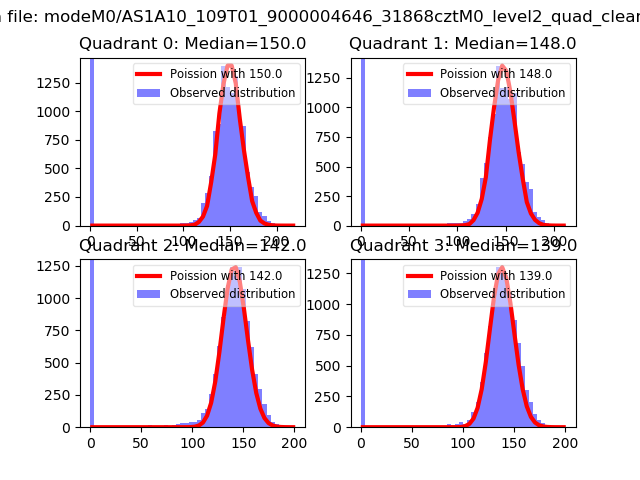 |
 |
| Quadrant-wise count rates Data is divided into 100 sec bins |
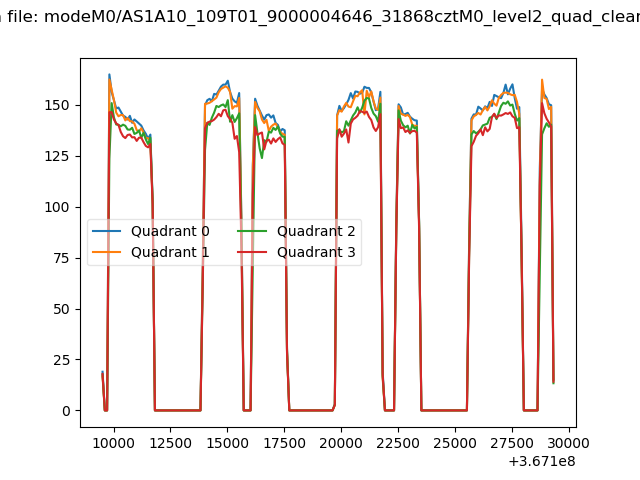 |
|
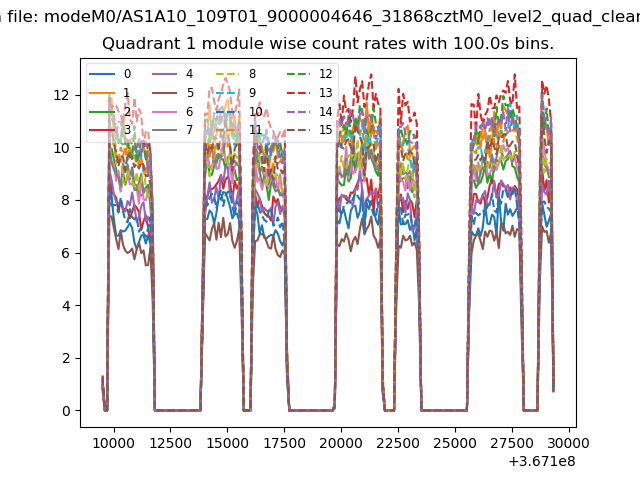
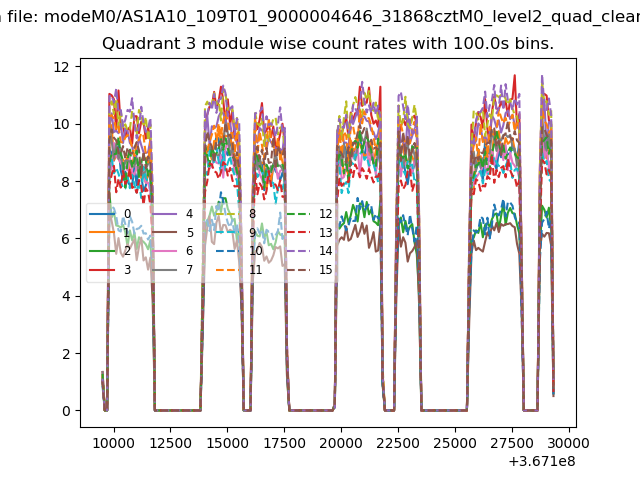
| Module-wise count rates for Quadrant A Data is divided into 100 sec bins |
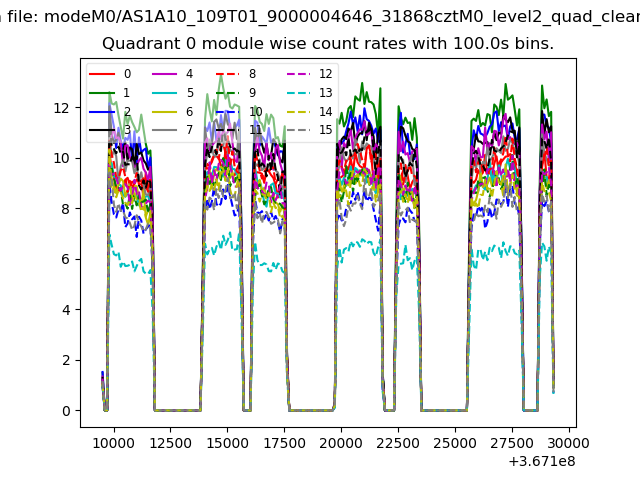 |
 |
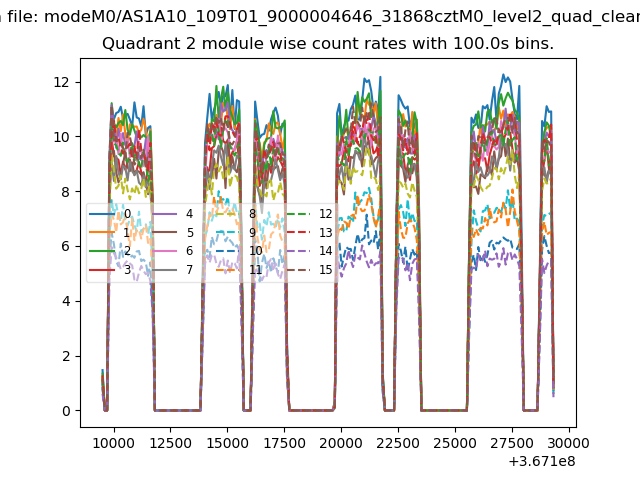
| Module-wise count rates for Quadrant B Data is divided into 100 sec bins |
 |
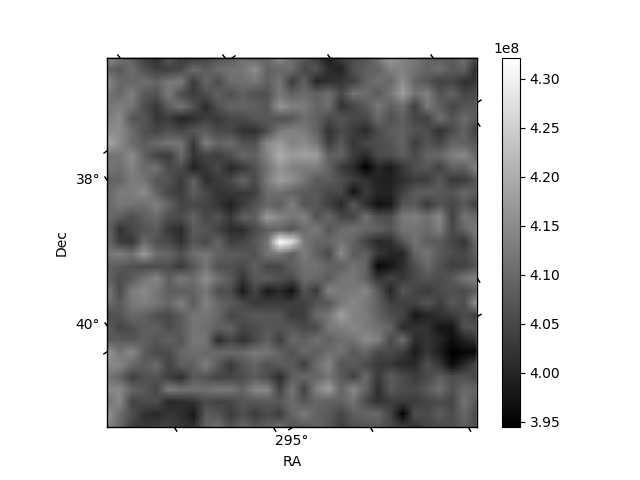 |
| Module-wise count rates for Quadrant C Data is divided into 100 sec bins |
 |
 |
| Module-wise count rates for Quadrant D Data is divided into 100 sec bins |
 |
 |
| Parameter | Plot |
|---|---|
| CZT HV Monitor | 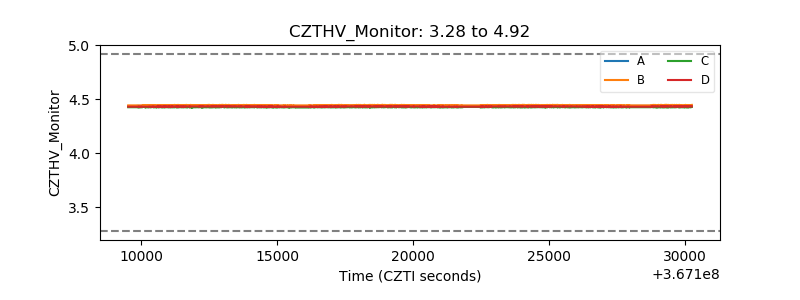 |
| D_VDD | 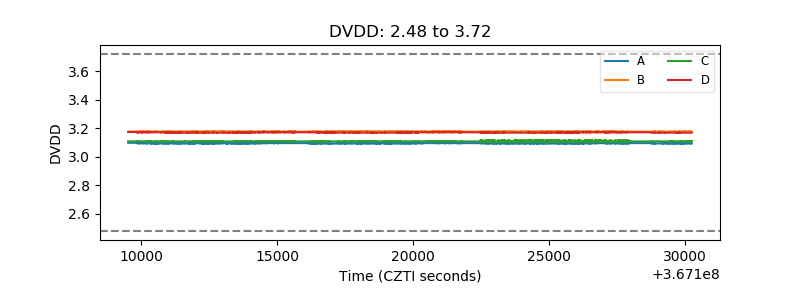 |
| Temperature 1 | 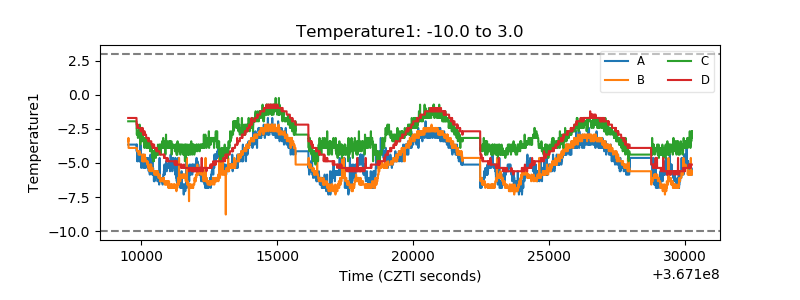 |
| Veto HV Monitor | 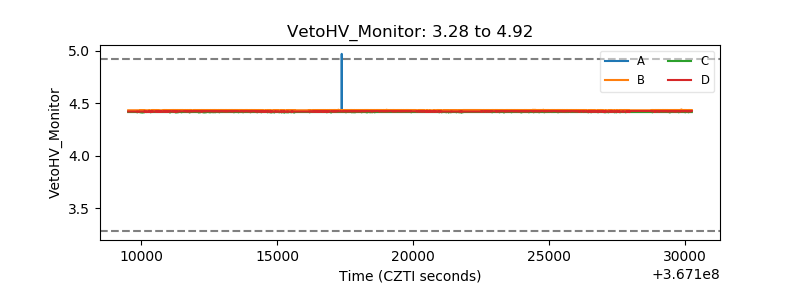 |
| Veto LLD | 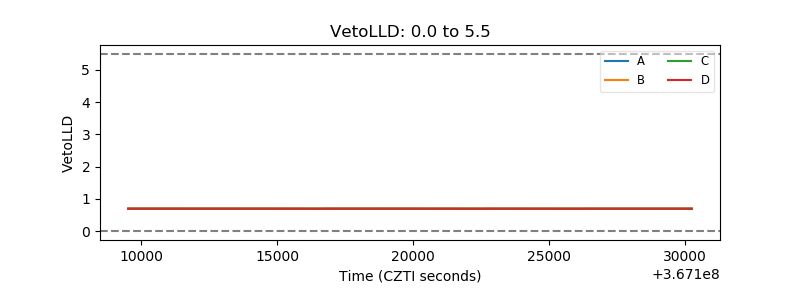 |
| Alpha Counter | 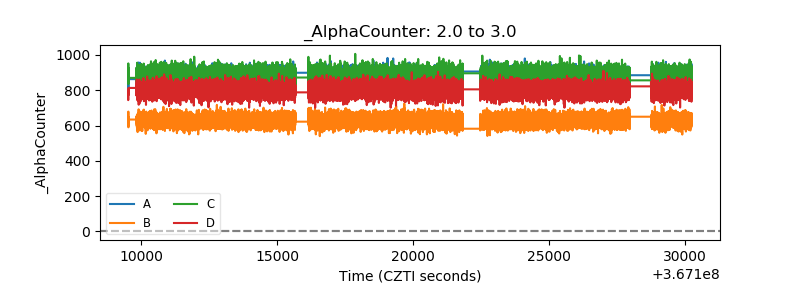 |
| _CPM_Rate | 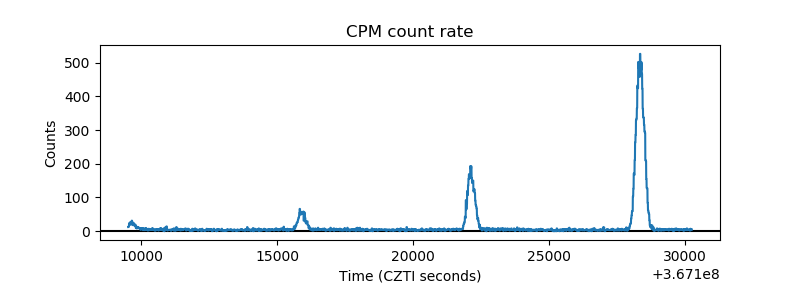 |
| CZT Counter | 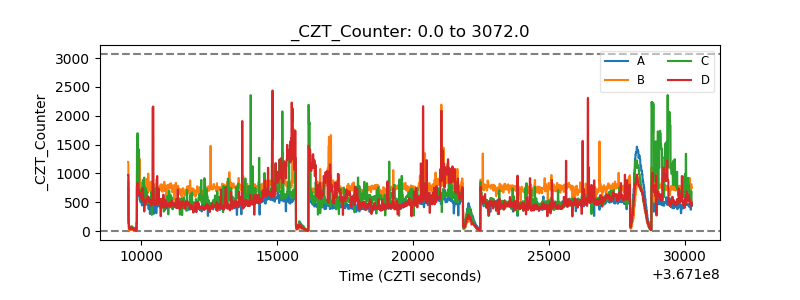 |
| +2.5 Volts monitor |  |
| +5 Volts monitor | 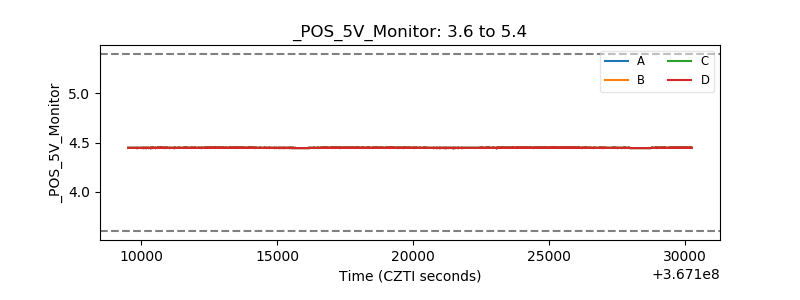 |
| _ROLL_ROT | 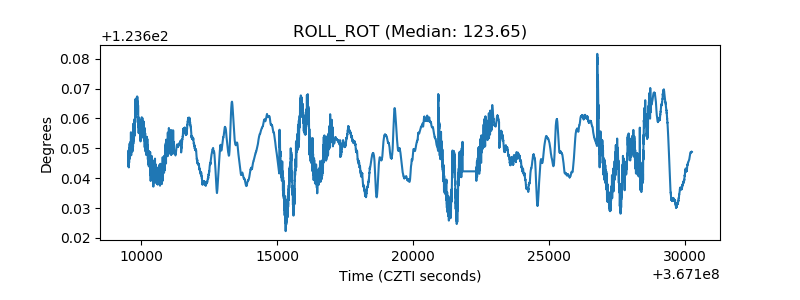 |
| _Roll_DEC | 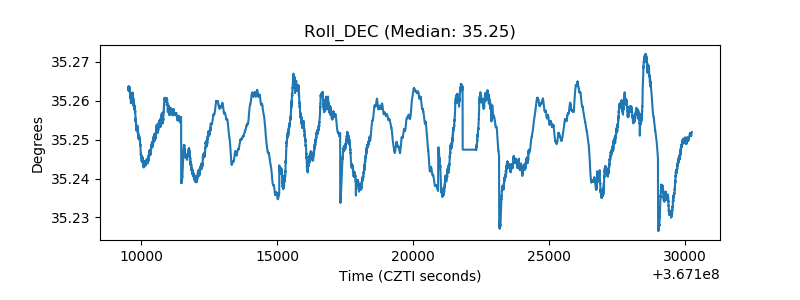 |
| _Roll_RA | 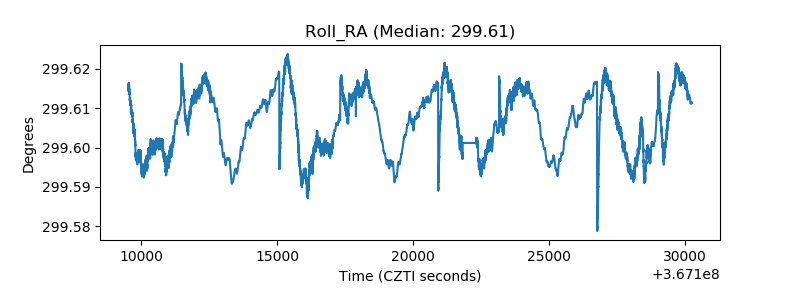 |
| Veto Counter | 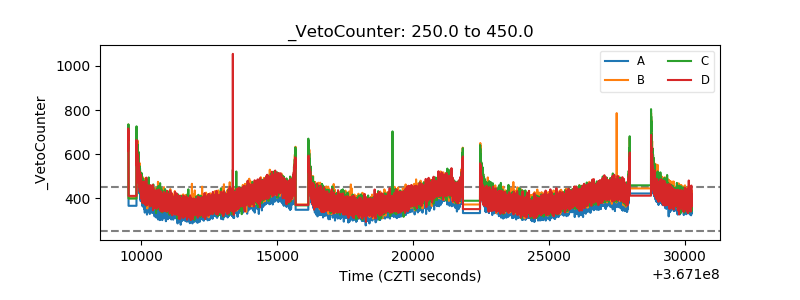 |