| Param | Original file | Final file |
|---|---|---|
| Filename | modeM0/AS1A10_109T01_9000004646_31869cztM0_level2.evt | modeM0/AS1A10_109T01_9000004646_31869cztM0_level2_quad_clean.evt |
| Size (bytes) | 584,049,600 | 79,755,840 |
| Size | 557.0 MB | 76.1 MB |
| Events in quadrant A | 3,304,520 | 506,853 |
| Events in quadrant B | 5,059,991 | 502,784 |
| Events in quadrant C | 4,860,901 | 472,661 |
| Events in quadrant D | 4,013,538 | 470,047 |
| Mode SS | |||
|---|---|---|---|
| Quadrant | BADHDUFLAG | Total packets | Discarded packets |
| A | 0 | 132 | 0 |
| B | 0 | 132 | 0 |
| C | 0 | 132 | 0 |
| D | 0 | 132 | 0 |
| Mode M0 | |||
|---|---|---|---|
| Quadrant | BADHDUFLAG | Total packets | Discarded packets |
| A | 0 | 13708 | 2 |
| B | 0 | 20148 | 2 |
| C | 0 | 18644 | 2 |
| D | 0 | 16197 | 3 |
| Mode M9 | |||
|---|---|---|---|
| Quadrant | BADHDUFLAG | Total packets | Discarded packets |
| A | 0 | 10 | 0 |
| B | 0 | 11 | 0 |
| C | 0 | 11 | 0 |
| D | 0 | 11 | 0 |
| Quadrant | Total seconds | Saturated seconds | Saturation percentage |
|---|---|---|---|
| A | 6645 | 61 | 0.917983% |
| B | 6645 | 138 | 2.076749% |
| C | 6645 | 365 | 5.492852% |
| D | 6644 | 66 | 0.993377% |
Noise dominated data is calculated using 1-second bins in cleaned event files. If a bin has >2000 counts, and if more than 50% of those come from <1% of pixels, then it is considered to be noise-dominated and hence unusable.
| Quadrant | # 1 sec bins | Bins with >0 counts | Bins with >2000 counts | High rate bins dominated by noise | Noise dominated (total time) | Noise dominated (detector-on time) | Marked lightcurve |
|---|---|---|---|---|---|---|---|
| A | 7561 | 6646 | 0 | 0 | 0.00% | 0.00% | 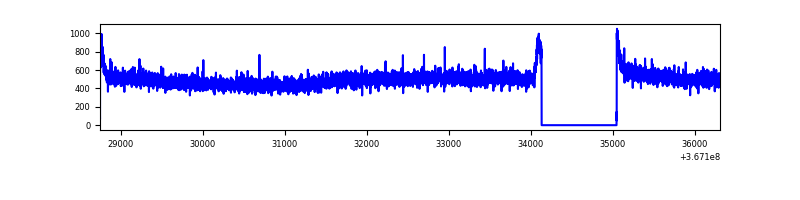 |
| B | 7561 | 6646 | 7 | 7 | 0.09% | 0.11% | 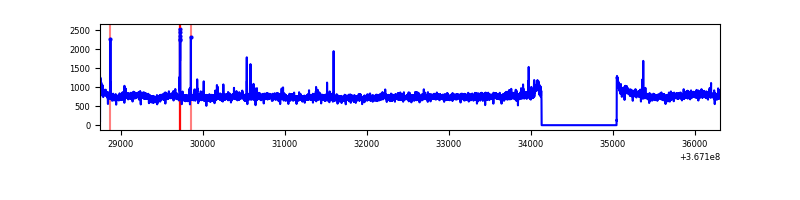 |
| C | 7561 | 6646 | 144 | 144 | 1.90% | 2.17% | 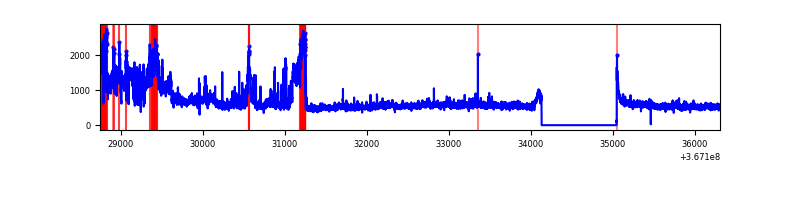 |
| D | 7560 | 6645 | 22 | 22 | 0.29% | 0.33% | 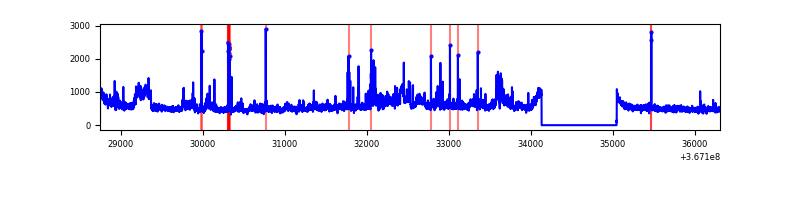 |
Top three noisy pixels from each quadrant. If the there are fewer than three noisy pixels in the level2.evt file, extra rows are filled as -1
| Pixel properties | Quadrant properties | ||||||
|---|---|---|---|---|---|---|---|
| Quadrant | DetID | PixID | Counts | Sigma | Mean | Median | Sigma |
| A | 13 | 254 | 10096 | 53.79 | 856 | 842 | 172.0 |
| A | 3 | 137 | 8750 | 45.97 | 856 | 842 | 172.0 |
| A | 0 | 226 | 7042 | 36.04 | 856 | 842 | 172.0 |
| B | 6 | 159 | 1674924 | 10377.56 | 840 | 820 | 161.3 |
| B | 10 | 247 | 39159 | 237.66 | 840 | 820 | 161.3 |
| B | 12 | 111 | 20362 | 121.14 | 840 | 820 | 161.3 |
| C | 10 | 22 | 1152993 | 6088.47 | 805 | 811 | 189.2 |
| C | 3 | 233 | 351401 | 1852.62 | 805 | 811 | 189.2 |
| C | 14 | 238 | 138330 | 726.69 | 805 | 811 | 189.2 |
| D | 8 | 195 | 707836 | 3610.24 | 819 | 799 | 195.8 |
| D | 2 | 250 | 65993 | 332.89 | 819 | 799 | 195.8 |
| D | 13 | 249 | 65444 | 330.09 | 819 | 799 | 195.8 |
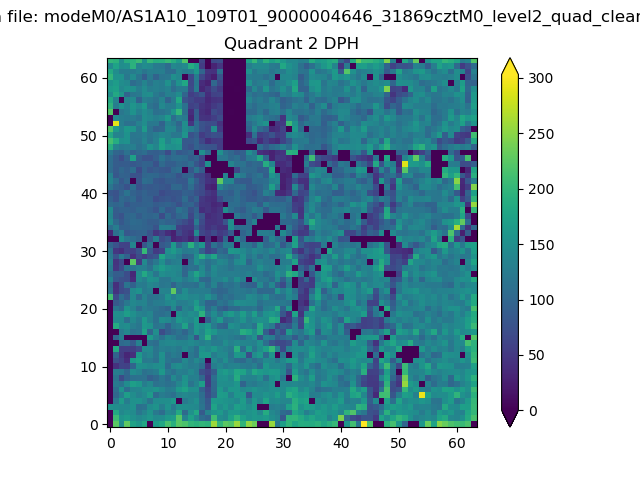
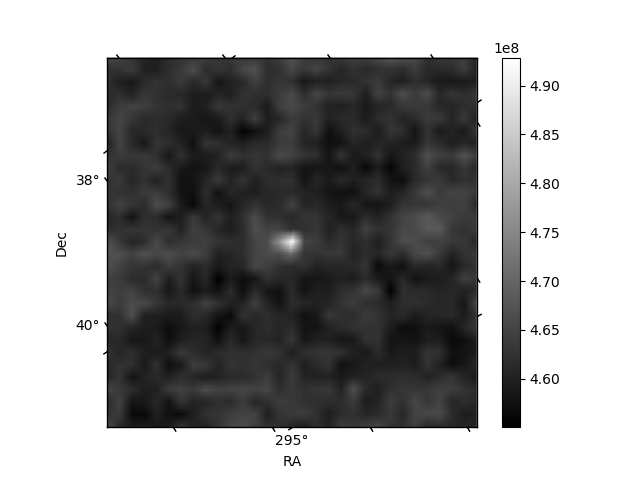
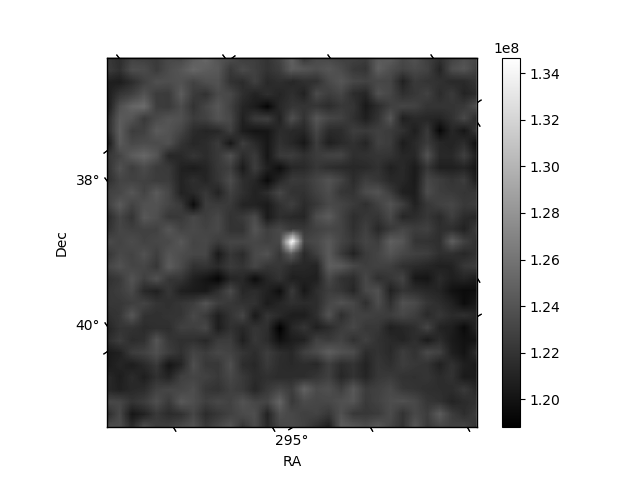
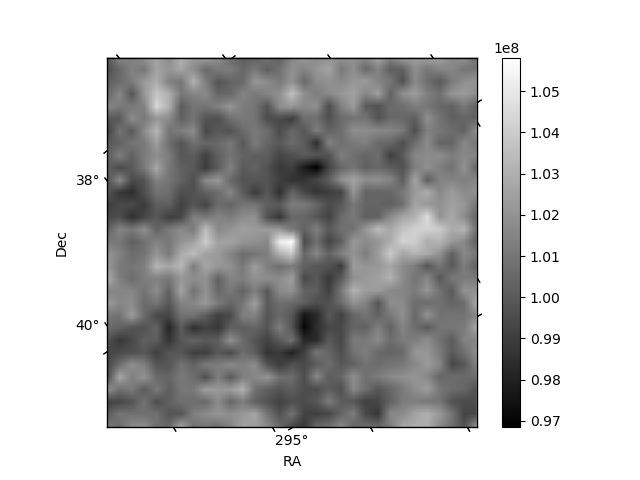
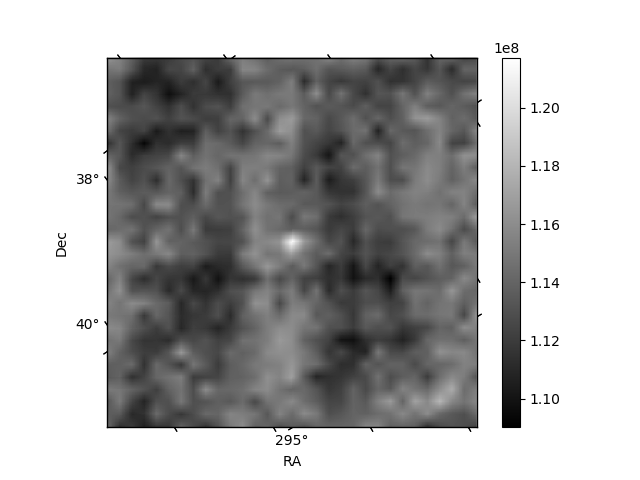
Histogram calculated using DETX and DETY for each event in the final _common_clean file
| Quadrant A | 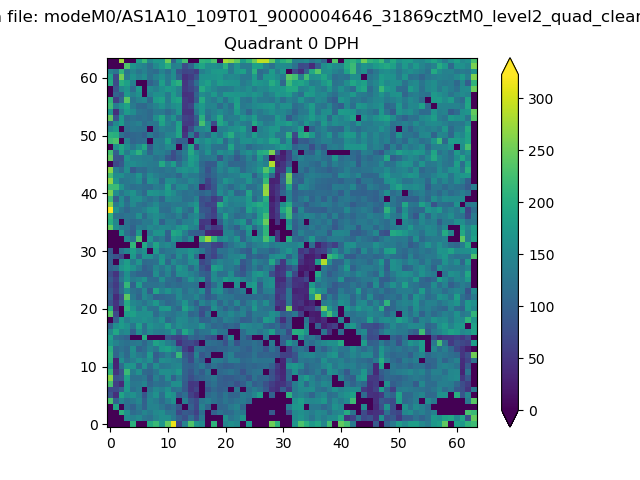 |
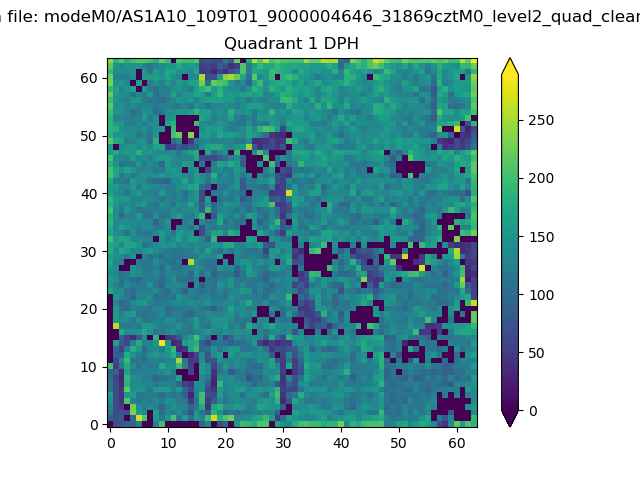 |
Quadrant B |
|---|---|---|---|
| Quadrant D | 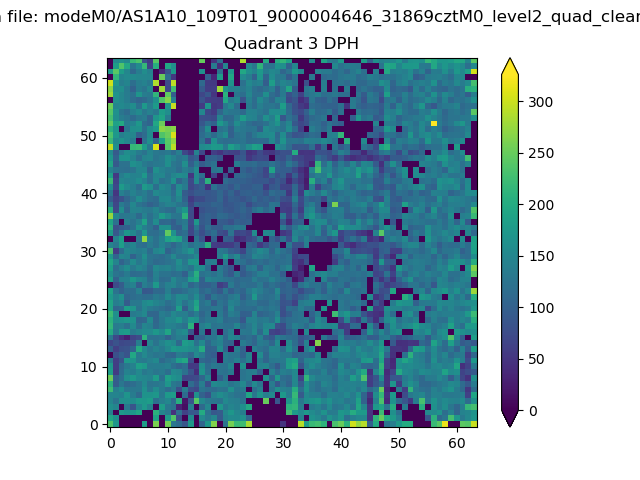 |
 |
Quadrant C |
| Plot type | Count rate plots | Images |
|---|---|---|
| Comparison with Poisson distribution Blue bars denote a histogram of data divided into 1 sec bins. Red curve is a Poisson curve with rate = median count rate of data. |
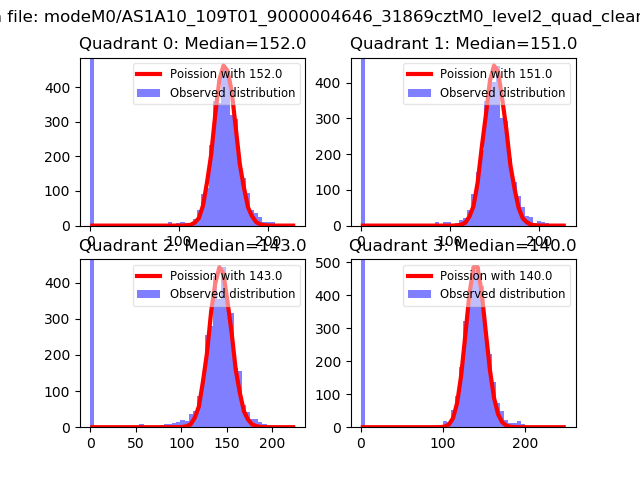 |
 |
| Quadrant-wise count rates Data is divided into 100 sec bins |
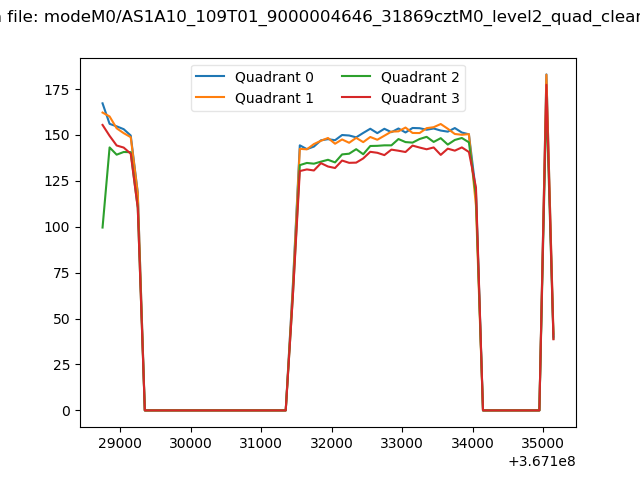 |
|
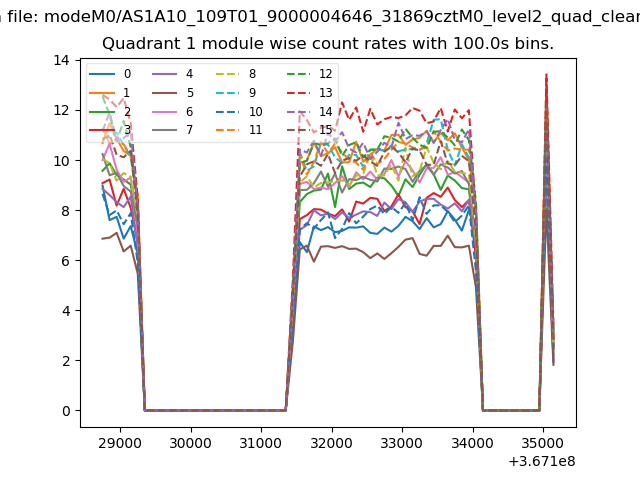
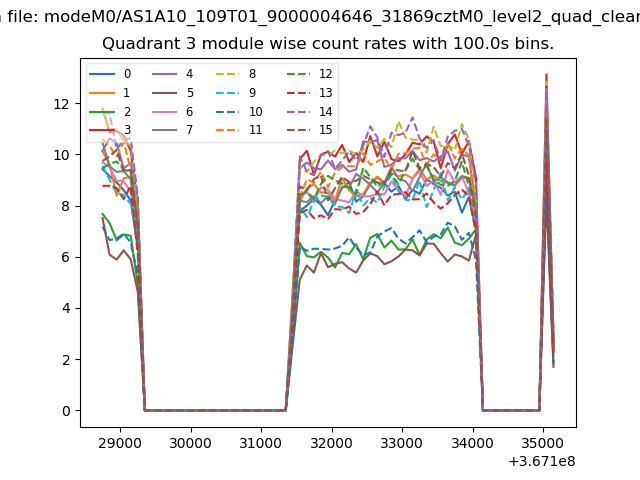
| Module-wise count rates for Quadrant A Data is divided into 100 sec bins |
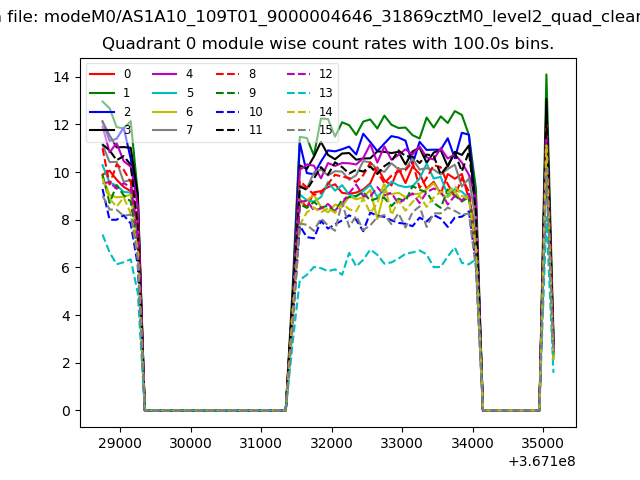 |
 |
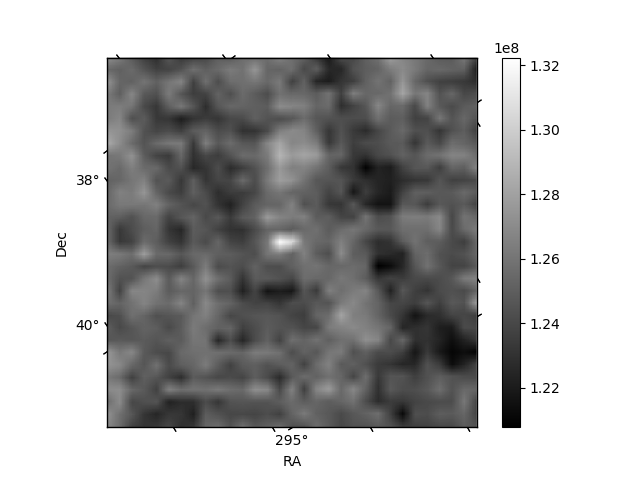
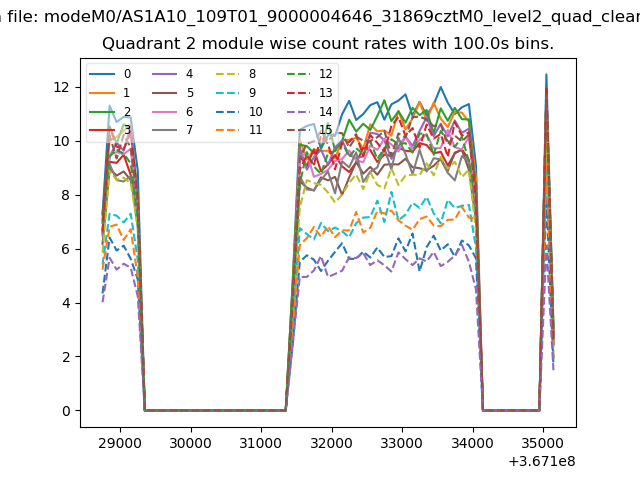
| Module-wise count rates for Quadrant B Data is divided into 100 sec bins |
 |
 |
| Module-wise count rates for Quadrant C Data is divided into 100 sec bins |
 |
 |
| Module-wise count rates for Quadrant D Data is divided into 100 sec bins |
 |
 |
| Parameter | Plot |
|---|---|
| CZT HV Monitor | 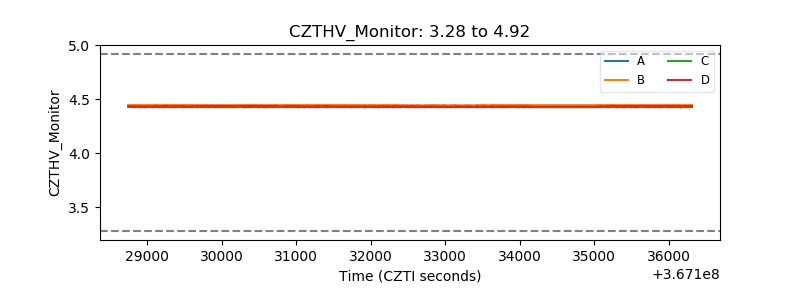 |
| D_VDD | 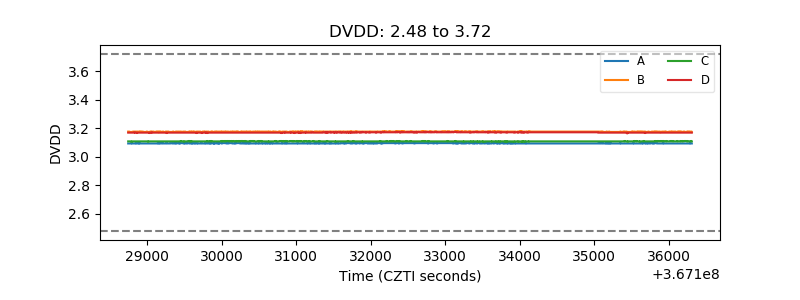 |
| Temperature 1 | 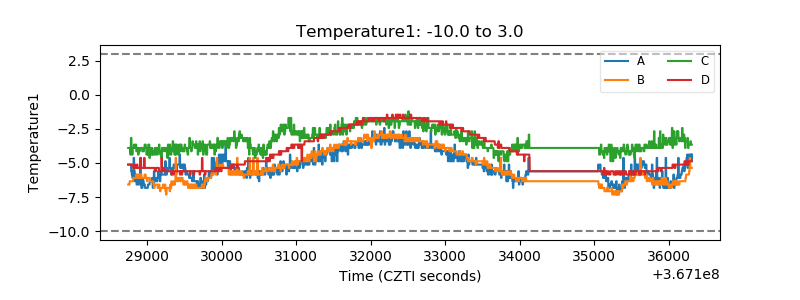 |
| Veto HV Monitor | 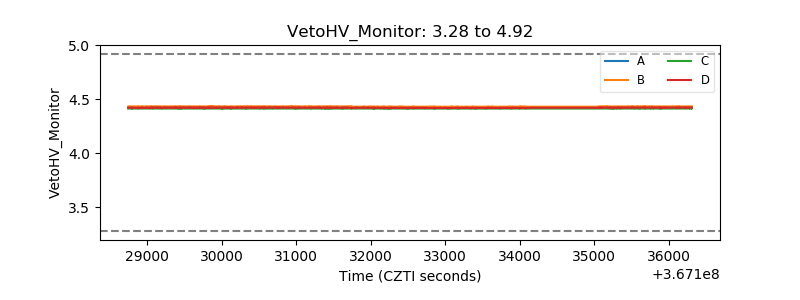 |
| Veto LLD | 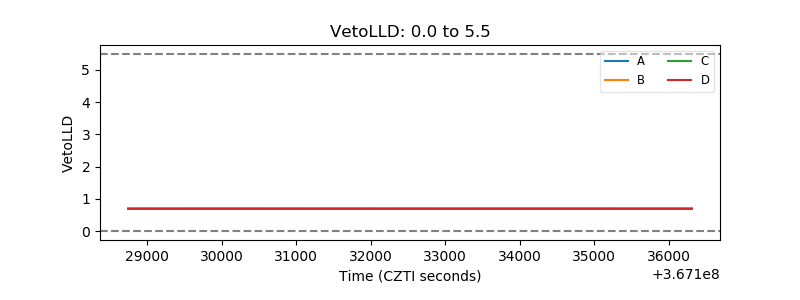 |
| Alpha Counter |  |
| _CPM_Rate | 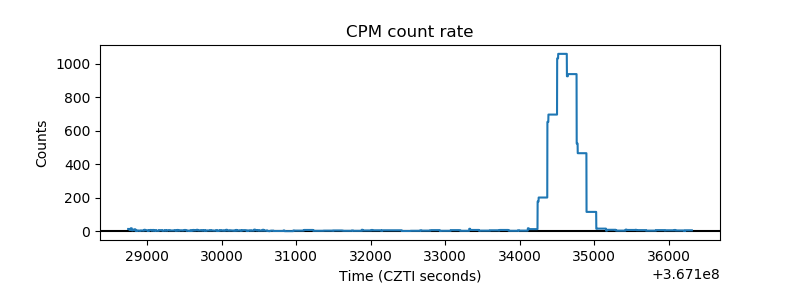 |
| CZT Counter | 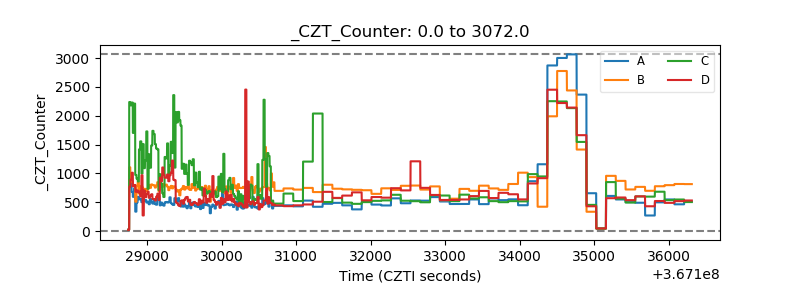 |
| +2.5 Volts monitor |  |
| +5 Volts monitor |  |
| _ROLL_ROT | 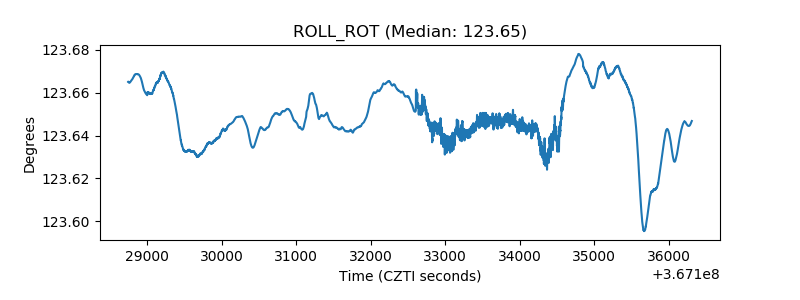 |
| _Roll_DEC | 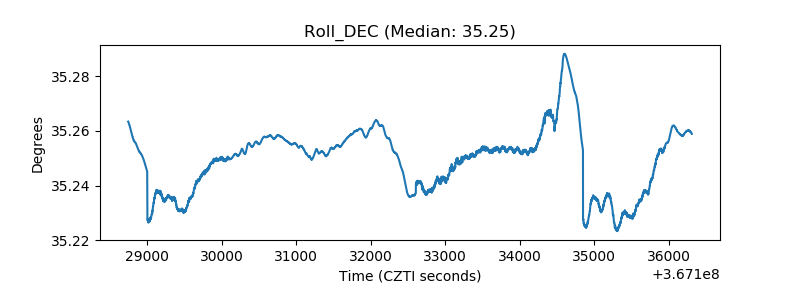 |
| _Roll_RA | 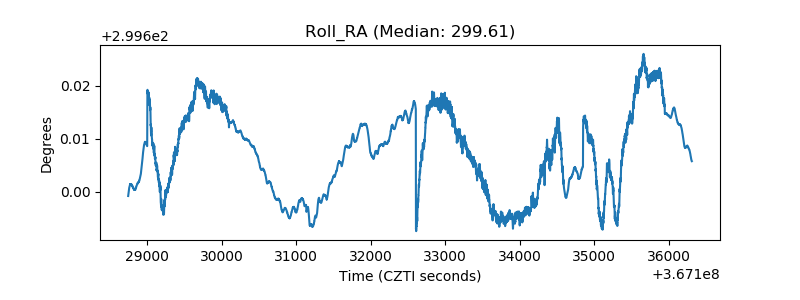 |
| Veto Counter | 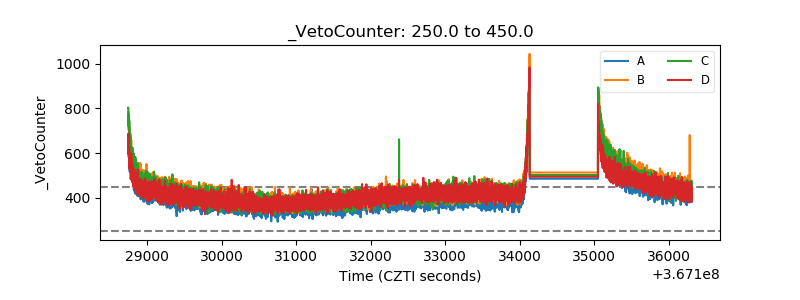 |