| Param | Original file | Final file |
|---|---|---|
| Filename | modeM0/AS1A10_109T01_9000004646_31873cztM0_level2.evt | modeM0/AS1A10_109T01_9000004646_31873cztM0_level2_quad_clean.evt |
| Size (bytes) | 600,356,160 | 101,957,760 |
| Size | 572.5 MB | 97.2 MB |
| Events in quadrant A | 3,799,145 | 686,396 |
| Events in quadrant B | 5,555,147 | 675,145 |
| Events in quadrant C | 4,000,285 | 641,360 |
| Events in quadrant D | 4,387,252 | 630,939 |
| Mode SS | |||
|---|---|---|---|
| Quadrant | BADHDUFLAG | Total packets | Discarded packets |
| A | 0 | 132 | 0 |
| B | 0 | 132 | 0 |
| C | 0 | 132 | 0 |
| D | 0 | 132 | 0 |
| Mode M0 | |||
|---|---|---|---|
| Quadrant | BADHDUFLAG | Total packets | Discarded packets |
| A | 0 | 15456 | 2 |
| B | 0 | 20759 | 2 |
| C | 0 | 16101 | 2 |
| D | 0 | 17355 | 2 |
| Mode M9 | |||
|---|---|---|---|
| Quadrant | BADHDUFLAG | Total packets | Discarded packets |
| A | 0 | 18 | 0 |
| B | 0 | 19 | 0 |
| C | 0 | 19 | 0 |
| D | 0 | 19 | 0 |
| Quadrant | Total seconds | Saturated seconds | Saturation percentage |
|---|---|---|---|
| A | 6511 | 104 | 1.597297% |
| B | 6511 | 185 | 2.841345% |
| C | 6511 | 231 | 3.547842% |
| D | 6511 | 147 | 2.257718% |
Noise dominated data is calculated using 1-second bins in cleaned event files. If a bin has >2000 counts, and if more than 50% of those come from <1% of pixels, then it is considered to be noise-dominated and hence unusable.
| Quadrant | # 1 sec bins | Bins with >0 counts | Bins with >2000 counts | High rate bins dominated by noise | Noise dominated (total time) | Noise dominated (detector-on time) | Marked lightcurve |
|---|---|---|---|---|---|---|---|
| A | 7771 | 6512 | 0 | 0 | 0.00% | 0.00% | 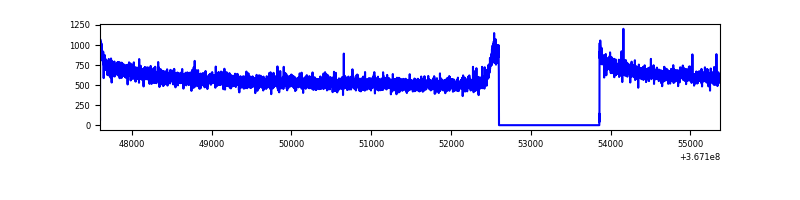 |
| B | 7771 | 6512 | 2 | 2 | 0.03% | 0.03% | 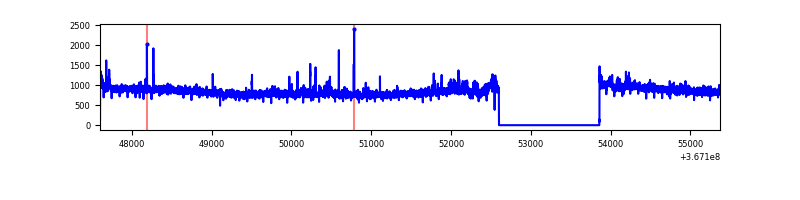 |
| C | 7771 | 6512 | 17 | 17 | 0.22% | 0.26% | 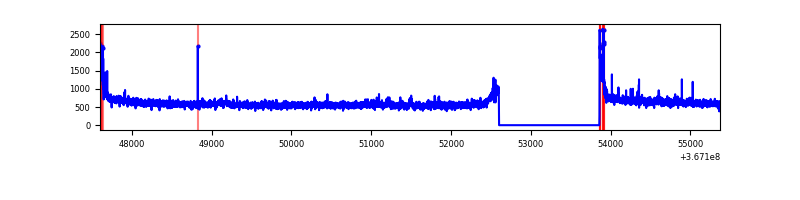 |
| D | 7771 | 6512 | 62 | 62 | 0.80% | 0.95% | 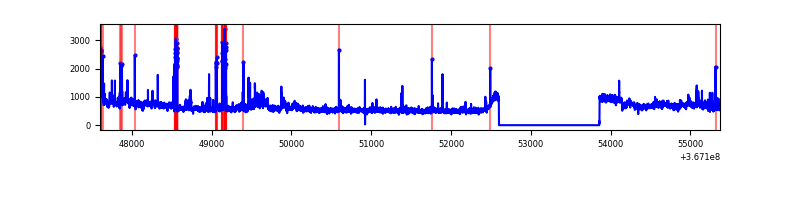 |
Top three noisy pixels from each quadrant. If the there are fewer than three noisy pixels in the level2.evt file, extra rows are filled as -1
| Pixel properties | Quadrant properties | ||||||
|---|---|---|---|---|---|---|---|
| Quadrant | DetID | PixID | Counts | Sigma | Mean | Median | Sigma |
| A | 13 | 254 | 11115 | 52.1 | 983 | 971 | 194.7 |
| A | 13 | 6 | 9899 | 45.85 | 983 | 971 | 194.7 |
| A | 3 | 137 | 9046 | 41.47 | 983 | 971 | 194.7 |
| B | 6 | 159 | 1686010 | 9550.64 | 951 | 932 | 176.4 |
| B | 0 | 218 | 51083 | 284.24 | 951 | 932 | 176.4 |
| B | 10 | 247 | 32767 | 180.43 | 951 | 932 | 176.4 |
| C | 3 | 233 | 172431 | 823.47 | 907 | 918 | 208.3 |
| C | 14 | 238 | 157540 | 751.98 | 907 | 918 | 208.3 |
| C | 0 | 10 | 100476 | 478.0 | 907 | 918 | 208.3 |
| D | 8 | 195 | 556286 | 2531.09 | 929 | 908 | 219.4 |
| D | 12 | 218 | 229693 | 1042.67 | 929 | 908 | 219.4 |
| D | 12 | 79 | 39283 | 174.89 | 929 | 908 | 219.4 |
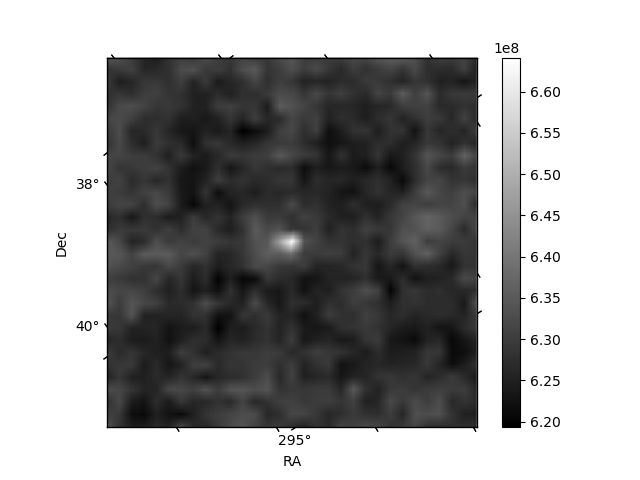
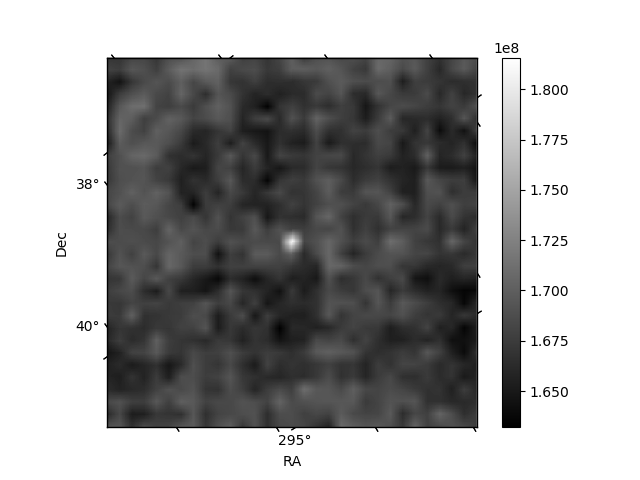
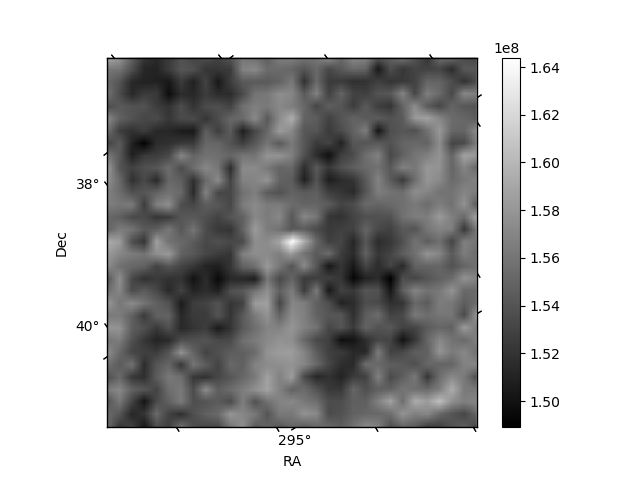
Histogram calculated using DETX and DETY for each event in the final _common_clean file
| Quadrant A | 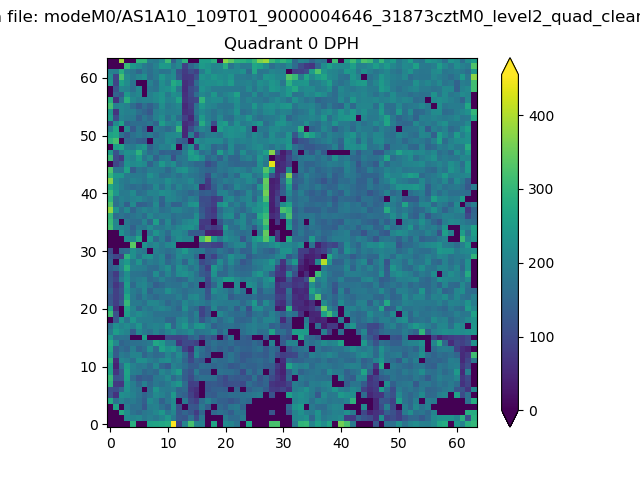 |
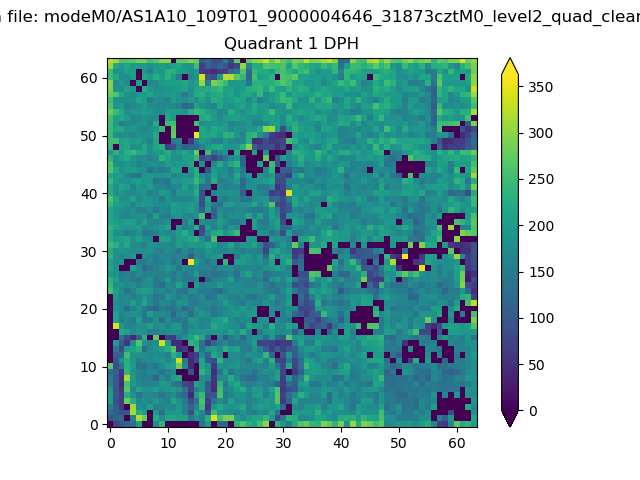 |
Quadrant B |
|---|---|---|---|
| Quadrant D | 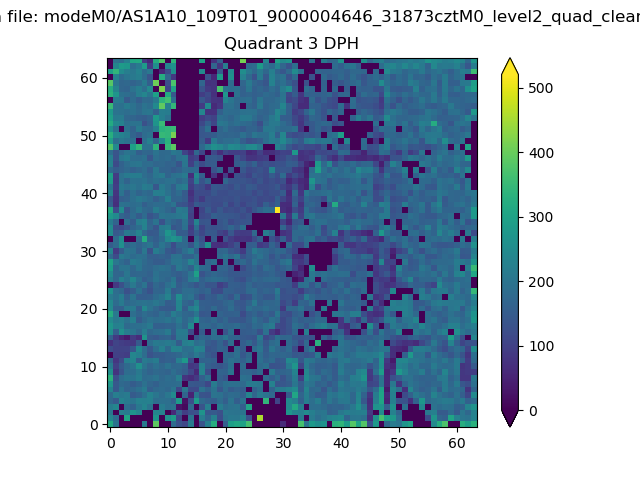 |
 |
Quadrant C |
| Plot type | Count rate plots | Images |
|---|---|---|
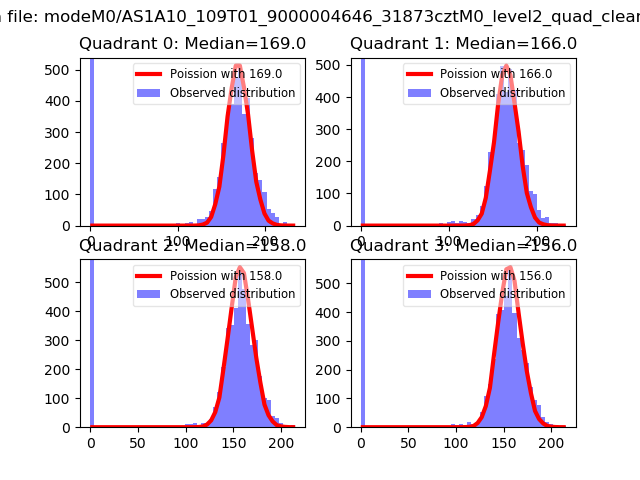
| Comparison with Poisson distribution Blue bars denote a histogram of data divided into 1 sec bins. Red curve is a Poisson curve with rate = median count rate of data. |
 |
 |
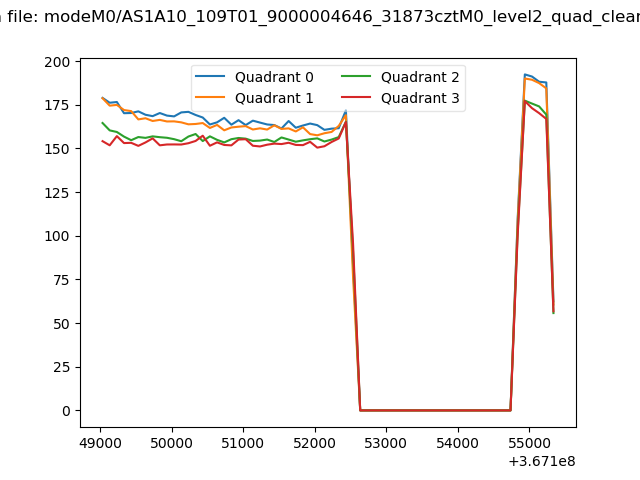
| Quadrant-wise count rates Data is divided into 100 sec bins |
 |
|
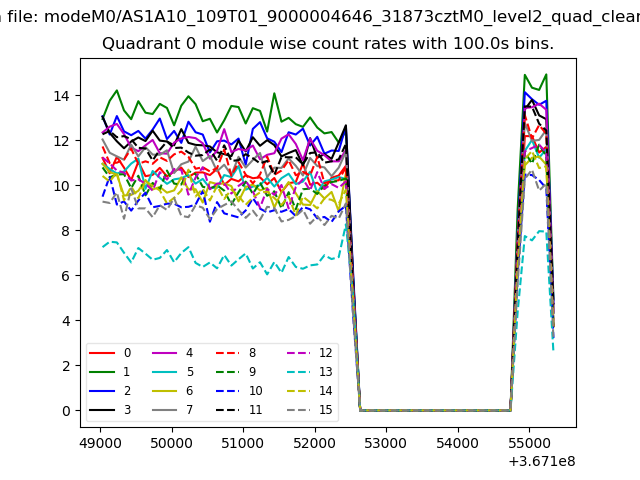
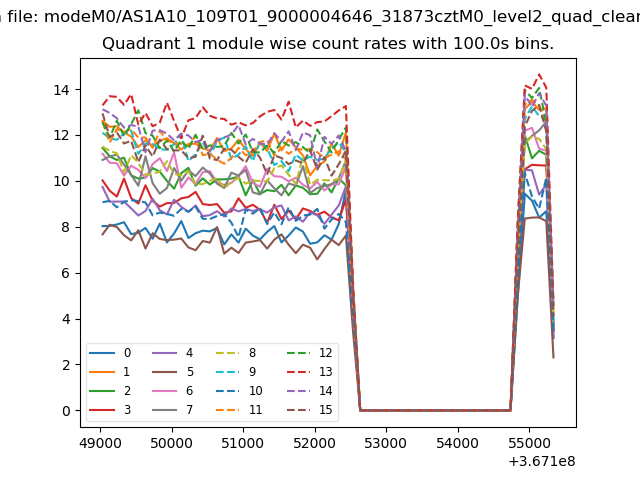
| Module-wise count rates for Quadrant A Data is divided into 100 sec bins |
 |
 |
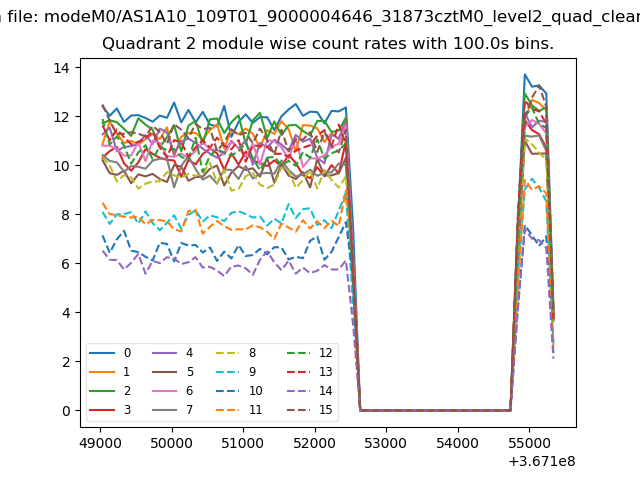
| Module-wise count rates for Quadrant B Data is divided into 100 sec bins |
 |
 |
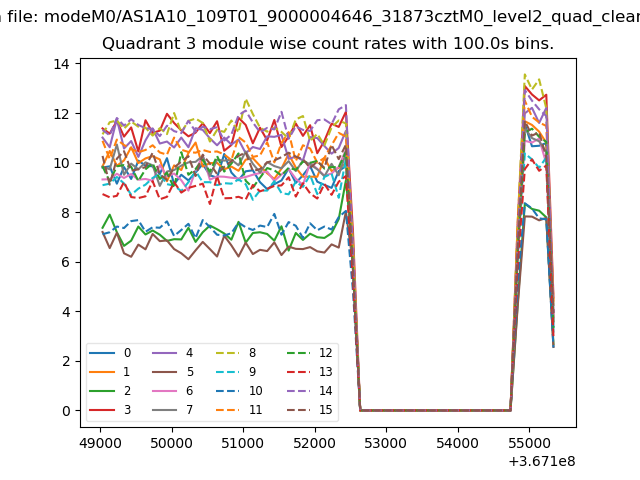
| Module-wise count rates for Quadrant C Data is divided into 100 sec bins |
 |
 |
| Module-wise count rates for Quadrant D Data is divided into 100 sec bins |
 |
 |
| Parameter | Plot |
|---|---|
| CZT HV Monitor | 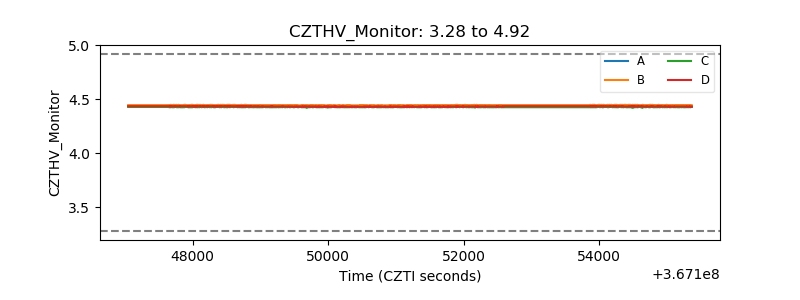 |
| D_VDD | 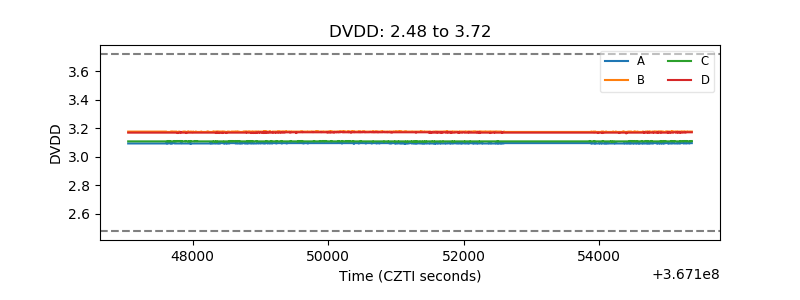 |
| Temperature 1 | 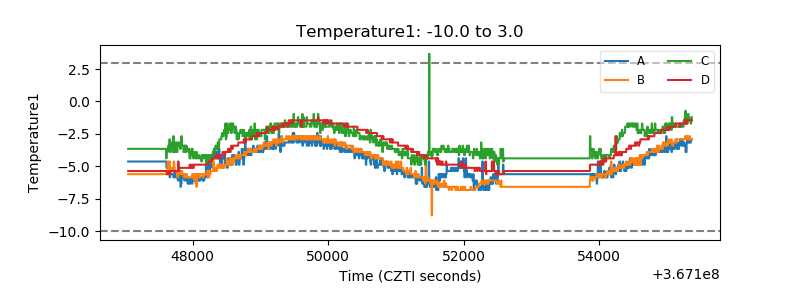 |
| Veto HV Monitor | 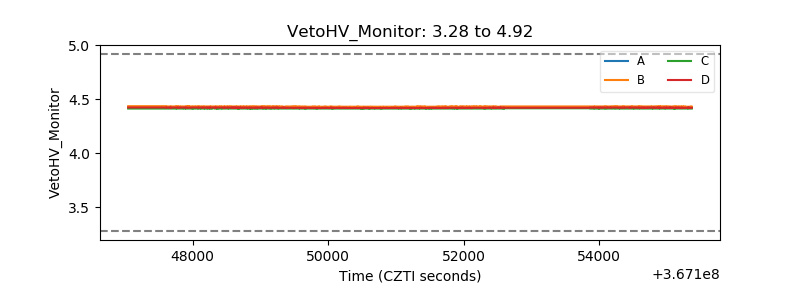 |
| Veto LLD | 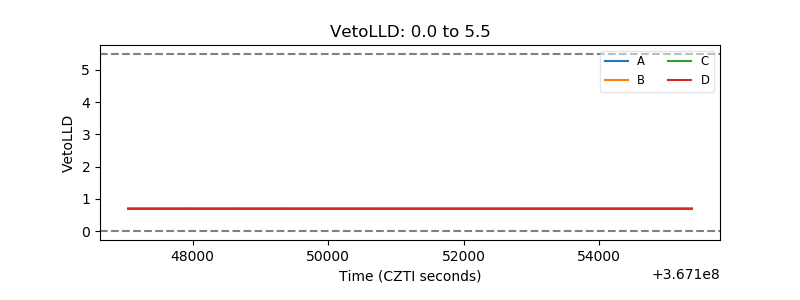 |
| Alpha Counter | 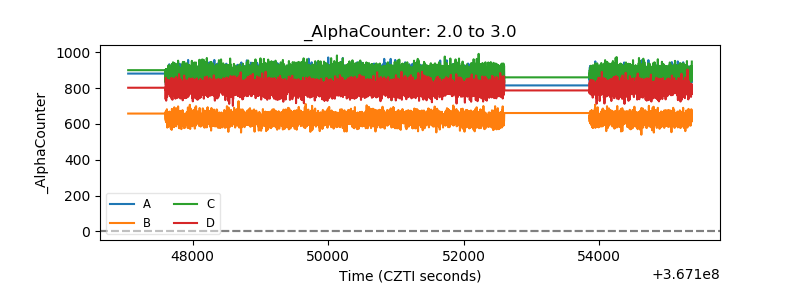 |
| _CPM_Rate | 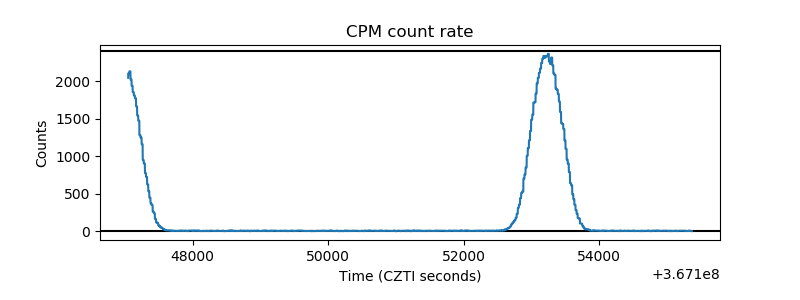 |
| CZT Counter | 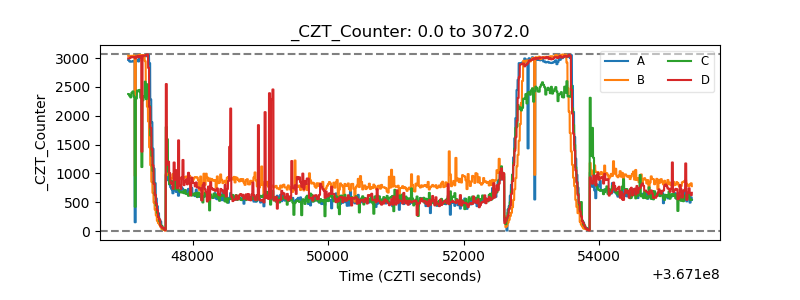 |
| +2.5 Volts monitor |  |
| +5 Volts monitor | 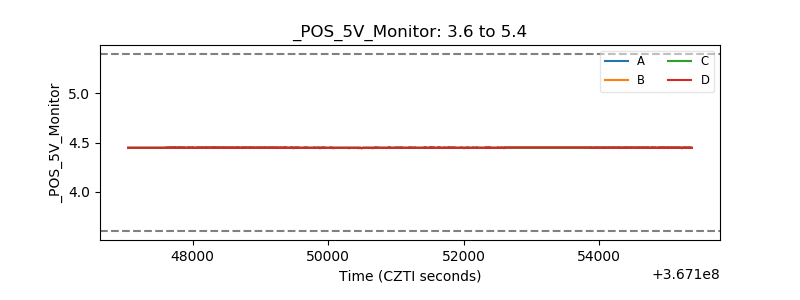 |
| _ROLL_ROT |  |
| _Roll_DEC | 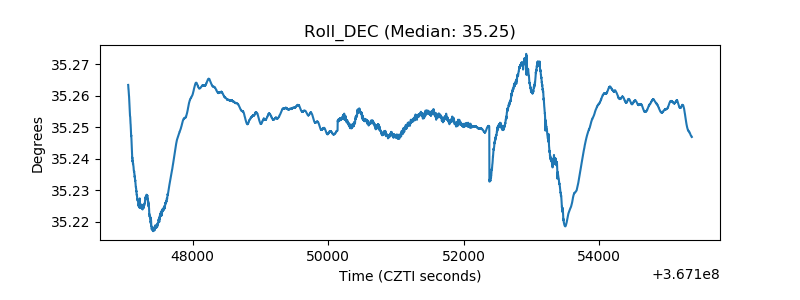 |
| _Roll_RA | 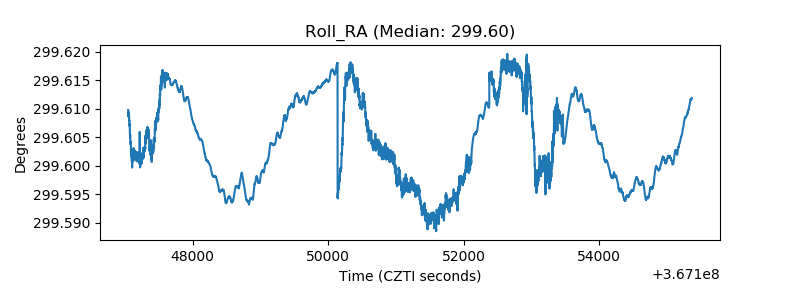 |
| Veto Counter | 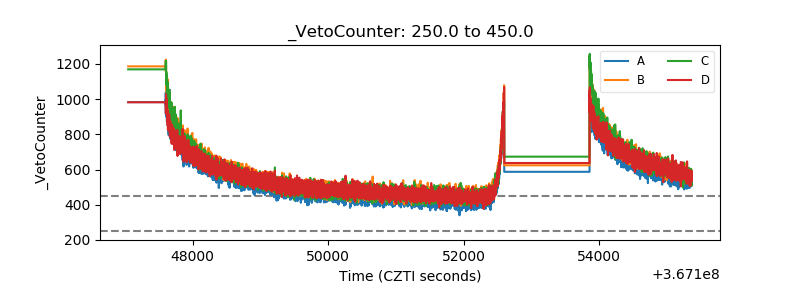 |