| Param | Original file | Final file |
|---|---|---|
| Filename | modeM0/AS1A10_109T01_9000004646_31874cztM0_level2.evt | modeM0/AS1A10_109T01_9000004646_31874cztM0_level2_quad_clean.evt |
| Size (bytes) | 593,046,720 | 116,472,960 |
| Size | 565.6 MB | 111.1 MB |
| Events in quadrant A | 3,782,922 | 803,690 |
| Events in quadrant B | 5,459,145 | 788,105 |
| Events in quadrant C | 3,993,977 | 749,906 |
| Events in quadrant D | 4,290,759 | 738,339 |
| Mode SS | |||
|---|---|---|---|
| Quadrant | BADHDUFLAG | Total packets | Discarded packets |
| A | 0 | 132 | 0 |
| B | 0 | 132 | 0 |
| C | 0 | 132 | 0 |
| D | 0 | 132 | 0 |
| Mode M0 | |||
|---|---|---|---|
| Quadrant | BADHDUFLAG | Total packets | Discarded packets |
| A | 0 | 15583 | 2 |
| B | 0 | 20460 | 5 |
| C | 0 | 16275 | 2 |
| D | 0 | 17170 | 2 |
| Mode M9 | |||
|---|---|---|---|
| Quadrant | BADHDUFLAG | Total packets | Discarded packets |
| A | 0 | 25 | 0 |
| B | 0 | 26 | 0 |
| C | 0 | 26 | 0 |
| D | 0 | 26 | 0 |
| Quadrant | Total seconds | Saturated seconds | Saturation percentage |
|---|---|---|---|
| A | 6419 | 93 | 1.448824% |
| B | 6418 | 170 | 2.648800% |
| C | 6418 | 206 | 3.209723% |
| D | 6418 | 63 | 0.981614% |
Noise dominated data is calculated using 1-second bins in cleaned event files. If a bin has >2000 counts, and if more than 50% of those come from <1% of pixels, then it is considered to be noise-dominated and hence unusable.
| Quadrant | # 1 sec bins | Bins with >0 counts | Bins with >2000 counts | High rate bins dominated by noise | Noise dominated (total time) | Noise dominated (detector-on time) | Marked lightcurve |
|---|---|---|---|---|---|---|---|
| A | 7744 | 6420 | 0 | 0 | 0.00% | 0.00% | 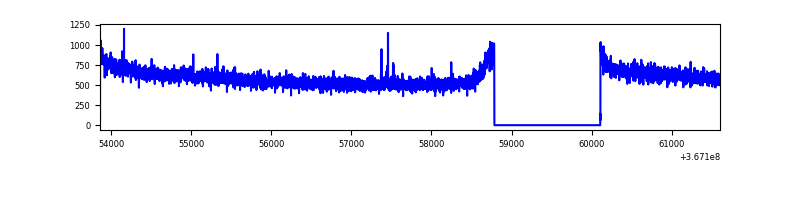 |
| B | 7743 | 6419 | 2 | 2 | 0.03% | 0.03% | 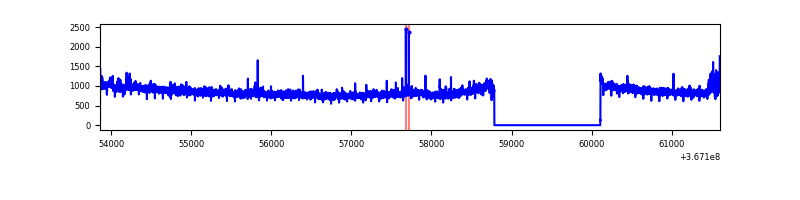 |
| C | 7743 | 6419 | 10 | 10 | 0.13% | 0.16% | 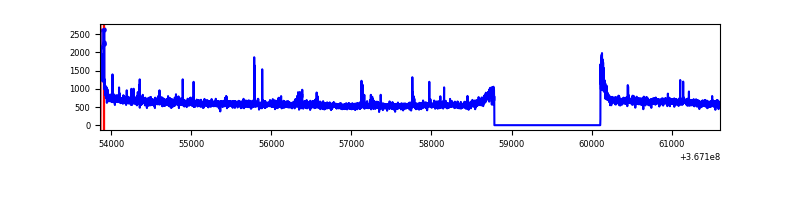 |
| D | 7743 | 6419 | 11 | 11 | 0.14% | 0.17% | 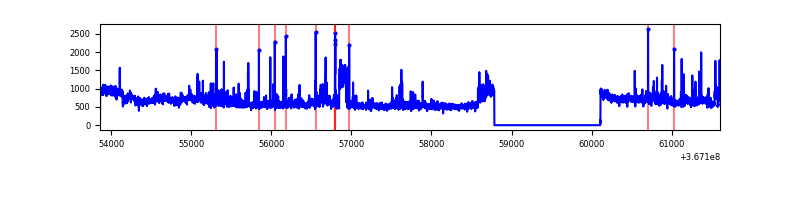 |
Top three noisy pixels from each quadrant. If the there are fewer than three noisy pixels in the level2.evt file, extra rows are filled as -1
| Pixel properties | Quadrant properties | ||||||
|---|---|---|---|---|---|---|---|
| Quadrant | DetID | PixID | Counts | Sigma | Mean | Median | Sigma |
| A | 13 | 254 | 9621 | 44.88 | 978 | 966 | 192.8 |
| A | 3 | 137 | 8735 | 40.29 | 978 | 966 | 192.8 |
| A | 0 | 226 | 8265 | 37.85 | 978 | 966 | 192.8 |
| B | 6 | 159 | 1660229 | 9501.6 | 943 | 925 | 174.6 |
| B | 10 | 245 | 49889 | 280.38 | 943 | 925 | 174.6 |
| B | 10 | 247 | 21327 | 116.83 | 943 | 925 | 174.6 |
| C | 14 | 238 | 155483 | 737.04 | 910 | 921 | 209.7 |
| C | 3 | 233 | 147619 | 699.54 | 910 | 921 | 209.7 |
| C | 0 | 10 | 86368 | 407.46 | 910 | 921 | 209.7 |
| D | 8 | 195 | 445925 | 2033.91 | 935 | 915 | 218.8 |
| D | 1 | 52 | 119531 | 542.13 | 935 | 915 | 218.8 |
| D | 5 | 243 | 113369 | 513.97 | 935 | 915 | 218.8 |
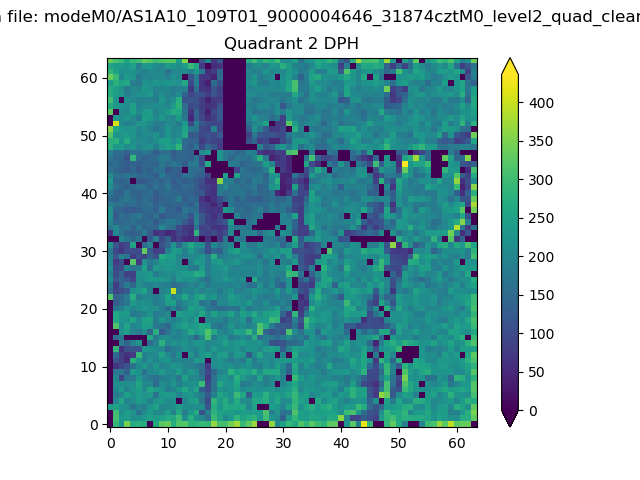
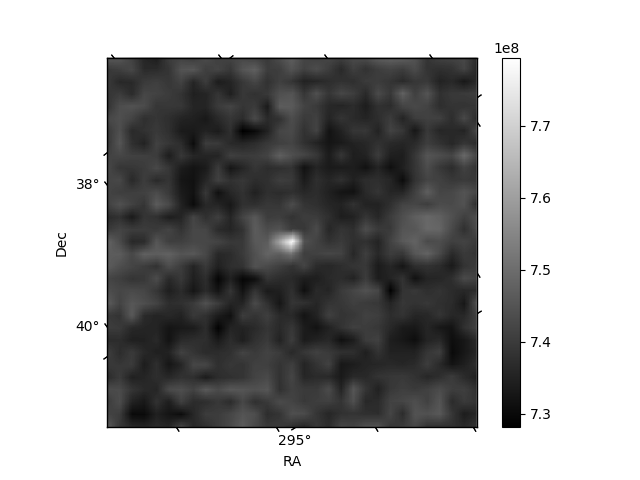
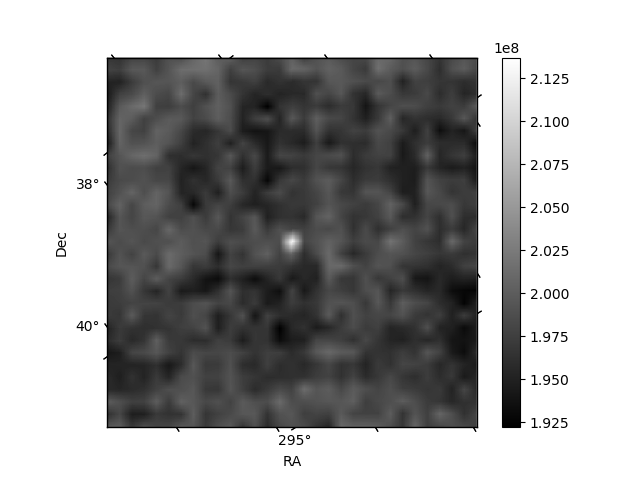
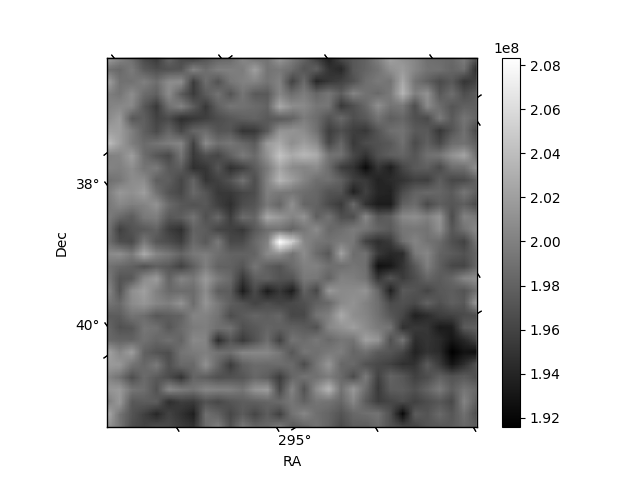
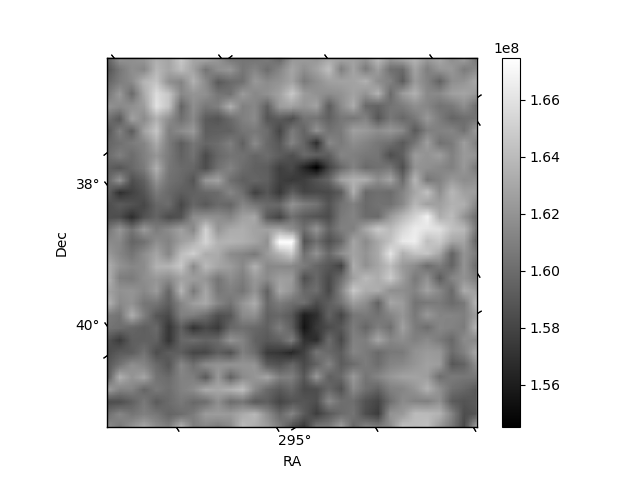
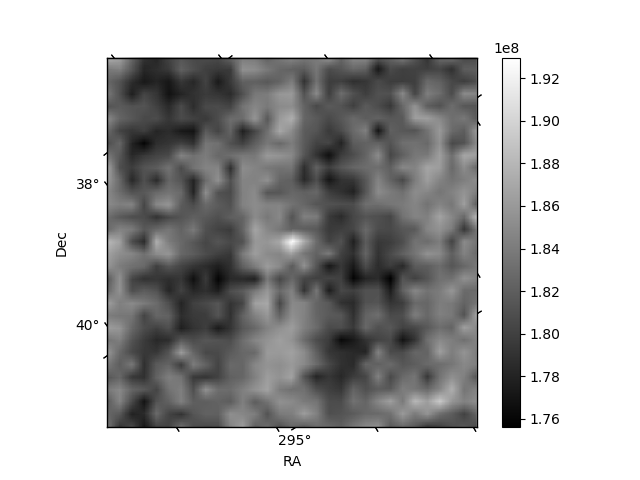
Histogram calculated using DETX and DETY for each event in the final _common_clean file
| Quadrant A | 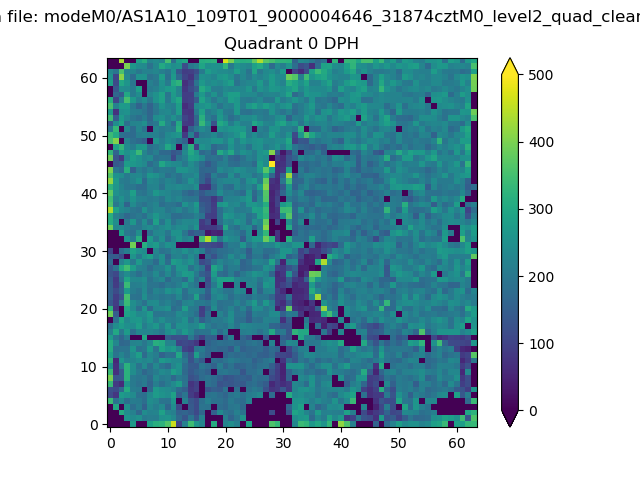 |
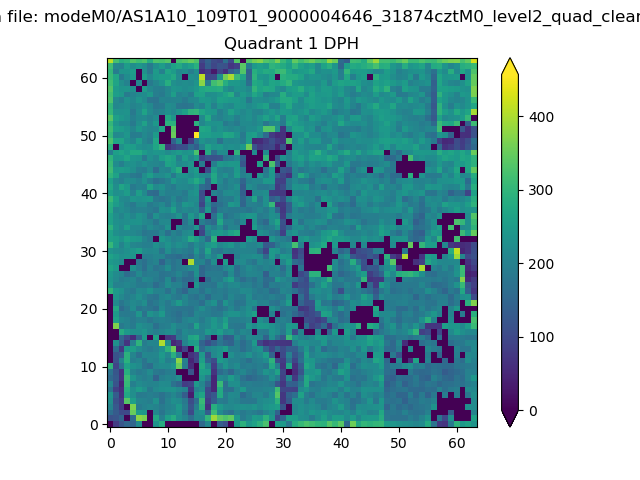 |
Quadrant B |
|---|---|---|---|
| Quadrant D | 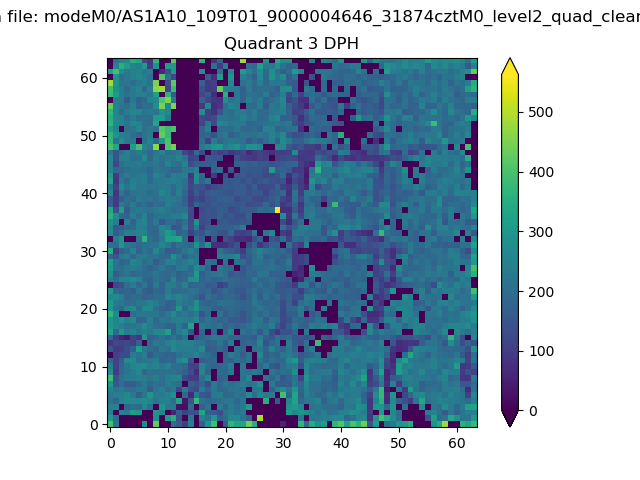 |
 |
Quadrant C |
| Plot type | Count rate plots | Images |
|---|---|---|
| Comparison with Poisson distribution Blue bars denote a histogram of data divided into 1 sec bins. Red curve is a Poisson curve with rate = median count rate of data. |
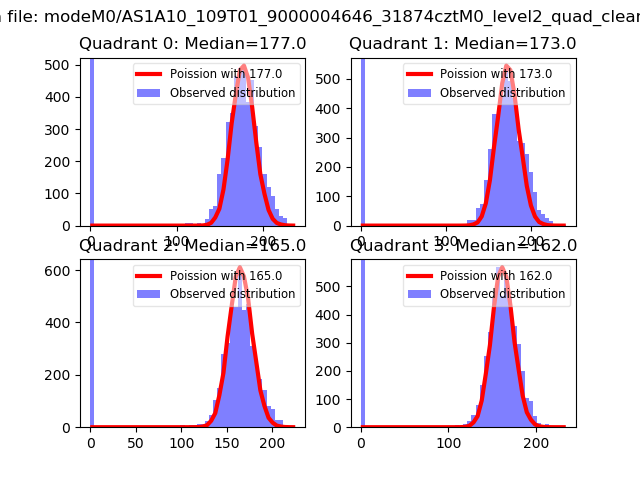 |
 |
| Quadrant-wise count rates Data is divided into 100 sec bins |
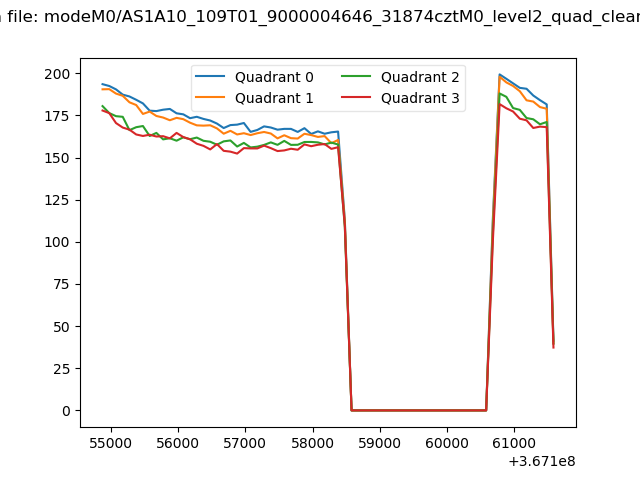 |
|
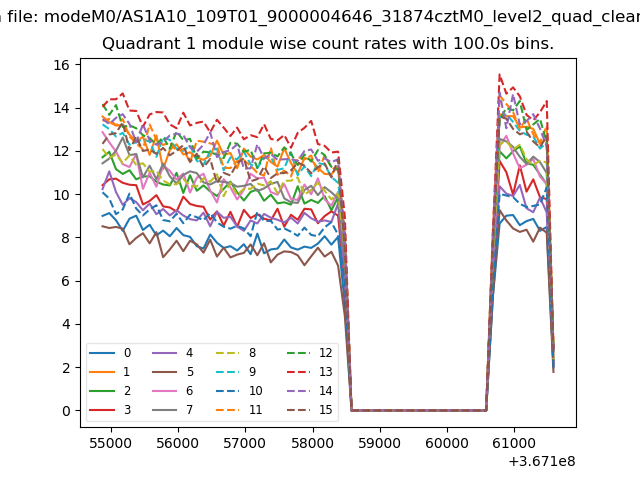
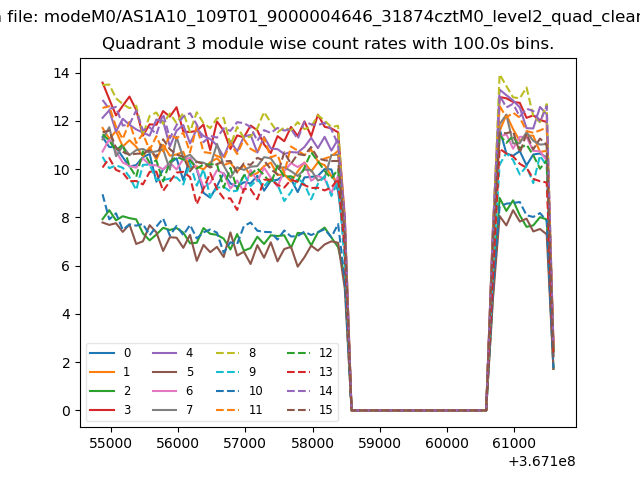
| Module-wise count rates for Quadrant A Data is divided into 100 sec bins |
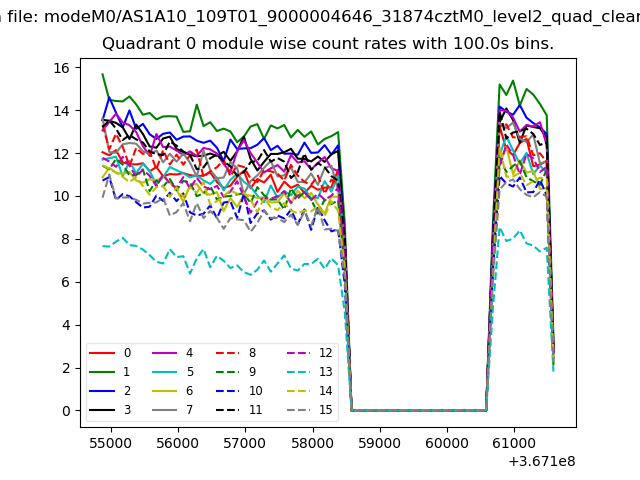 |
 |
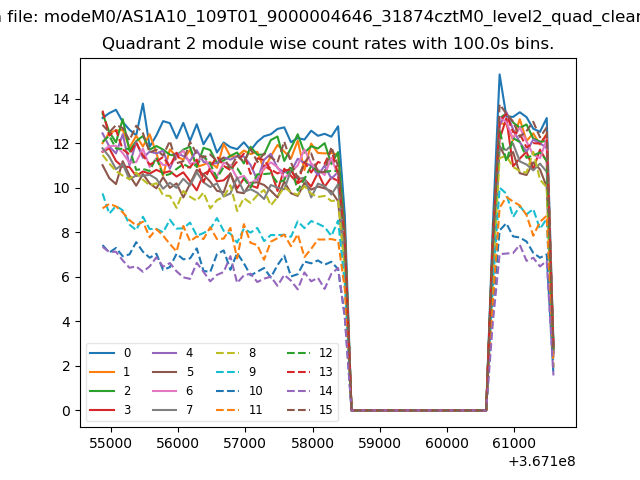
| Module-wise count rates for Quadrant B Data is divided into 100 sec bins |
 |
 |
| Module-wise count rates for Quadrant C Data is divided into 100 sec bins |
 |
 |
| Module-wise count rates for Quadrant D Data is divided into 100 sec bins |
 |
 |
| Parameter | Plot |
|---|---|
| CZT HV Monitor | 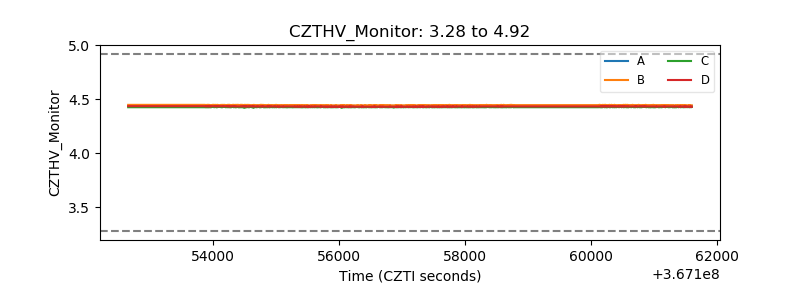 |
| D_VDD | 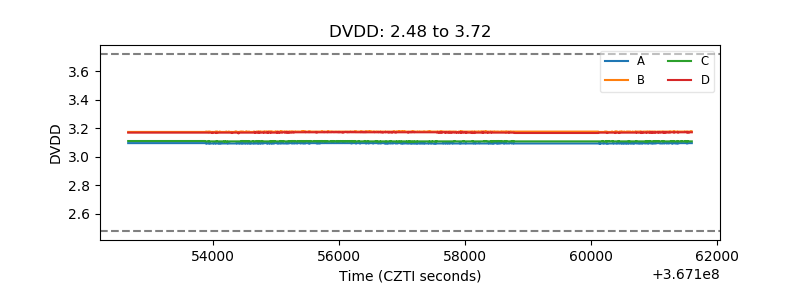 |
| Temperature 1 | 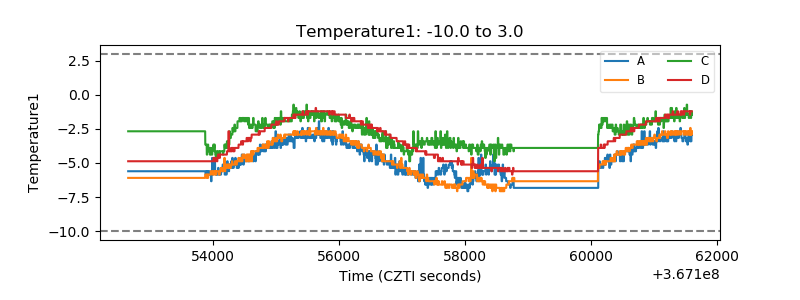 |
| Veto HV Monitor | 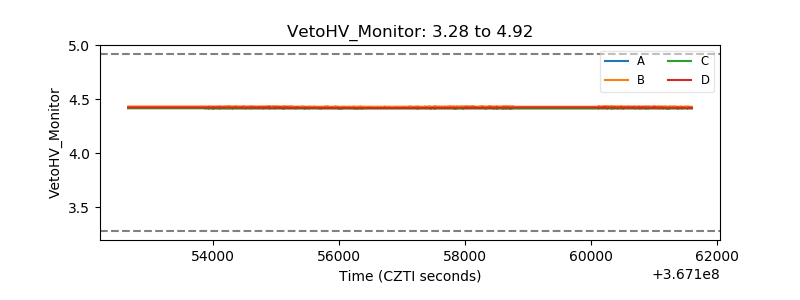 |
| Veto LLD | 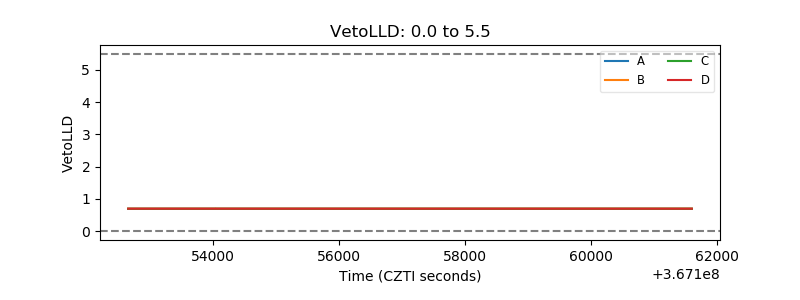 |
| Alpha Counter | 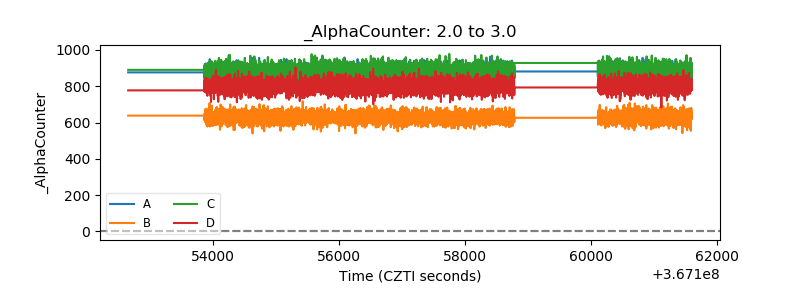 |
| _CPM_Rate | 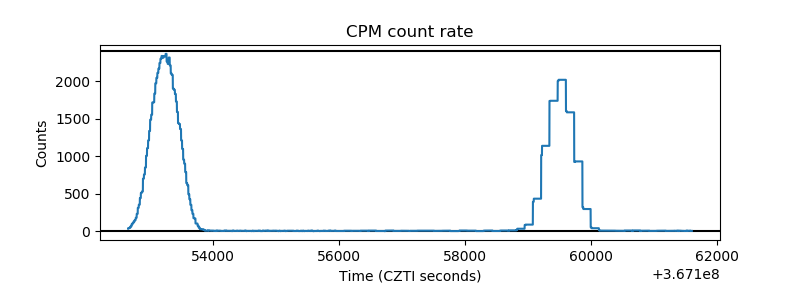 |
| CZT Counter |  |
| +2.5 Volts monitor |  |
| +5 Volts monitor |  |
| _ROLL_ROT | 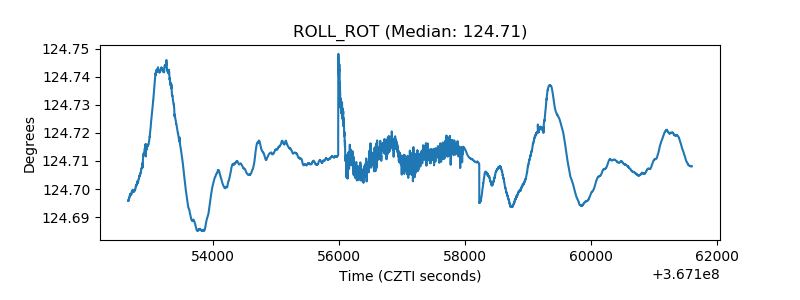 |
| _Roll_DEC | 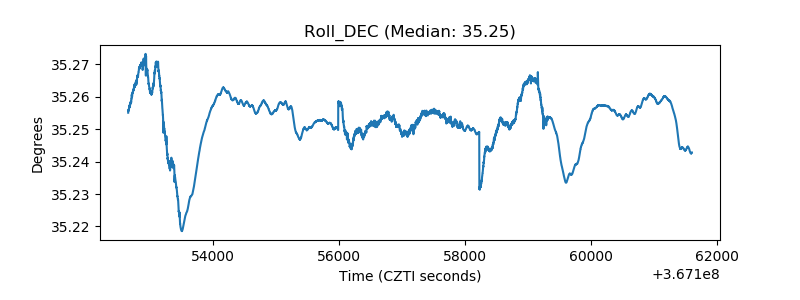 |
| _Roll_RA | 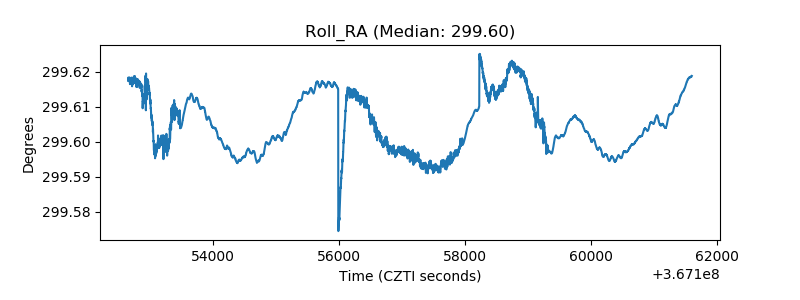 |
| Veto Counter | 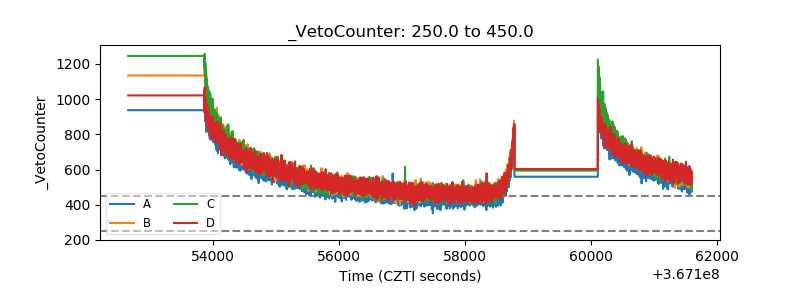 |