| Param | Original file | Final file |
|---|---|---|
| Filename | modeM0/AS1A10_109T01_9000004646_31877cztM0_level2.evt | modeM0/AS1A10_109T01_9000004646_31877cztM0_level2_quad_clean.evt |
| Size (bytes) | 531,227,520 | 102,813,120 |
| Size | 506.6 MB | 98.1 MB |
| Events in quadrant A | 3,226,157 | 690,973 |
| Events in quadrant B | 5,144,468 | 677,162 |
| Events in quadrant C | 3,482,975 | 656,423 |
| Events in quadrant D | 3,801,621 | 643,468 |
| Mode SS | |||
|---|---|---|---|
| Quadrant | BADHDUFLAG | Total packets | Discarded packets |
| A | 0 | 130 | 0 |
| B | 0 | 130 | 0 |
| C | 0 | 130 | 0 |
| D | 0 | 130 | 0 |
| Mode M0 | |||
|---|---|---|---|
| Quadrant | BADHDUFLAG | Total packets | Discarded packets |
| A | 0 | 13415 | 1 |
| B | 0 | 19610 | 1 |
| C | 0 | 14252 | 1 |
| D | 0 | 15356 | 1 |
| Mode M9 | |||
|---|---|---|---|
| Quadrant | BADHDUFLAG | Total packets | Discarded packets |
| A | 0 | 8 | 0 |
| B | 0 | 8 | 0 |
| C | 0 | 8 | 0 |
| D | 0 | 8 | 0 |
| Quadrant | Total seconds | Saturated seconds | Saturation percentage |
|---|---|---|---|
| A | 6386 | 59 | 0.923896% |
| B | 6387 | 141 | 2.207609% |
| C | 6387 | 146 | 2.285893% |
| D | 6387 | 127 | 1.988414% |
Noise dominated data is calculated using 1-second bins in cleaned event files. If a bin has >2000 counts, and if more than 50% of those come from <1% of pixels, then it is considered to be noise-dominated and hence unusable.
| Quadrant | # 1 sec bins | Bins with >0 counts | Bins with >2000 counts | High rate bins dominated by noise | Noise dominated (total time) | Noise dominated (detector-on time) | Marked lightcurve |
|---|---|---|---|---|---|---|---|
| A | 7207 | 6388 | 0 | 0 | 0.00% | 0.00% | 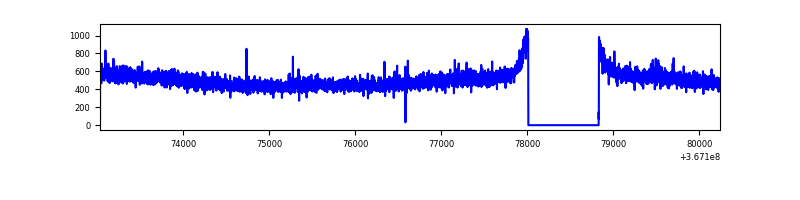 |
| B | 7208 | 6389 | 8 | 8 | 0.11% | 0.13% | 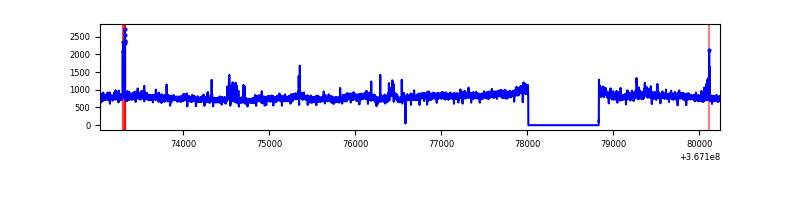 |
| C | 7208 | 6389 | 7 | 7 | 0.10% | 0.11% | 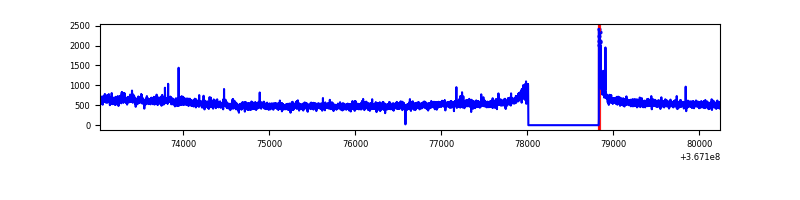 |
| D | 7208 | 6389 | 67 | 67 | 0.93% | 1.05% | 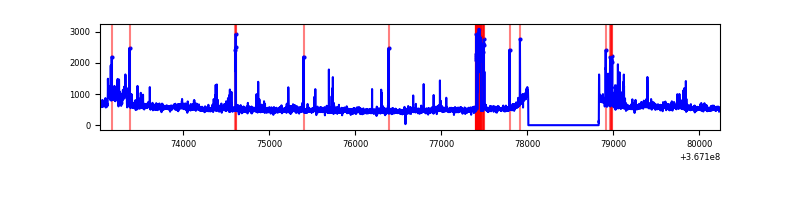 |
Top three noisy pixels from each quadrant. If the there are fewer than three noisy pixels in the level2.evt file, extra rows are filled as -1
| Pixel properties | Quadrant properties | ||||||
|---|---|---|---|---|---|---|---|
| Quadrant | DetID | PixID | Counts | Sigma | Mean | Median | Sigma |
| A | 13 | 254 | 10932 | 60.63 | 834 | 819 | 166.8 |
| A | 3 | 137 | 8400 | 45.45 | 834 | 819 | 166.8 |
| A | 0 | 226 | 6932 | 36.65 | 834 | 819 | 166.8 |
| B | 6 | 159 | 1712028 | 11127.05 | 814 | 795 | 153.8 |
| B | 0 | 183 | 123930 | 800.67 | 814 | 795 | 153.8 |
| B | 10 | 245 | 34991 | 222.35 | 814 | 795 | 153.8 |
| C | 3 | 233 | 179445 | 953.93 | 798 | 806 | 187.3 |
| C | 14 | 238 | 132207 | 701.68 | 798 | 806 | 187.3 |
| C | 0 | 10 | 31391 | 163.32 | 798 | 806 | 187.3 |
| D | 8 | 195 | 418760 | 2168.15 | 805 | 786 | 192.8 |
| D | 2 | 250 | 181964 | 939.82 | 805 | 786 | 192.8 |
| D | 12 | 233 | 112396 | 578.95 | 805 | 786 | 192.8 |
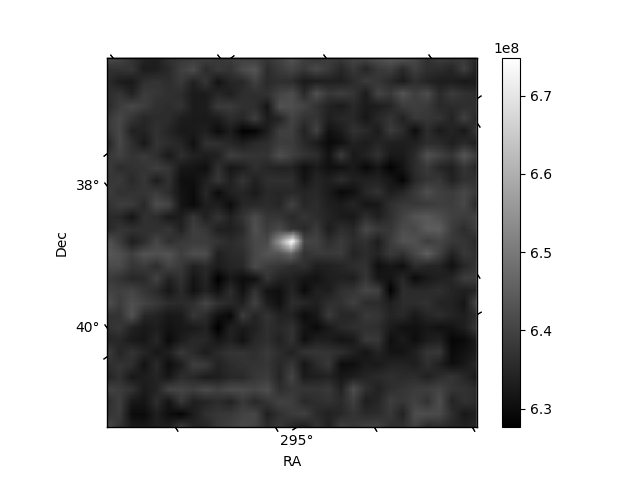
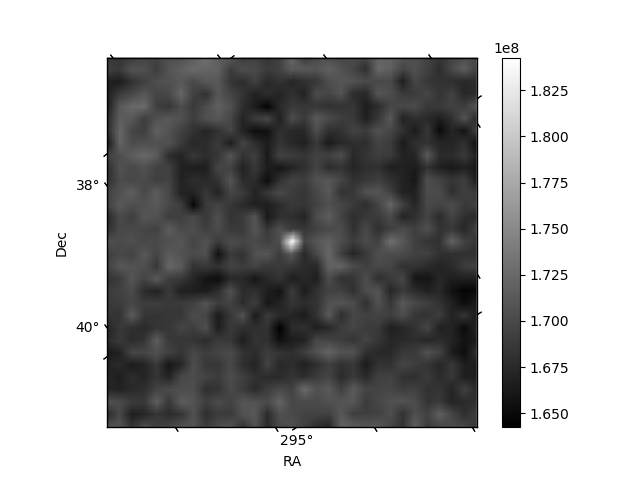
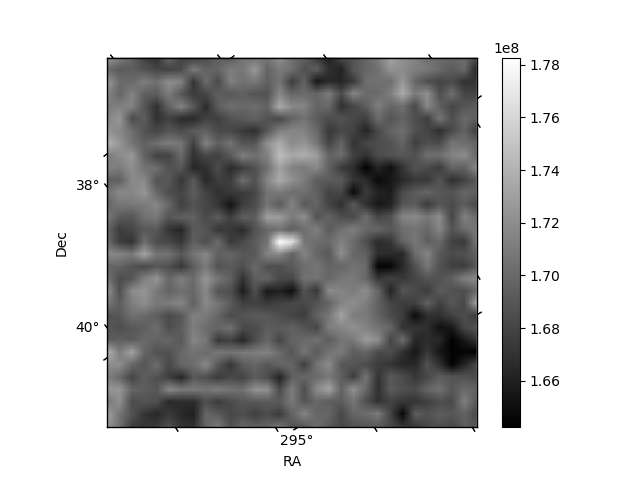
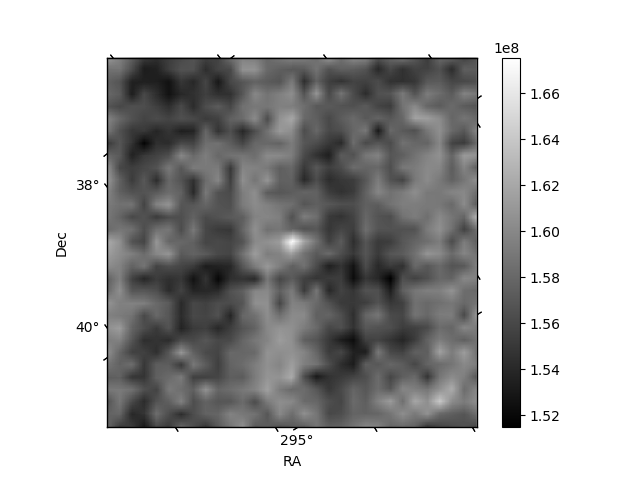
Histogram calculated using DETX and DETY for each event in the final _common_clean file
| Quadrant A | 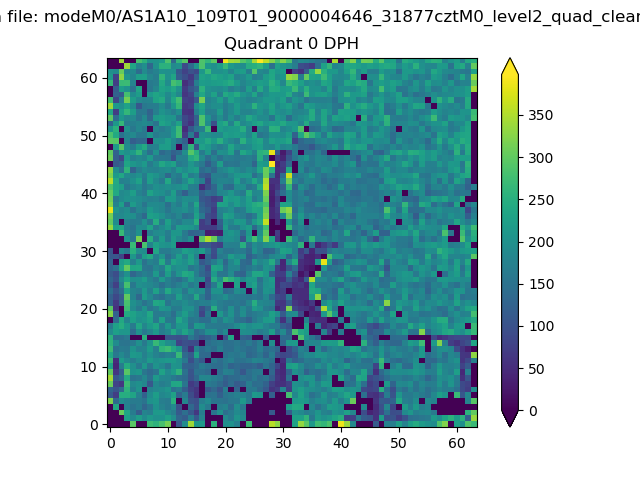 |
 |
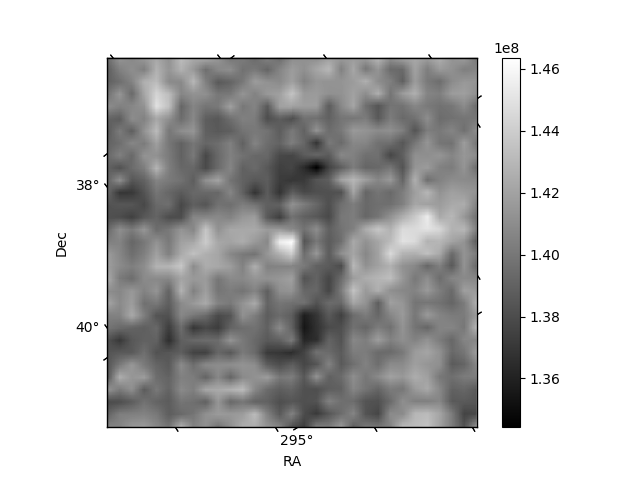
Quadrant B |
|---|---|---|---|
| Quadrant D | 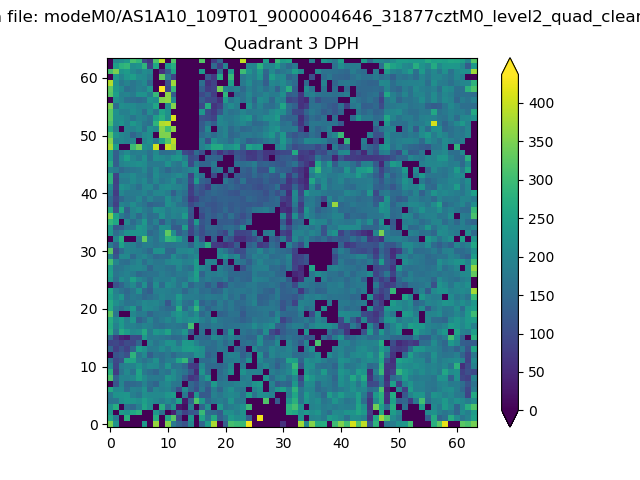 |
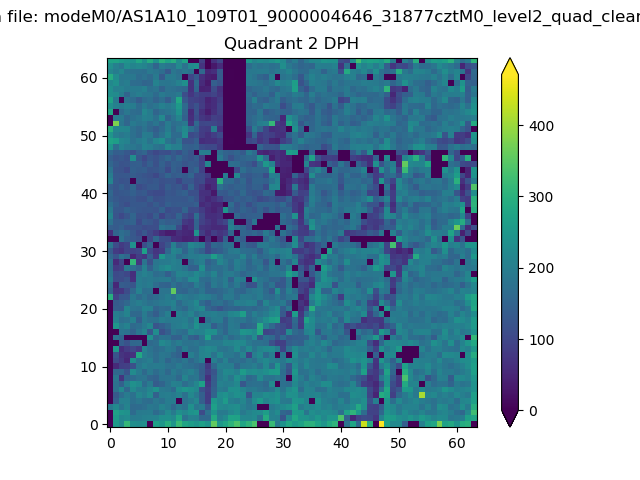 |
Quadrant C |
| Plot type | Count rate plots | Images |
|---|---|---|
| Comparison with Poisson distribution Blue bars denote a histogram of data divided into 1 sec bins. Red curve is a Poisson curve with rate = median count rate of data. |
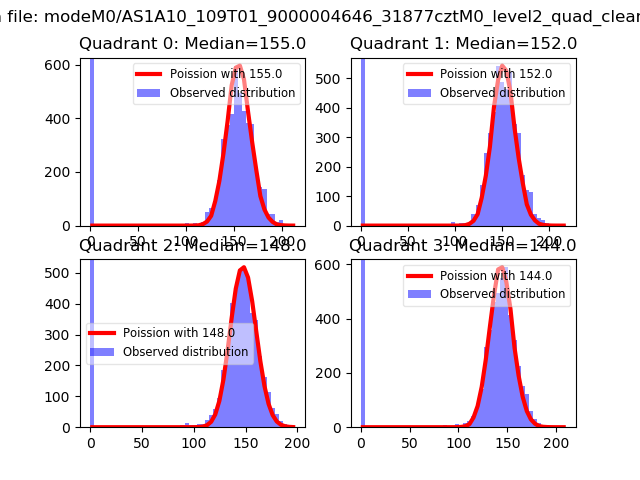 |
 |
| Quadrant-wise count rates Data is divided into 100 sec bins |
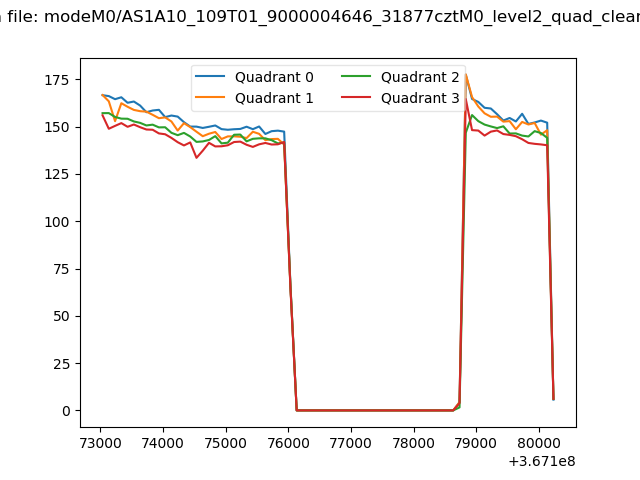 |
|
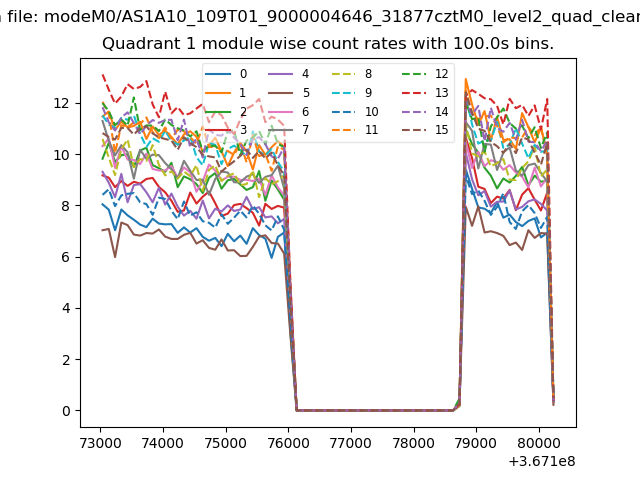
| Module-wise count rates for Quadrant A Data is divided into 100 sec bins |
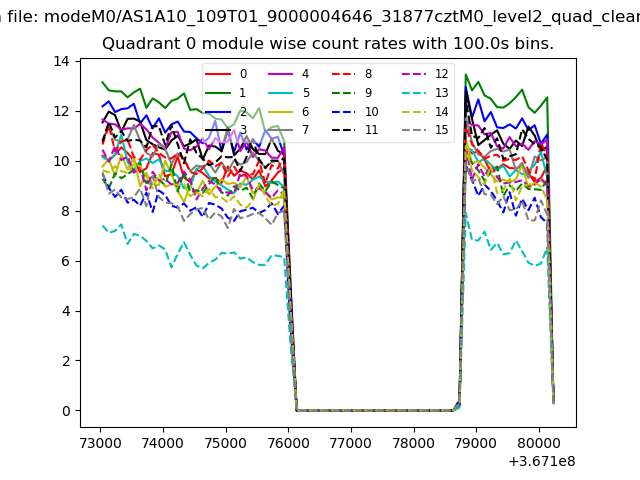 |
 |
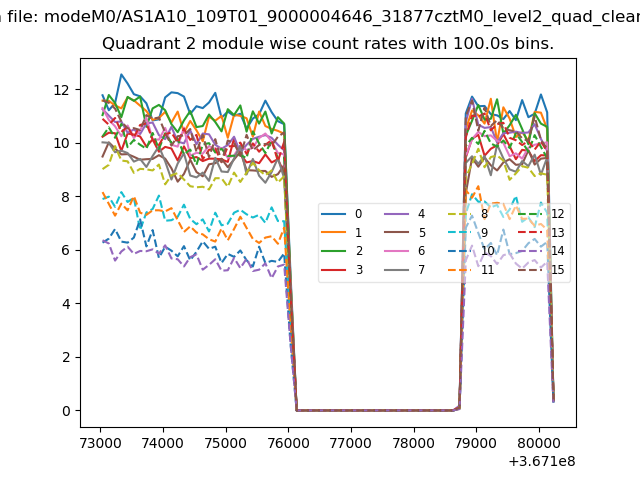
| Module-wise count rates for Quadrant B Data is divided into 100 sec bins |
 |
 |
| Module-wise count rates for Quadrant C Data is divided into 100 sec bins |
 |
 |
| Module-wise count rates for Quadrant D Data is divided into 100 sec bins |
 |
 |
| Parameter | Plot |
|---|---|
| CZT HV Monitor | 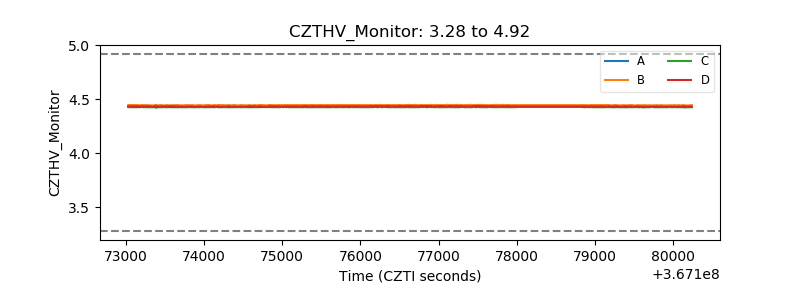 |
| D_VDD | 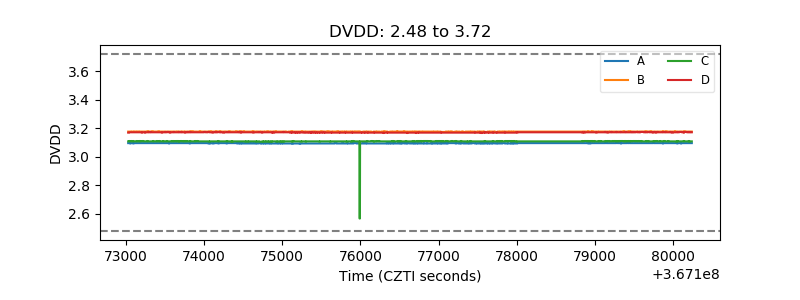 |
| Temperature 1 | 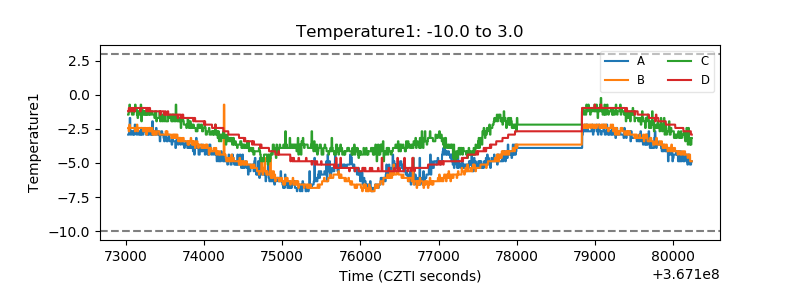 |
| Veto HV Monitor | 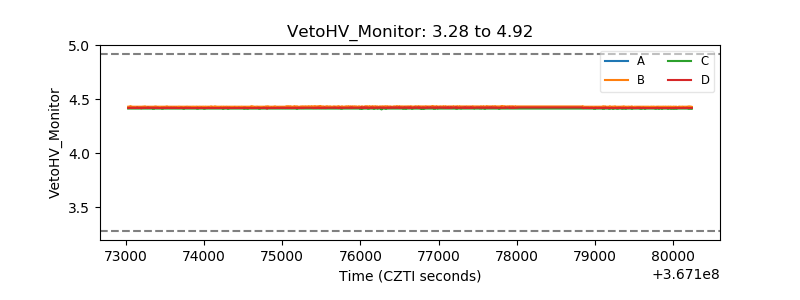 |
| Veto LLD | 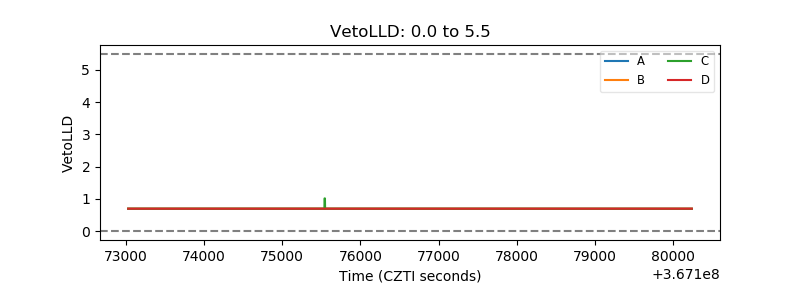 |
| Alpha Counter | 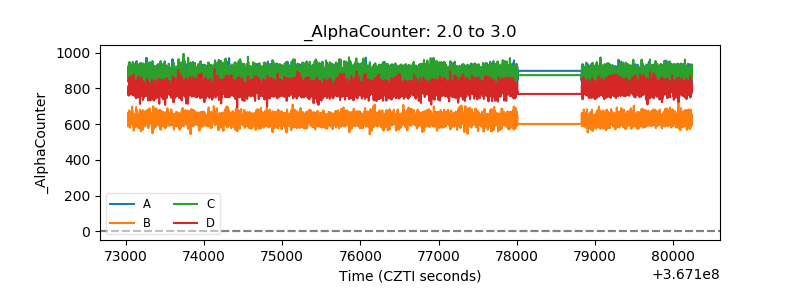 |
| _CPM_Rate | 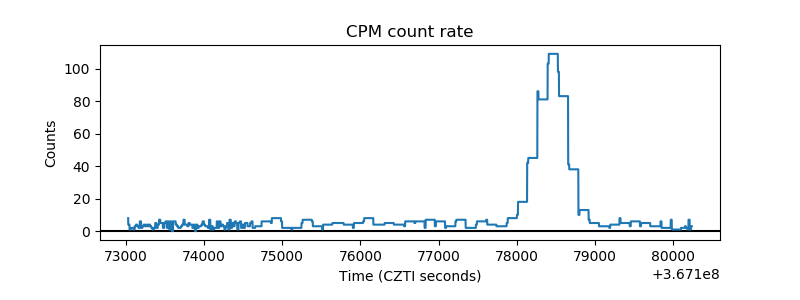 |
| CZT Counter |  |
| +2.5 Volts monitor |  |
| +5 Volts monitor |  |
| _ROLL_ROT |  |
| _Roll_DEC | 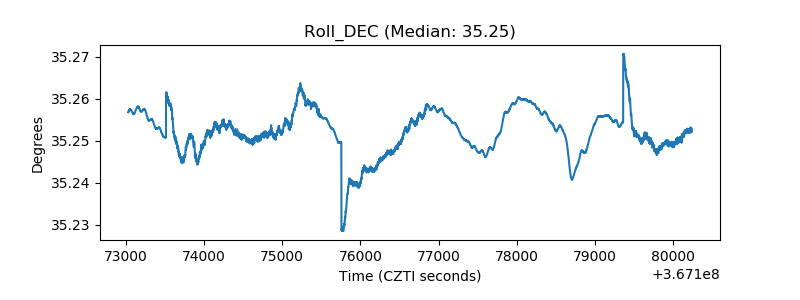 |
| _Roll_RA |  |
| Veto Counter | 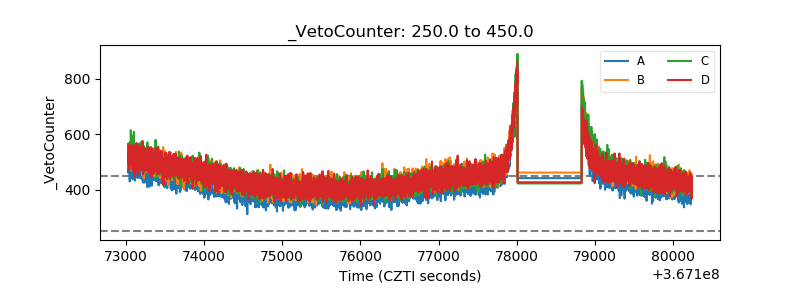 |