| Param | Original file | Final file |
|---|---|---|
| Filename | modeM0/AS1A10_109T01_9000004646_31882cztM0_level2.evt | modeM0/AS1A10_109T01_9000004646_31882cztM0_level2_quad_clean.evt |
| Size (bytes) | 459,063,360 | 79,053,120 |
| Size | 437.8 MB | 75.4 MB |
| Events in quadrant A | 2,726,487 | 517,425 |
| Events in quadrant B | 4,314,978 | 511,420 |
| Events in quadrant C | 3,007,435 | 490,731 |
| Events in quadrant D | 3,468,234 | 477,004 |
| Mode SS | |||
|---|---|---|---|
| Quadrant | BADHDUFLAG | Total packets | Discarded packets |
| A | 0 | 114 | 0 |
| B | 0 | 114 | 0 |
| C | 0 | 114 | 0 |
| D | 0 | 114 | 0 |
| Mode M0 | |||
|---|---|---|---|
| Quadrant | BADHDUFLAG | Total packets | Discarded packets |
| A | 0 | 11697 | 1 |
| B | 0 | 17087 | 1 |
| C | 0 | 12563 | 1 |
| D | 0 | 14162 | 1 |
| Quadrant | Total seconds | Saturated seconds | Saturation percentage |
|---|---|---|---|
| A | 5678 | 16 | 0.281789% |
| B | 5679 | 57 | 1.003698% |
| C | 5679 | 132 | 2.324353% |
| D | 5679 | 180 | 3.169572% |
Noise dominated data is calculated using 1-second bins in cleaned event files. If a bin has >2000 counts, and if more than 50% of those come from <1% of pixels, then it is considered to be noise-dominated and hence unusable.
| Quadrant | # 1 sec bins | Bins with >0 counts | Bins with >2000 counts | High rate bins dominated by noise | Noise dominated (total time) | Noise dominated (detector-on time) | Marked lightcurve |
|---|---|---|---|---|---|---|---|
| A | 5678 | 5678 | 0 | 0 | 0.00% | 0.00% | 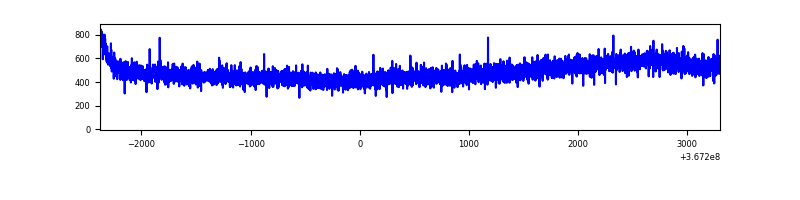 |
| B | 5679 | 5679 | 0 | 0 | 0.00% | 0.00% | 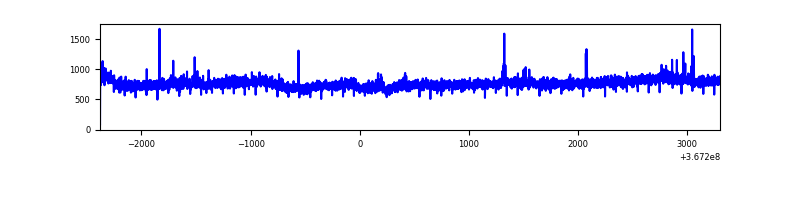 |
| C | 5679 | 5679 | 50 | 50 | 0.88% | 0.88% | 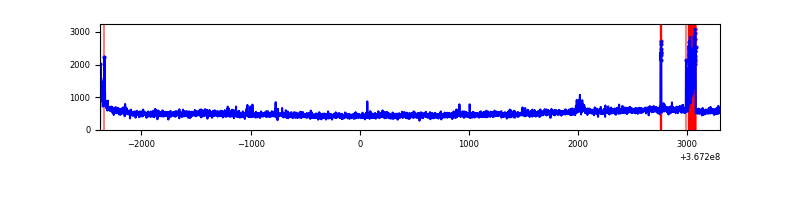 |
| D | 5679 | 5679 | 183 | 183 | 3.22% | 3.22% | 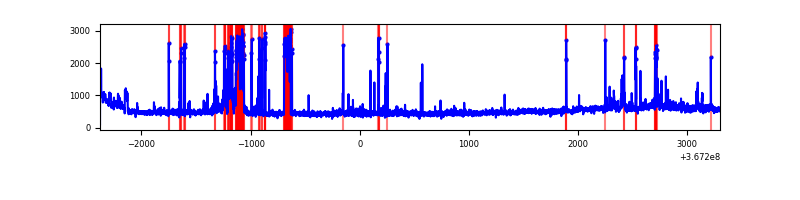 |
Top three noisy pixels from each quadrant. If the there are fewer than three noisy pixels in the level2.evt file, extra rows are filled as -1
| Pixel properties | Quadrant properties | ||||||
|---|---|---|---|---|---|---|---|
| Quadrant | DetID | PixID | Counts | Sigma | Mean | Median | Sigma |
| A | 13 | 254 | 11462 | 75.85 | 703 | 693 | 142.0 |
| A | 13 | 6 | 9078 | 59.06 | 703 | 693 | 142.0 |
| A | 3 | 137 | 7261 | 46.26 | 703 | 693 | 142.0 |
| B | 6 | 159 | 1555080 | 11564.29 | 692 | 676 | 134.4 |
| B | 12 | 111 | 16779 | 119.8 | 692 | 676 | 134.4 |
| B | 11 | 111 | 15307 | 108.85 | 692 | 676 | 134.4 |
| C | 15 | 208 | 139910 | 870.32 | 672 | 678 | 160.0 |
| C | 14 | 238 | 112089 | 696.41 | 672 | 678 | 160.0 |
| C | 3 | 233 | 83801 | 519.59 | 672 | 678 | 160.0 |
| D | 12 | 218 | 480561 | 2986.4 | 674 | 659 | 160.7 |
| D | 8 | 195 | 297947 | 1850.01 | 674 | 659 | 160.7 |
| D | 2 | 250 | 65054 | 400.73 | 674 | 659 | 160.7 |
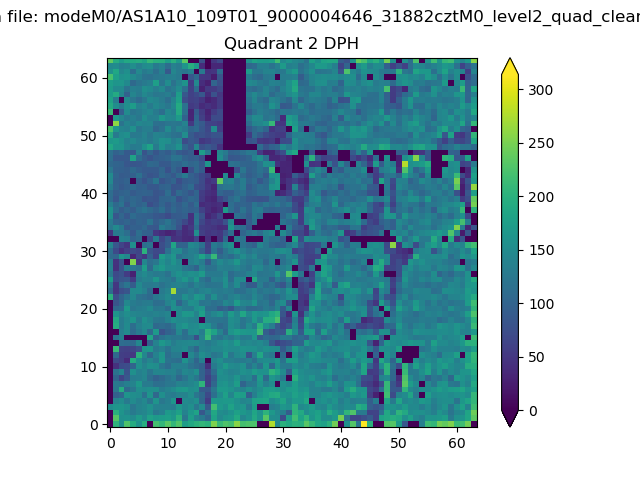
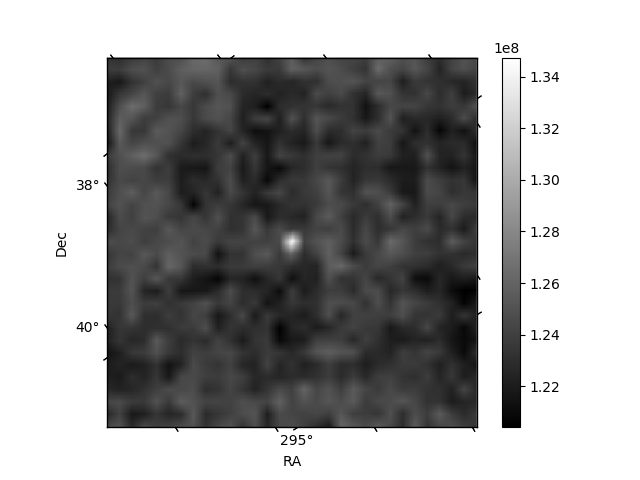
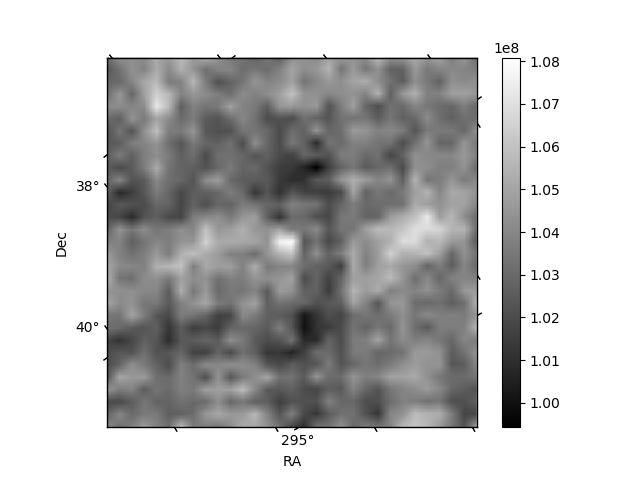
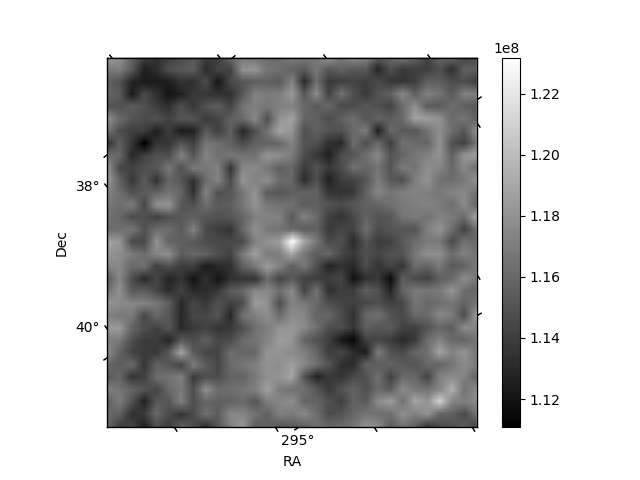
Histogram calculated using DETX and DETY for each event in the final _common_clean file
| Quadrant A | 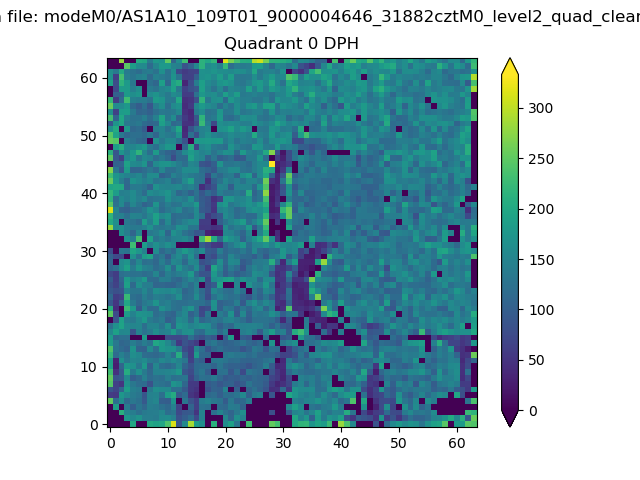 |
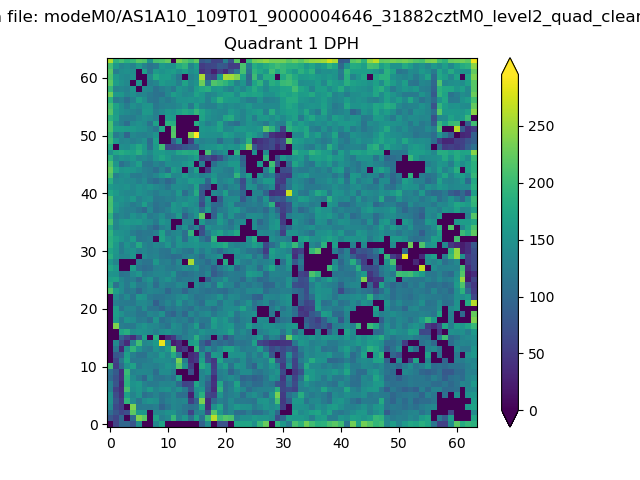 |
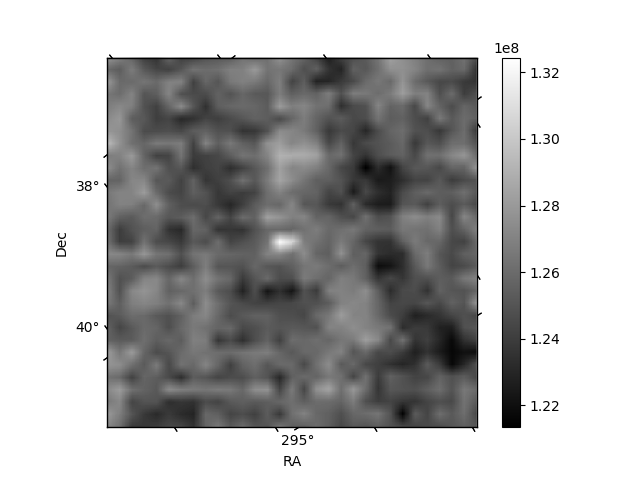
Quadrant B |
|---|---|---|---|
| Quadrant D | 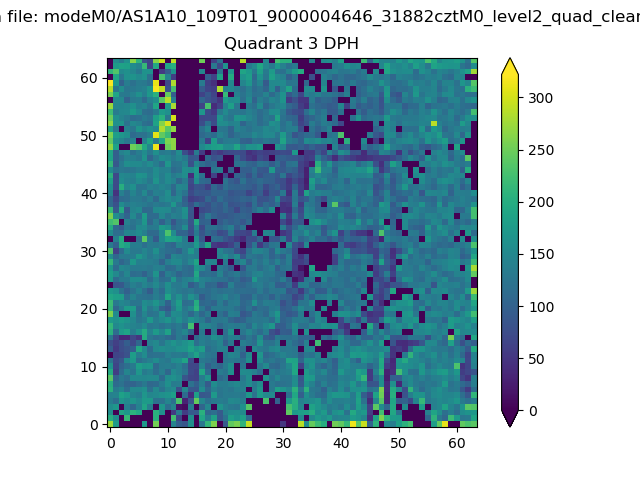 |
 |
Quadrant C |
| Plot type | Count rate plots | Images |
|---|---|---|
| Comparison with Poisson distribution Blue bars denote a histogram of data divided into 1 sec bins. Red curve is a Poisson curve with rate = median count rate of data. |
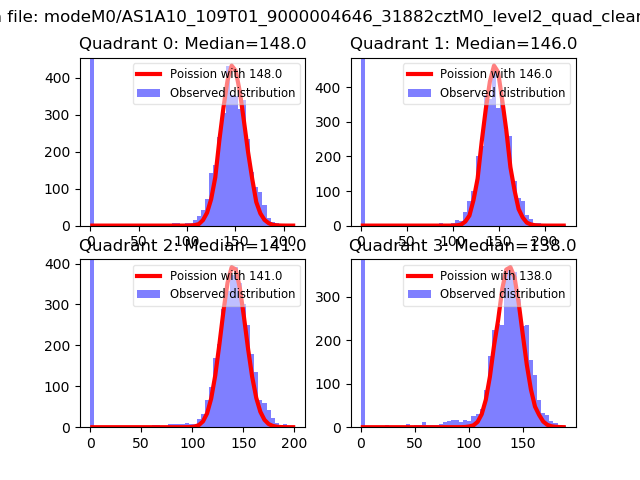 |
 |
| Quadrant-wise count rates Data is divided into 100 sec bins |
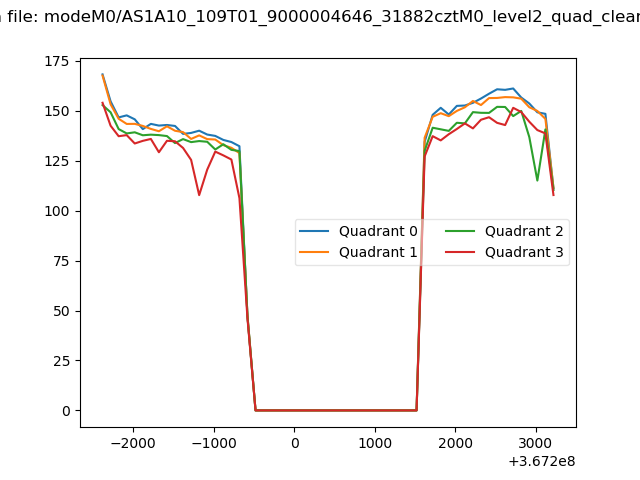 |
|
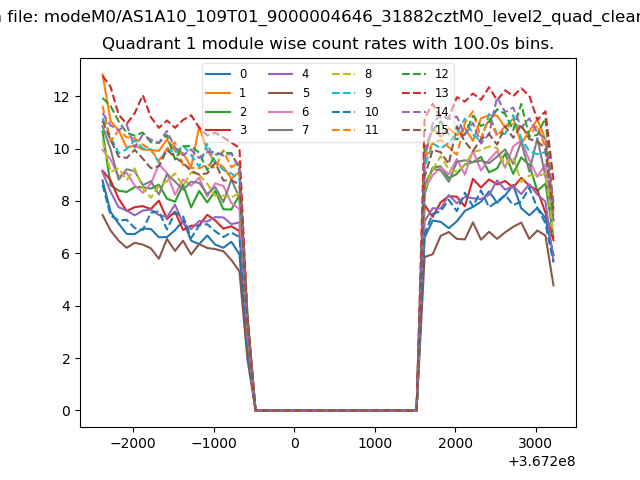
| Module-wise count rates for Quadrant A Data is divided into 100 sec bins |
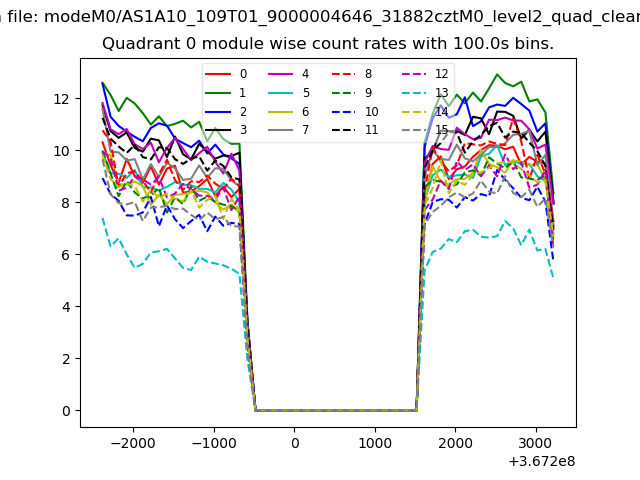 |
 |
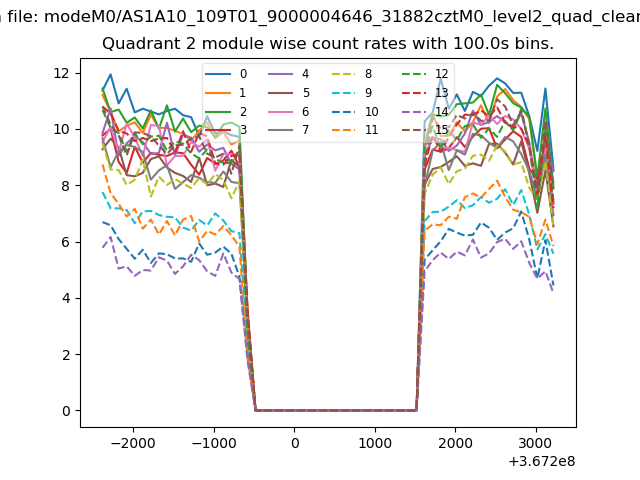
| Module-wise count rates for Quadrant B Data is divided into 100 sec bins |
 |
 |
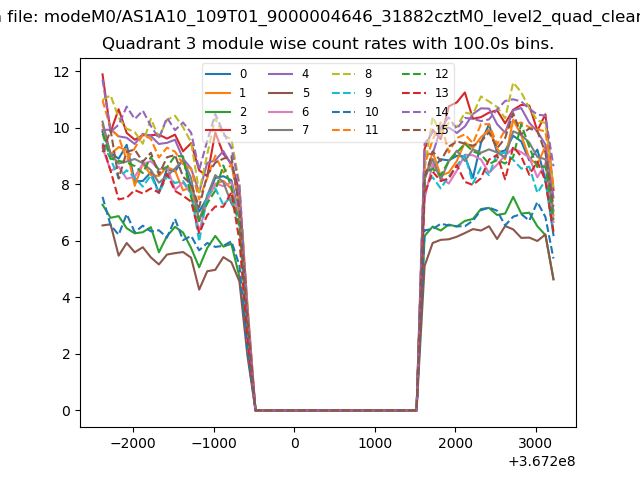
| Module-wise count rates for Quadrant C Data is divided into 100 sec bins |
 |
 |
| Module-wise count rates for Quadrant D Data is divided into 100 sec bins |
 |
 |
| Parameter | Plot |
|---|---|
| CZT HV Monitor | 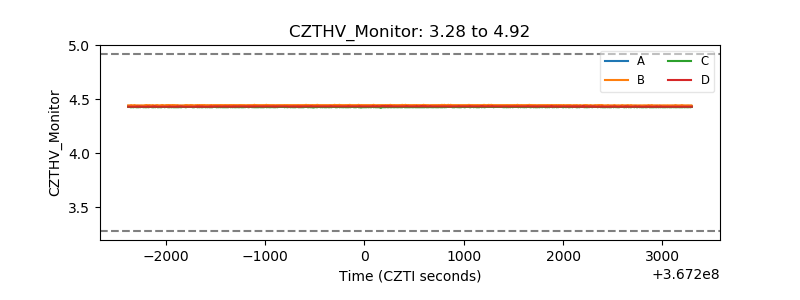 |
| D_VDD | 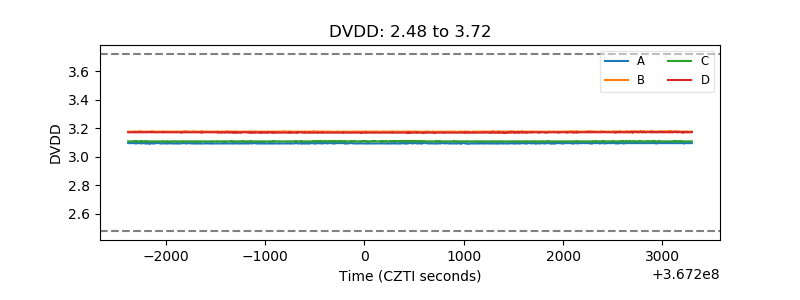 |
| Temperature 1 | 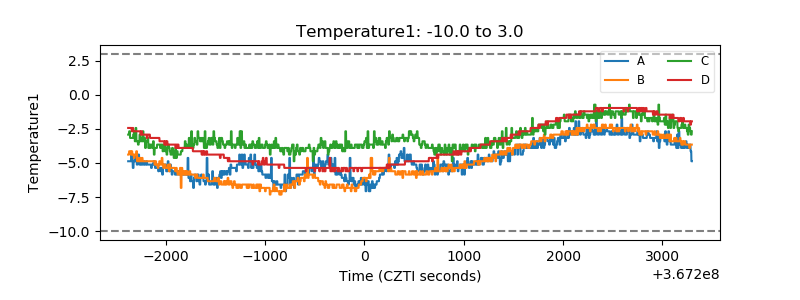 |
| Veto HV Monitor | 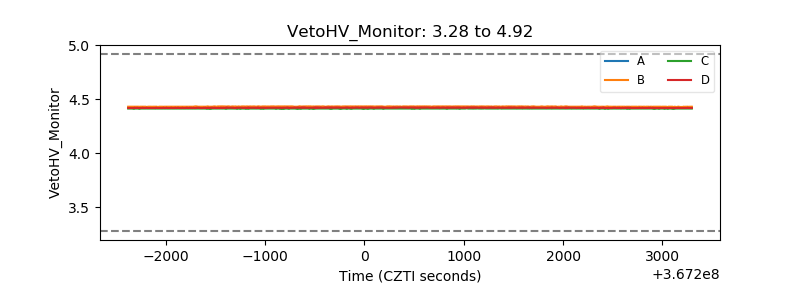 |
| Veto LLD | 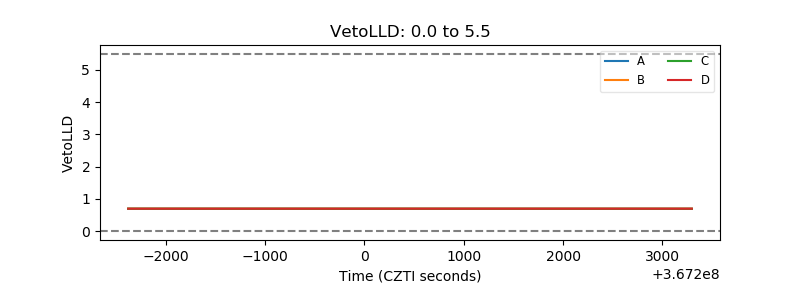 |
| Alpha Counter | 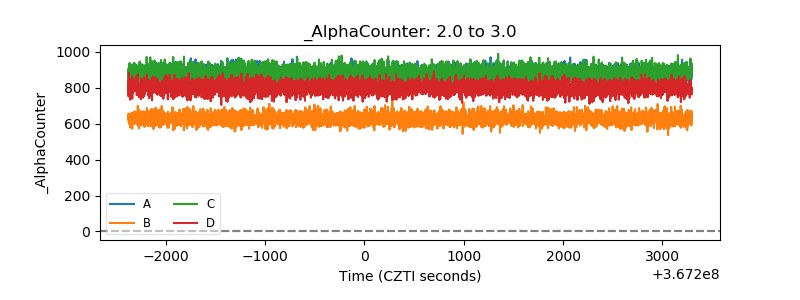 |
| _CPM_Rate | 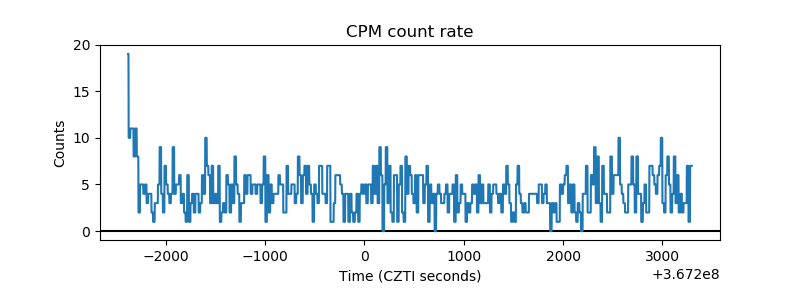 |
| CZT Counter | 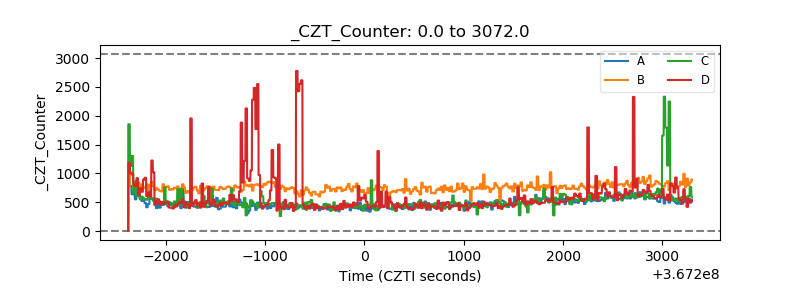 |
| +2.5 Volts monitor |  |
| +5 Volts monitor |  |
| _ROLL_ROT | 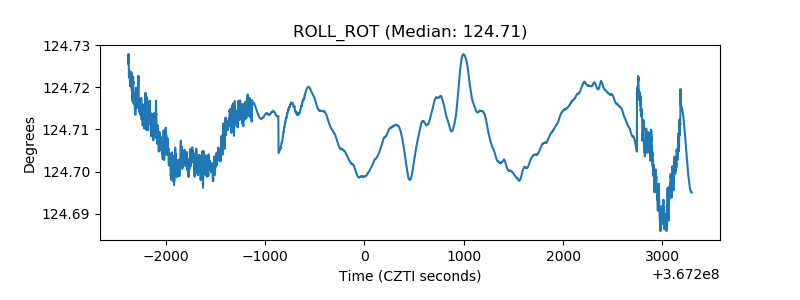 |
| _Roll_DEC | 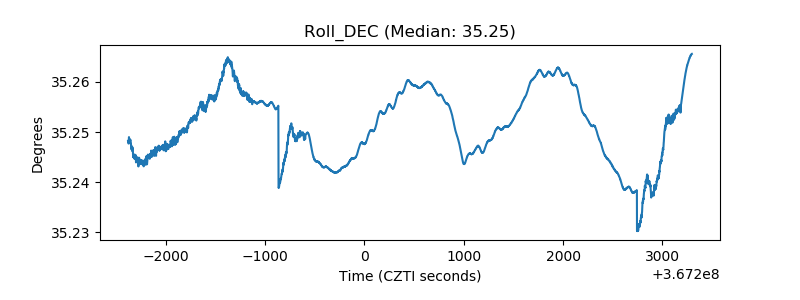 |
| _Roll_RA | 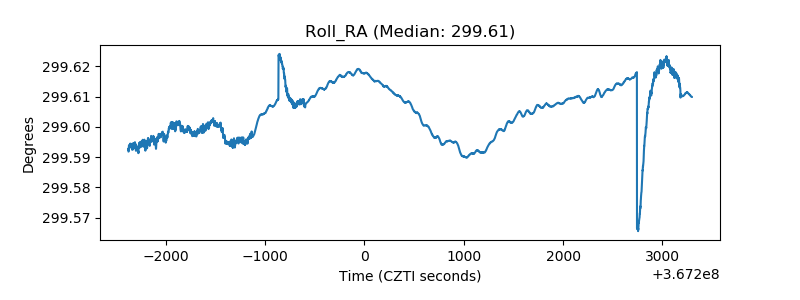 |
| Veto Counter | 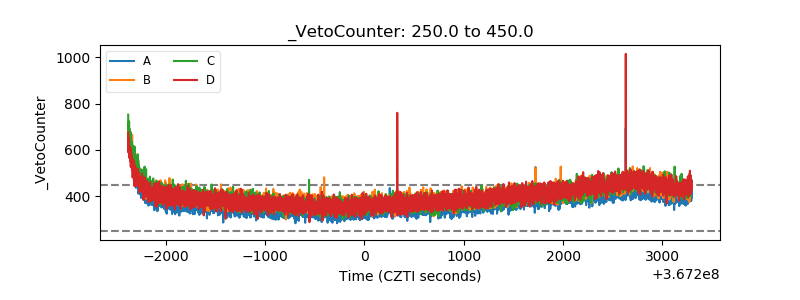 |