| Param | Original file | Final file |
|---|---|---|
| Filename | modeM0/AS1T04_042T01_9000004650_31887cztM0_level2.evt | modeM0/AS1T04_042T01_9000004650_31887cztM0_level2_quad_clean.evt |
| Size (bytes) | 437,204,160 | 94,291,200 |
| Size | 417.0 MB | 89.9 MB |
| Events in quadrant A | 2,516,278 | 651,145 |
| Events in quadrant B | 3,809,183 | 640,943 |
| Events in quadrant C | 2,714,876 | 623,447 |
| Events in quadrant D | 3,879,632 | 607,929 |
| Mode M0 | |||
|---|---|---|---|
| Quadrant | BADHDUFLAG | Total packets | Discarded packets |
| A | 0 | 10813 | 233 |
| B | 0 | 15123 | 351 |
| C | 0 | 11393 | 238 |
| D | 0 | 15231 | 381 |
| Mode SS | |||
|---|---|---|---|
| Quadrant | BADHDUFLAG | Total packets | Discarded packets |
| A | 0 | 96 | 0 |
| B | 0 | 96 | 0 |
| C | 0 | 96 | 0 |
| D | 0 | 99 | 3 |
| Mode M9 | |||
|---|---|---|---|
| Quadrant | BADHDUFLAG | Total packets | Discarded packets |
| A | 0 | 12 | 0 |
| B | 0 | 12 | 0 |
| C | 0 | 12 | 0 |
| D | 0 | 12 | 0 |
| Quadrant | Total seconds | Saturated seconds | Saturation percentage |
|---|---|---|---|
| A | 4732 | 93 | 1.965342% |
| B | 4732 | 150 | 3.169907% |
| C | 4733 | 211 | 4.458060% |
| D | 4733 | 119 | 2.514262% |
Noise dominated data is calculated using 1-second bins in cleaned event files. If a bin has >2000 counts, and if more than 50% of those come from <1% of pixels, then it is considered to be noise-dominated and hence unusable.
| Quadrant | # 1 sec bins | Bins with >0 counts | Bins with >2000 counts | High rate bins dominated by noise | Noise dominated (total time) | Noise dominated (detector-on time) | Marked lightcurve |
|---|---|---|---|---|---|---|---|
| A | 6142 | 4741 | 0 | 0 | 0.00% | 0.00% | 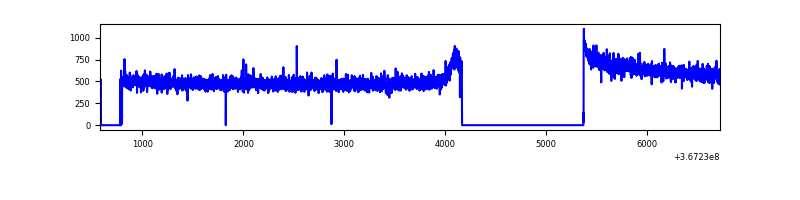 |
| B | 6133 | 4738 | 3 | 3 | 0.05% | 0.06% | 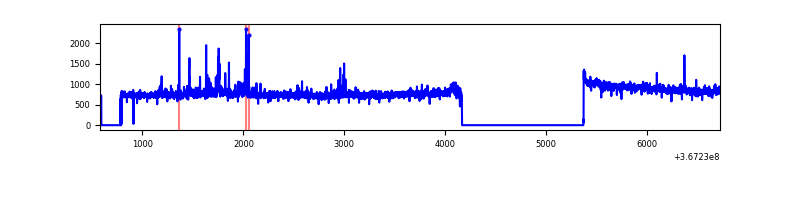 |
| C | 6140 | 4740 | 52 | 52 | 0.85% | 1.10% | 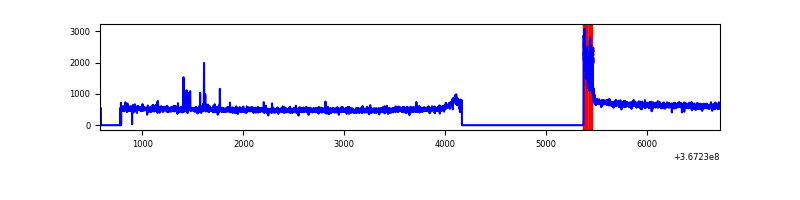 |
| D | 6144 | 4739 | 42 | 42 | 0.68% | 0.89% | 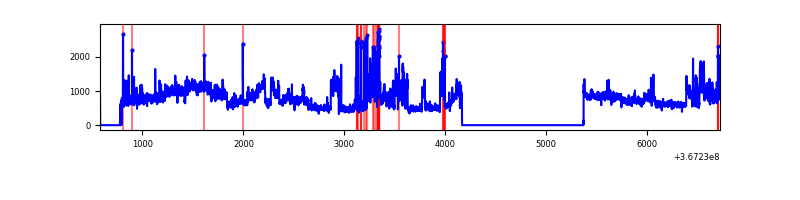 |
Top three noisy pixels from each quadrant. If the there are fewer than three noisy pixels in the level2.evt file, extra rows are filled as -1
| Pixel properties | Quadrant properties | ||||||
|---|---|---|---|---|---|---|---|
| Quadrant | DetID | PixID | Counts | Sigma | Mean | Median | Sigma |
| A | 13 | 254 | 7511 | 53.09 | 651 | 641 | 129.4 |
| A | 3 | 137 | 6176 | 42.78 | 651 | 641 | 129.4 |
| A | 13 | 6 | 5829 | 40.09 | 651 | 641 | 129.4 |
| B | 6 | 159 | 1214154 | 10169.05 | 632 | 619 | 119.3 |
| B | 0 | 229 | 65076 | 540.13 | 632 | 619 | 119.3 |
| B | 0 | 183 | 18645 | 151.05 | 632 | 619 | 119.3 |
| C | 0 | 10 | 144572 | 1023.92 | 606 | 611 | 140.6 |
| C | 14 | 238 | 99316 | 702.04 | 606 | 611 | 140.6 |
| C | 3 | 233 | 67895 | 478.56 | 606 | 611 | 140.6 |
| D | 8 | 195 | 941441 | 6402.03 | 624 | 606 | 147.0 |
| D | 12 | 79 | 423720 | 2879.13 | 624 | 606 | 147.0 |
| D | 13 | 249 | 107980 | 730.64 | 624 | 606 | 147.0 |
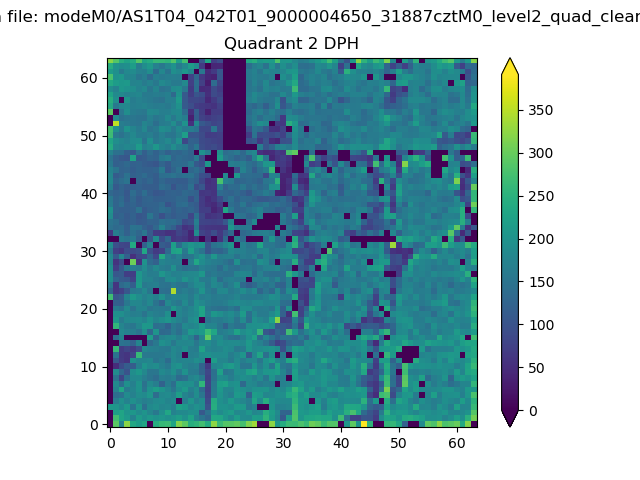
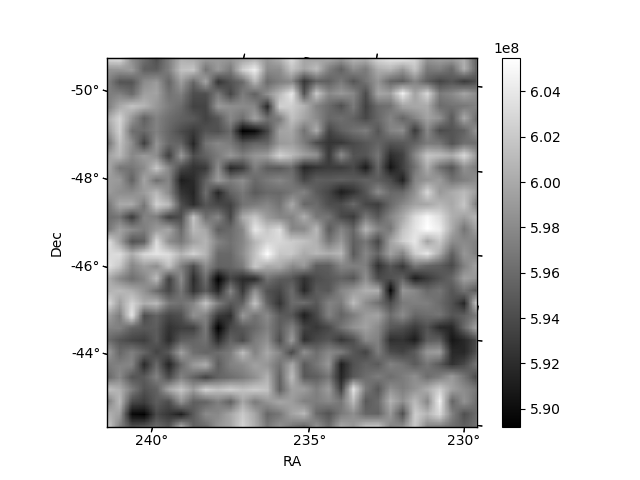
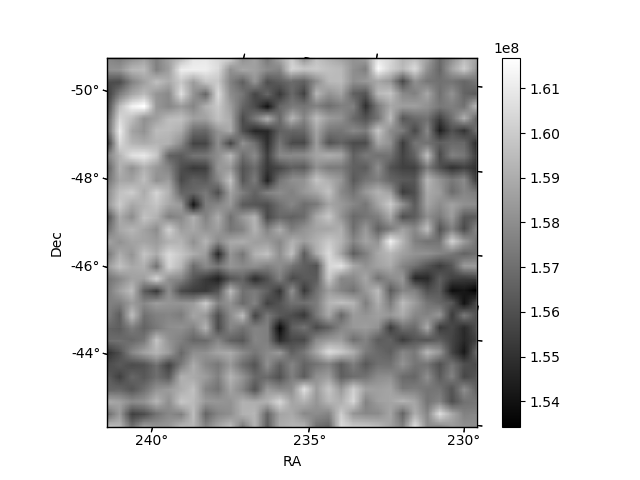
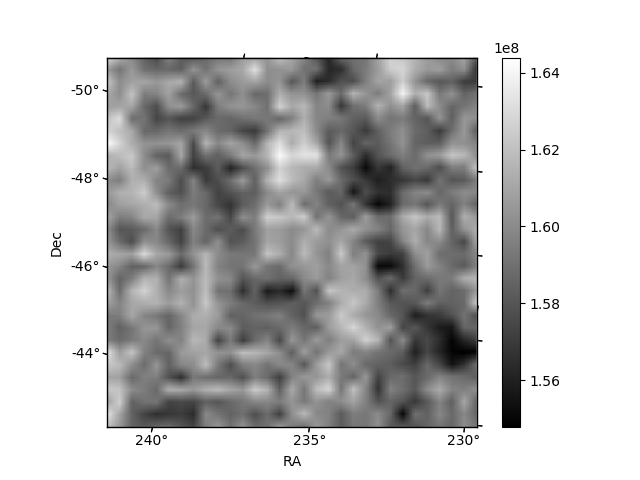
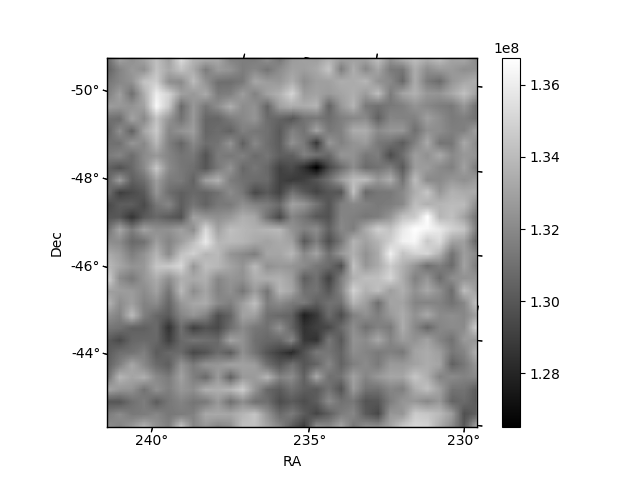
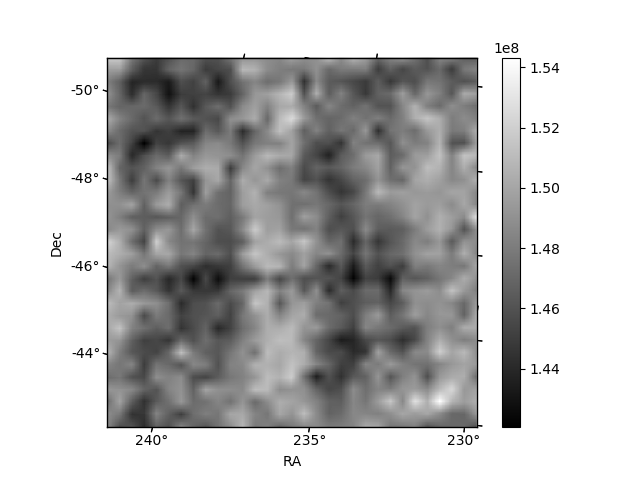
Histogram calculated using DETX and DETY for each event in the final _common_clean file
| Quadrant A | 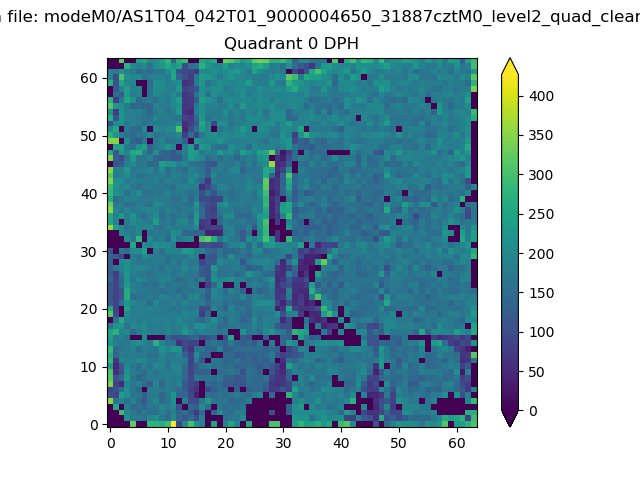 |
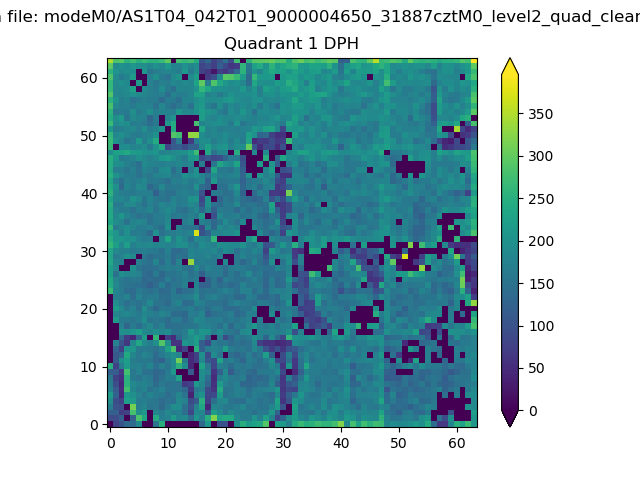 |
Quadrant B |
|---|---|---|---|
| Quadrant D | 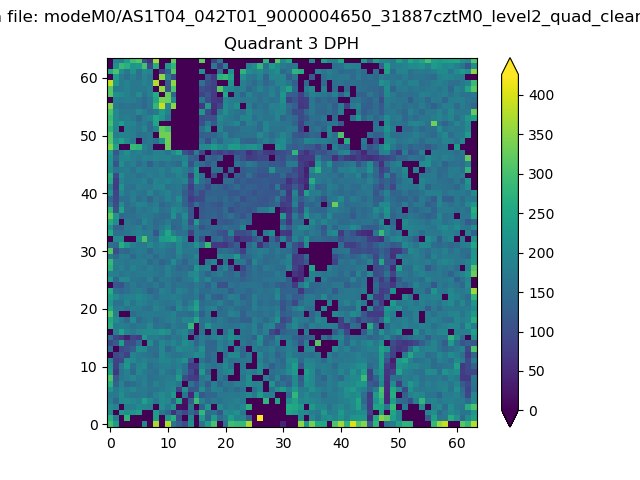 |
 |
Quadrant C |
| Plot type | Count rate plots | Images |
|---|---|---|
| Comparison with Poisson distribution Blue bars denote a histogram of data divided into 1 sec bins. Red curve is a Poisson curve with rate = median count rate of data. |
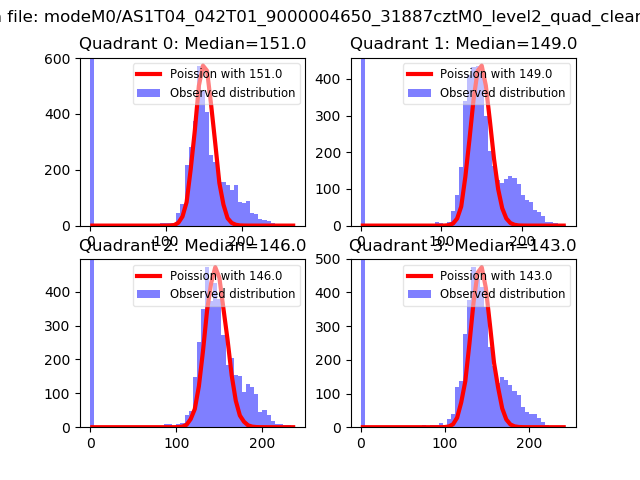 |
 |
| Quadrant-wise count rates Data is divided into 100 sec bins |
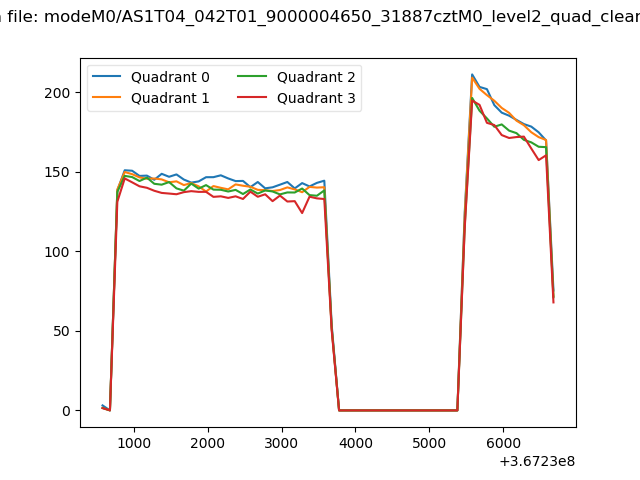 |
|
| Module-wise count rates for Quadrant A Data is divided into 100 sec bins |
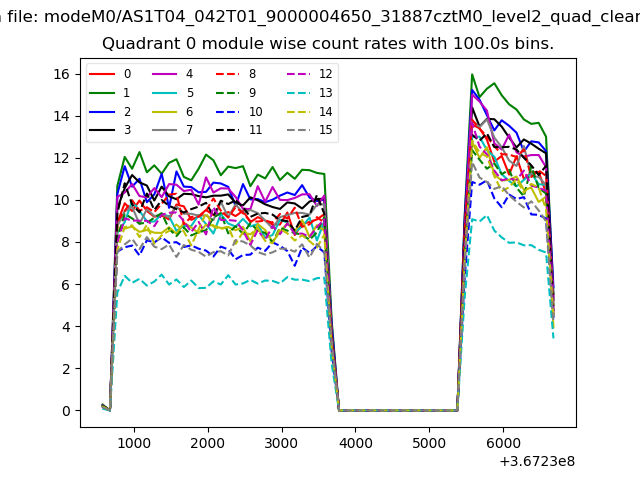 |
 |
| Module-wise count rates for Quadrant B Data is divided into 100 sec bins |
 |
 |
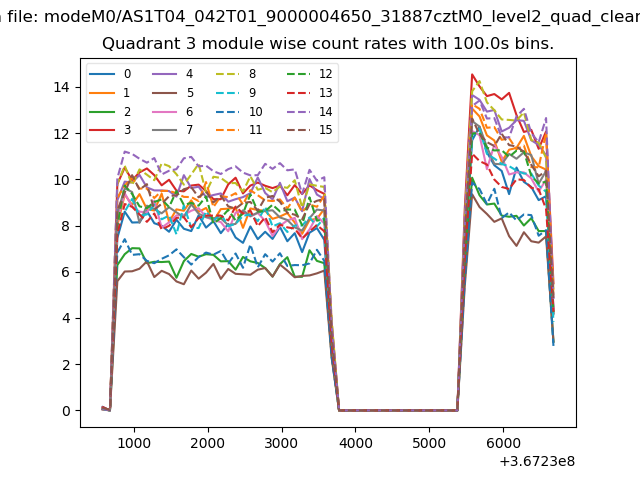
| Module-wise count rates for Quadrant C Data is divided into 100 sec bins |
 |
 |
| Module-wise count rates for Quadrant D Data is divided into 100 sec bins |
 |
 |
| Parameter | Plot |
|---|---|
| CZT HV Monitor | 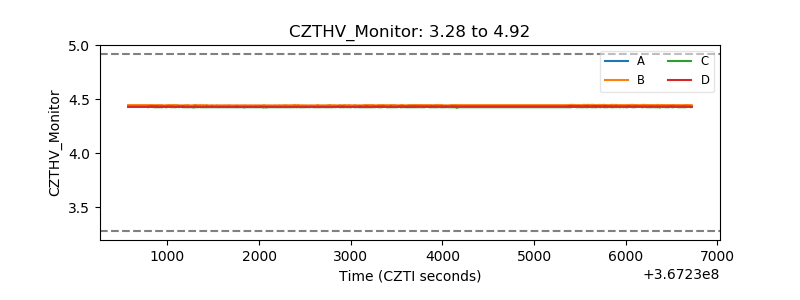 |
| D_VDD | 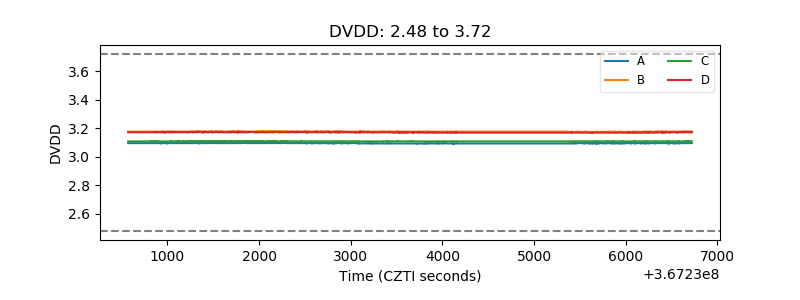 |
| Temperature 1 | 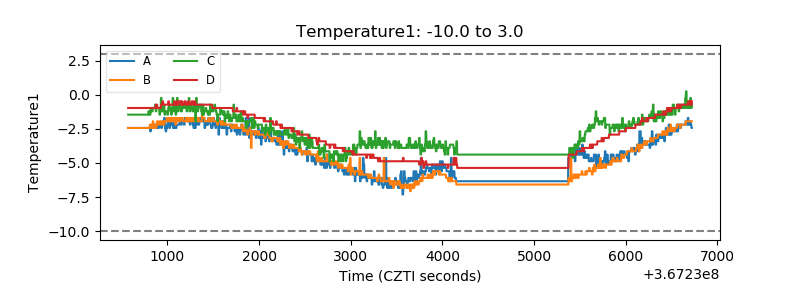 |
| Veto HV Monitor | 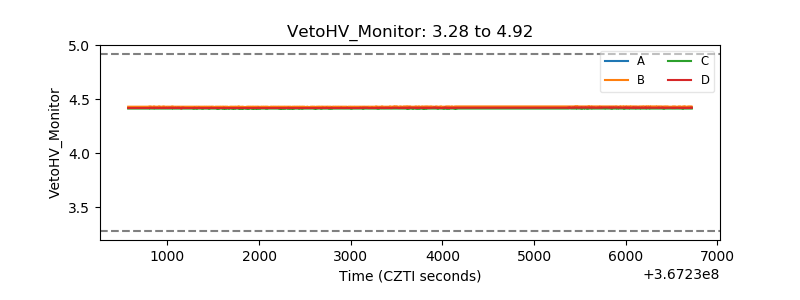 |
| Veto LLD | 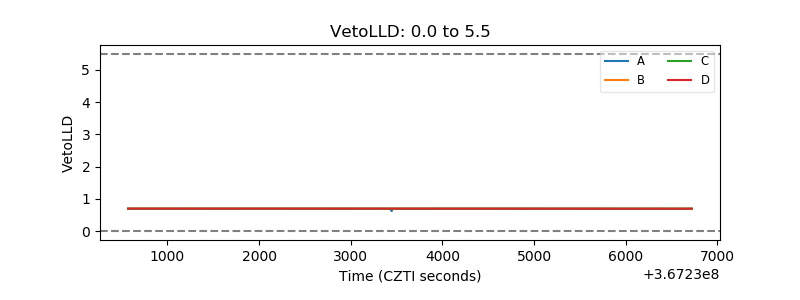 |
| Alpha Counter |  |
| _CPM_Rate | 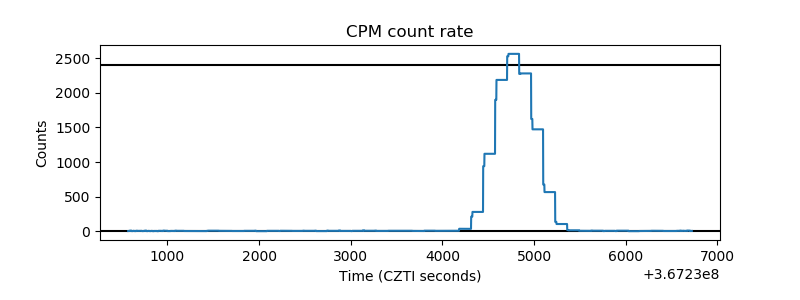 |
| CZT Counter | 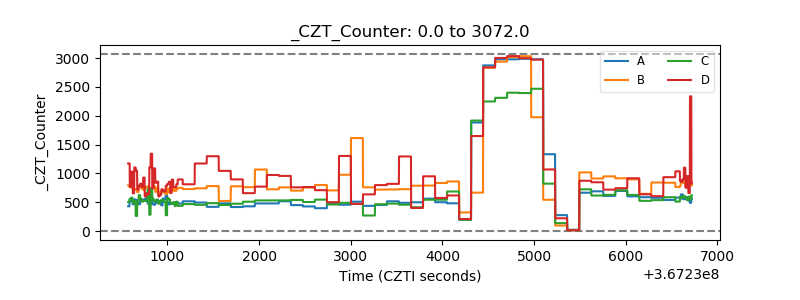 |
| +2.5 Volts monitor |  |
| +5 Volts monitor |  |
| _ROLL_ROT | 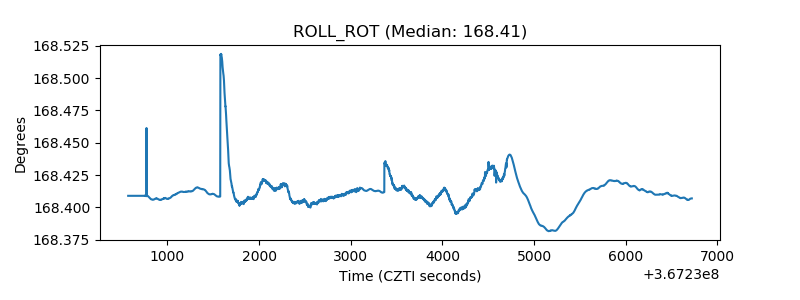 |
| _Roll_DEC | 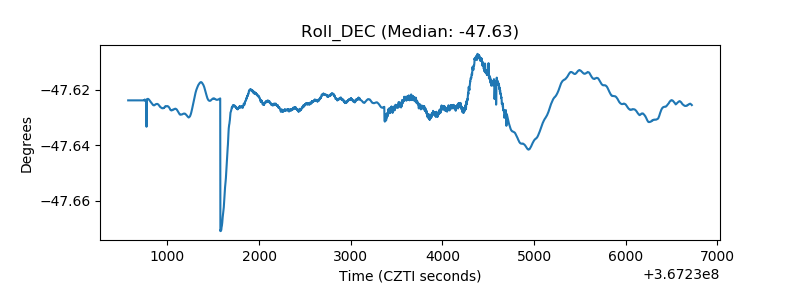 |
| _Roll_RA | 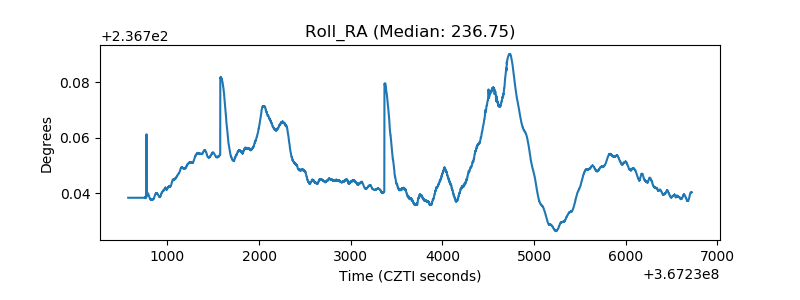 |
| Veto Counter | 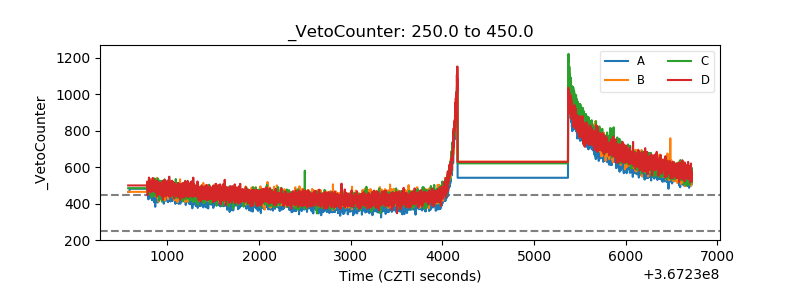 |