| Param | Original file | Final file |
|---|---|---|
| Filename | modeM0/AS1T04_042T01_9000004650_31889cztM0_level2.evt | modeM0/AS1T04_042T01_9000004650_31889cztM0_level2_quad_clean.evt |
| Size (bytes) | 572,451,840 | 116,769,600 |
| Size | 545.9 MB | 111.4 MB |
| Events in quadrant A | 3,733,841 | 812,065 |
| Events in quadrant B | 5,117,255 | 790,075 |
| Events in quadrant C | 3,410,600 | 758,226 |
| Events in quadrant D | 4,661,605 | 749,617 |
| Mode M0 | |||
|---|---|---|---|
| Quadrant | BADHDUFLAG | Total packets | Discarded packets |
| A | 0 | 14992 | 1 |
| B | 0 | 19264 | 1 |
| C | 0 | 13898 | 1 |
| D | 0 | 17776 | 4 |
| Mode SS | |||
|---|---|---|---|
| Quadrant | BADHDUFLAG | Total packets | Discarded packets |
| A | 0 | 124 | 0 |
| B | 0 | 124 | 0 |
| C | 0 | 124 | 0 |
| D | 0 | 124 | 0 |
| Mode M9 | |||
|---|---|---|---|
| Quadrant | BADHDUFLAG | Total packets | Discarded packets |
| A | 0 | 13 | 0 |
| B | 0 | 13 | 0 |
| C | 0 | 13 | 0 |
| D | 0 | 13 | 0 |
| Quadrant | Total seconds | Saturated seconds | Saturation percentage |
|---|---|---|---|
| A | 6113 | 253 | 4.138721% |
| B | 6114 | 188 | 3.074910% |
| C | 6114 | 186 | 3.042198% |
| D | 6113 | 139 | 2.273843% |
Noise dominated data is calculated using 1-second bins in cleaned event files. If a bin has >2000 counts, and if more than 50% of those come from <1% of pixels, then it is considered to be noise-dominated and hence unusable.
| Quadrant | # 1 sec bins | Bins with >0 counts | Bins with >2000 counts | High rate bins dominated by noise | Noise dominated (total time) | Noise dominated (detector-on time) | Marked lightcurve |
|---|---|---|---|---|---|---|---|
| A | 7413 | 6114 | 113 | 113 | 1.52% | 1.85% | 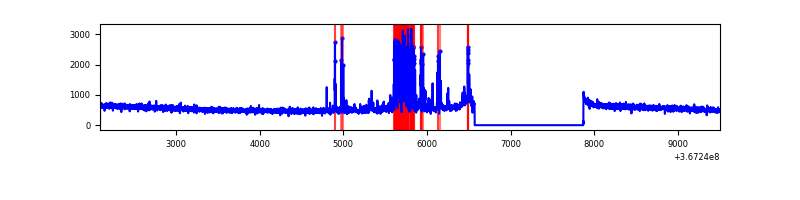 |
| B | 7414 | 6115 | 34 | 34 | 0.46% | 0.56% | 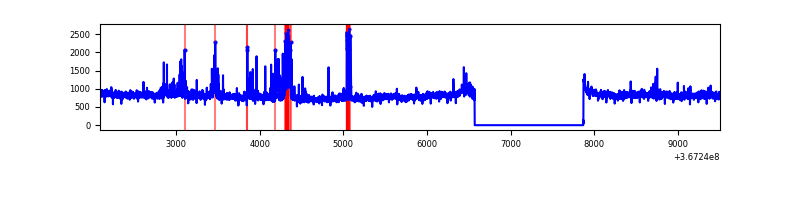 |
| C | 7414 | 6115 | 27 | 27 | 0.36% | 0.44% | 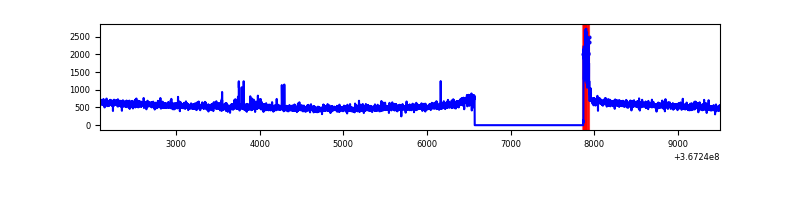 |
| D | 7413 | 6114 | 54 | 54 | 0.73% | 0.88% | 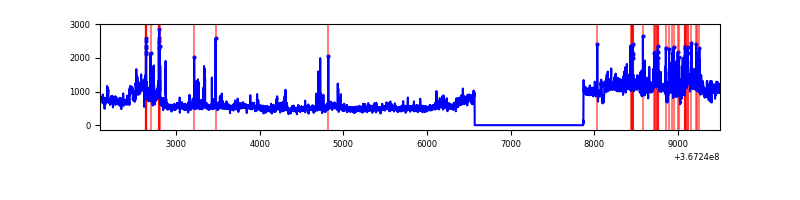 |
Top three noisy pixels from each quadrant. If the there are fewer than three noisy pixels in the level2.evt file, extra rows are filled as -1
| Pixel properties | Quadrant properties | ||||||
|---|---|---|---|---|---|---|---|
| Quadrant | DetID | PixID | Counts | Sigma | Mean | Median | Sigma |
| A | 0 | 13 | 501846 | 3058.45 | 835 | 822 | 163.8 |
| A | 13 | 6 | 12008 | 68.28 | 835 | 822 | 163.8 |
| A | 13 | 254 | 9784 | 54.71 | 835 | 822 | 163.8 |
| B | 6 | 159 | 1604585 | 10345.81 | 817 | 798 | 155.0 |
| B | 10 | 245 | 228389 | 1468.16 | 817 | 798 | 155.0 |
| B | 0 | 213 | 33136 | 208.61 | 817 | 798 | 155.0 |
| C | 14 | 238 | 130960 | 727.19 | 779 | 786 | 179.0 |
| C | 3 | 233 | 126575 | 702.69 | 779 | 786 | 179.0 |
| C | 0 | 10 | 91368 | 506.02 | 779 | 786 | 179.0 |
| D | 8 | 195 | 1240527 | 6607.05 | 808 | 788 | 187.6 |
| D | 12 | 79 | 148510 | 787.27 | 808 | 788 | 187.6 |
| D | 12 | 33 | 106002 | 560.73 | 808 | 788 | 187.6 |
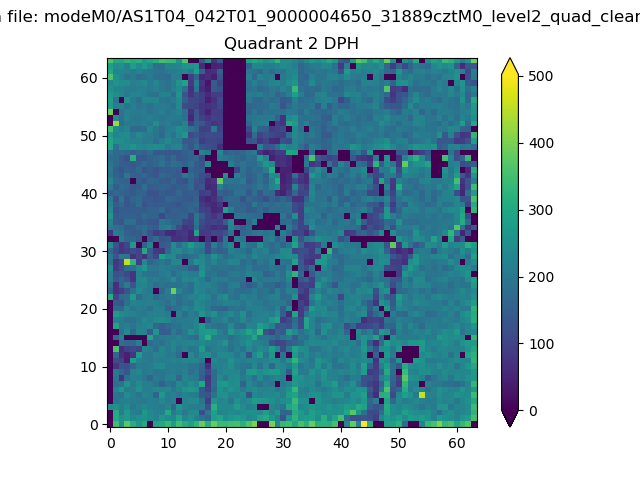
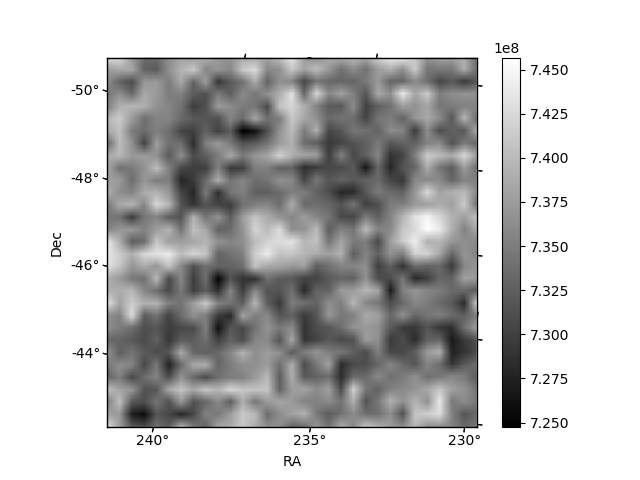
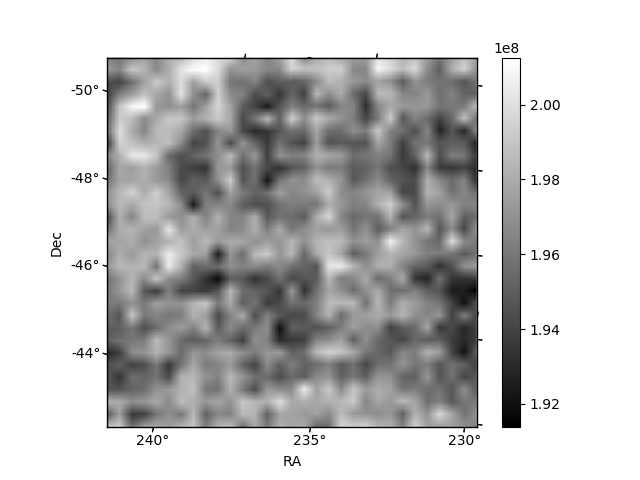
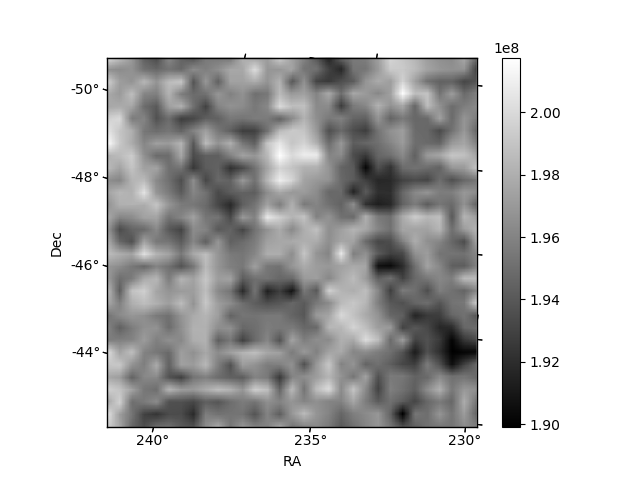
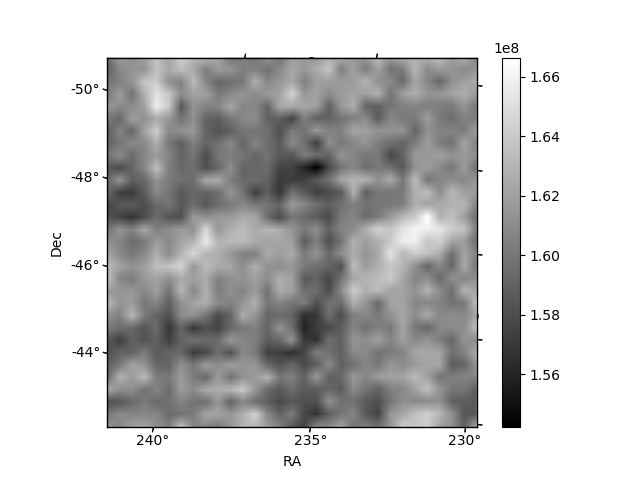
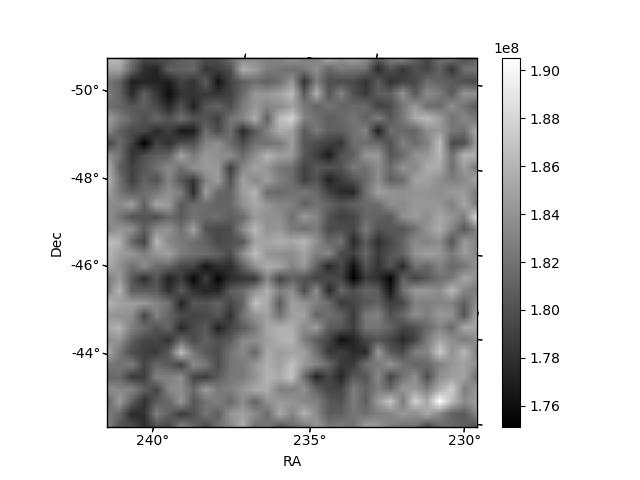
Histogram calculated using DETX and DETY for each event in the final _common_clean file
| Quadrant A | 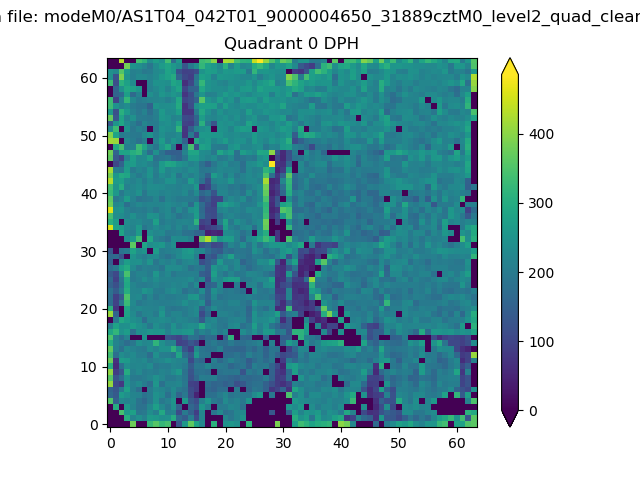 |
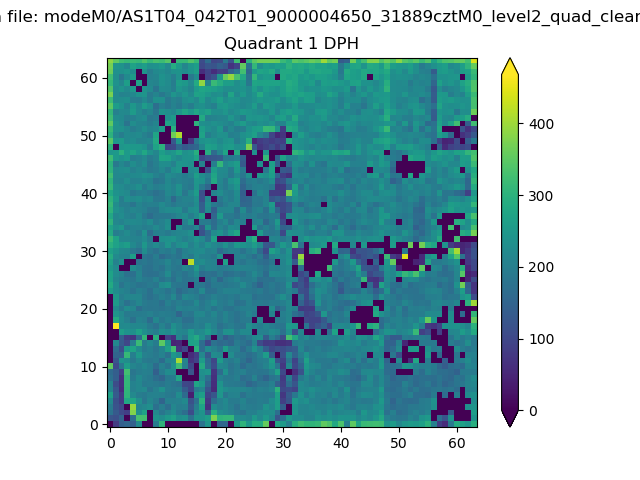 |
Quadrant B |
|---|---|---|---|
| Quadrant D | 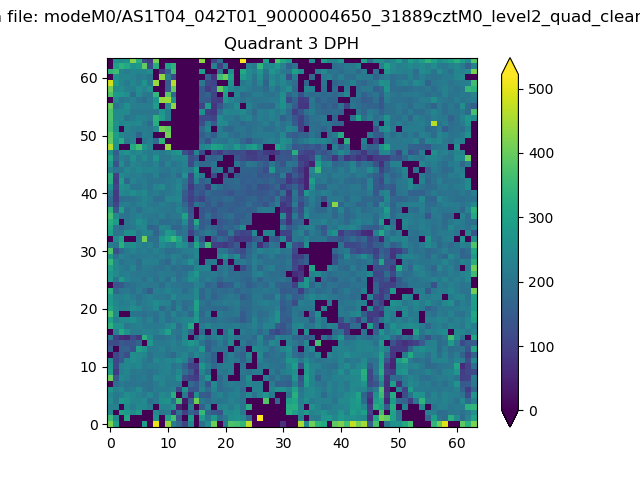 |
 |
Quadrant C |
| Plot type | Count rate plots | Images |
|---|---|---|
| Comparison with Poisson distribution Blue bars denote a histogram of data divided into 1 sec bins. Red curve is a Poisson curve with rate = median count rate of data. |
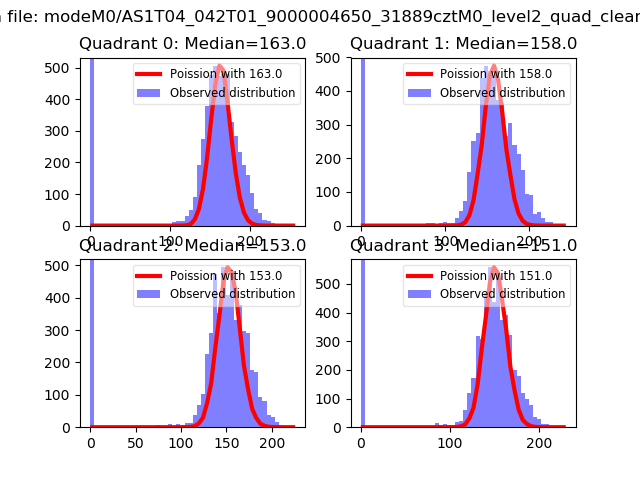 |
 |
| Quadrant-wise count rates Data is divided into 100 sec bins |
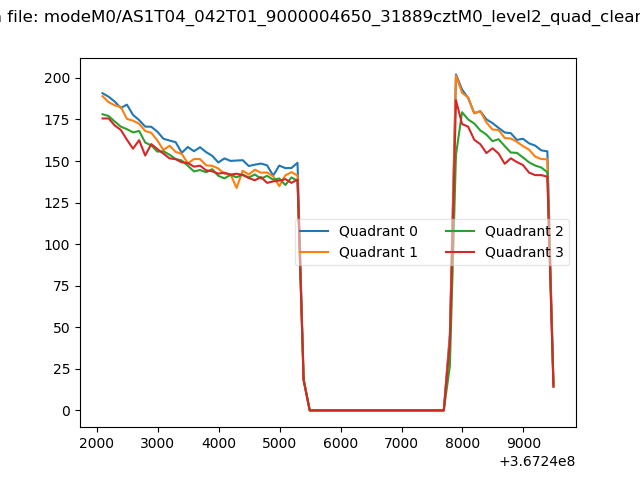 |
|
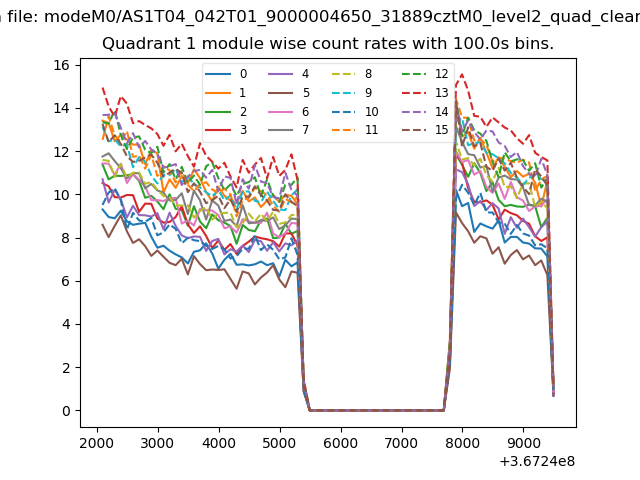
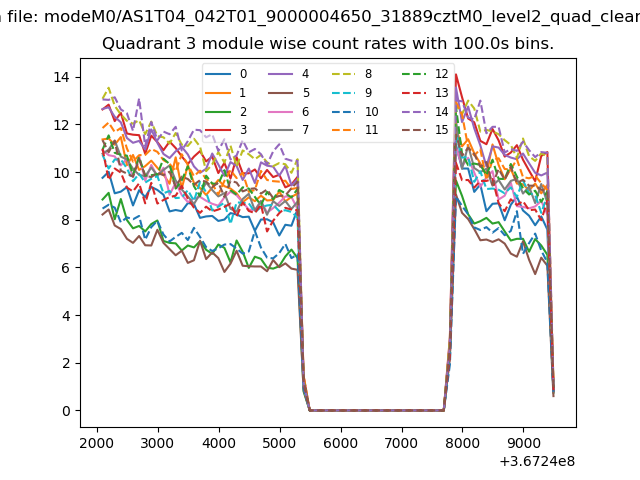
| Module-wise count rates for Quadrant A Data is divided into 100 sec bins |
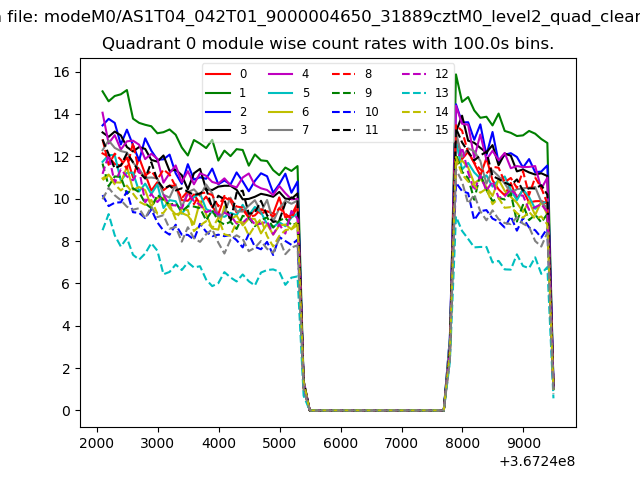 |
 |
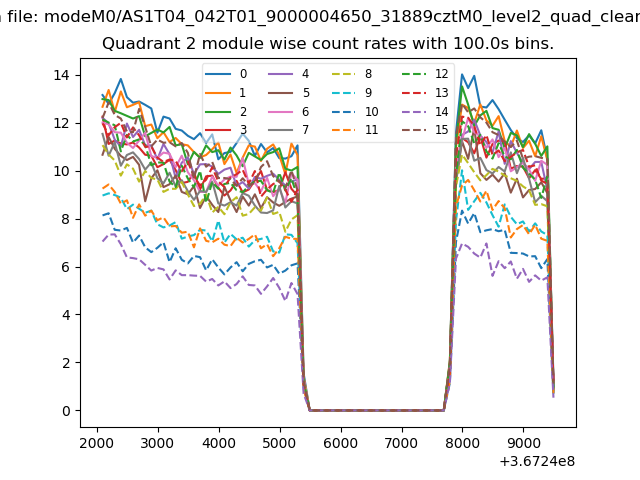
| Module-wise count rates for Quadrant B Data is divided into 100 sec bins |
 |
 |
| Module-wise count rates for Quadrant C Data is divided into 100 sec bins |
 |
 |
| Module-wise count rates for Quadrant D Data is divided into 100 sec bins |
 |
 |
| Parameter | Plot |
|---|---|
| CZT HV Monitor | 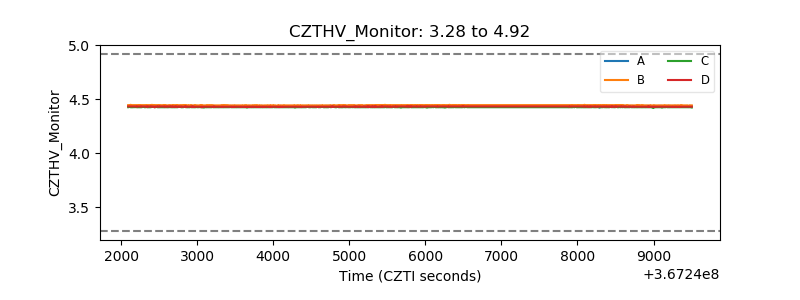 |
| D_VDD | 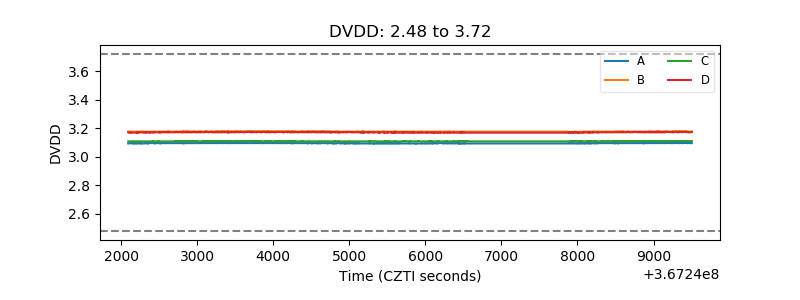 |
| Temperature 1 | 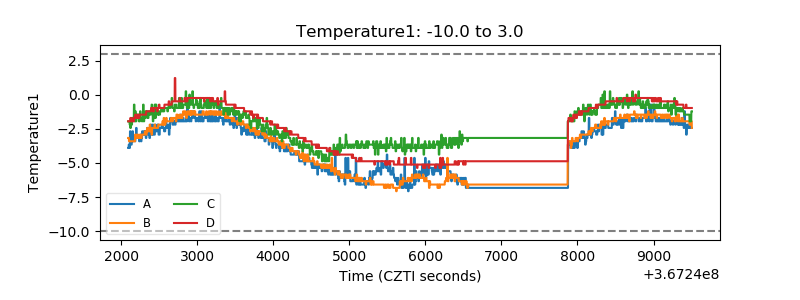 |
| Veto HV Monitor |  |
| Veto LLD | 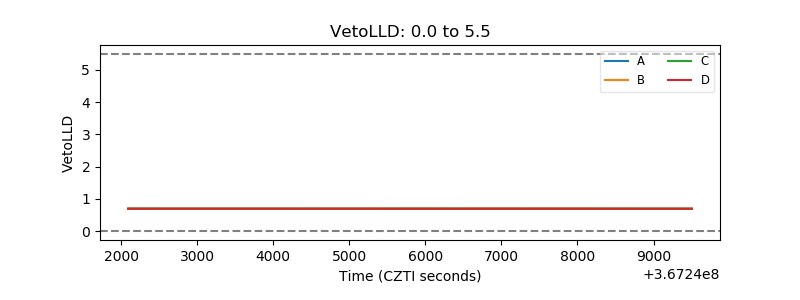 |
| Alpha Counter | 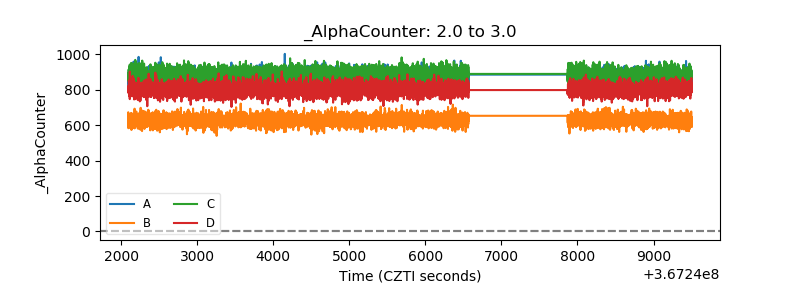 |
| _CPM_Rate | 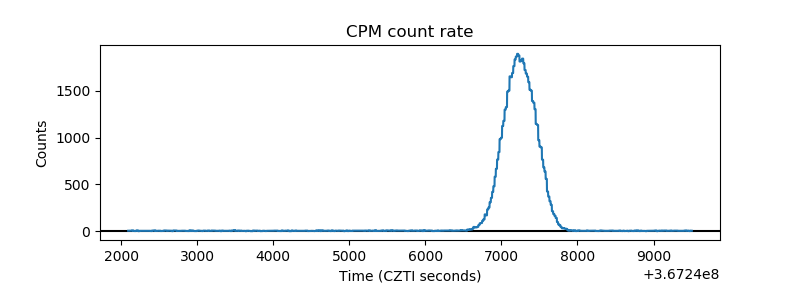 |
| CZT Counter | 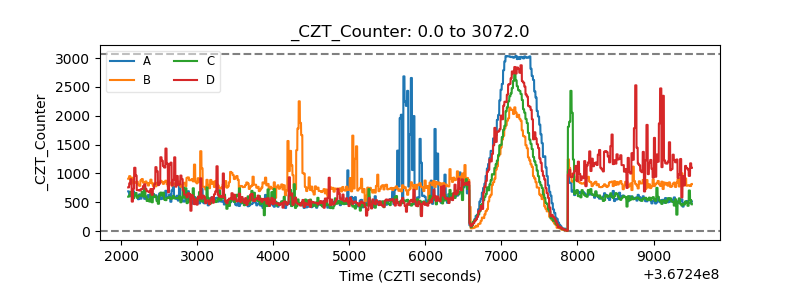 |
| +2.5 Volts monitor |  |
| +5 Volts monitor |  |
| _ROLL_ROT | 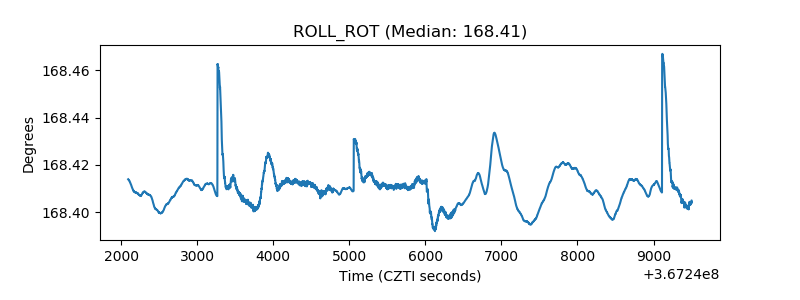 |
| _Roll_DEC | 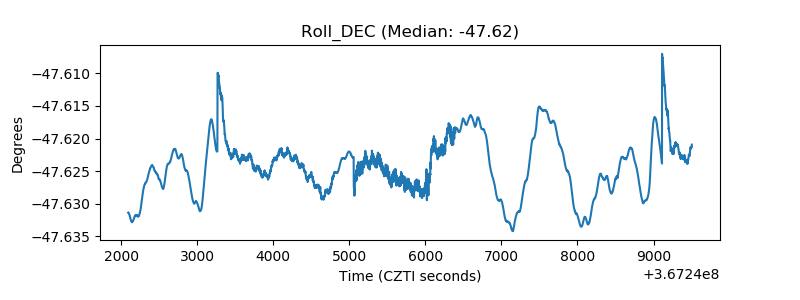 |
| _Roll_RA | 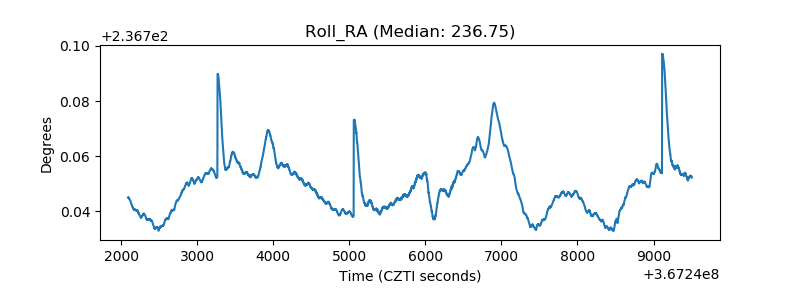 |
| Veto Counter | 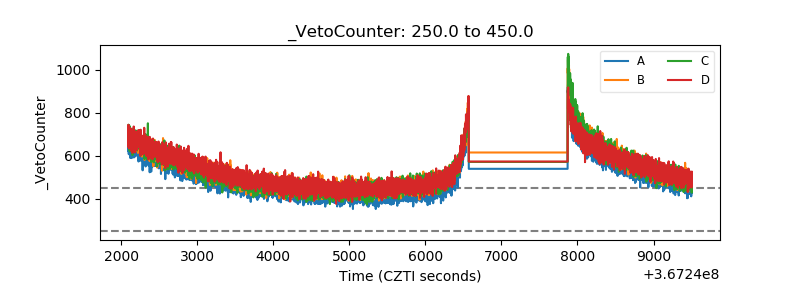 |