| Param | Original file | Final file |
|---|---|---|
| Filename | modeM0/AS1T04_042T01_9000004650_31890cztM0_level2.evt | modeM0/AS1T04_042T01_9000004650_31890cztM0_level2_quad_clean.evt |
| Size (bytes) | 562,982,400 | 87,595,200 |
| Size | 536.9 MB | 83.5 MB |
| Events in quadrant A | 2,858,783 | 606,607 |
| Events in quadrant B | 4,422,019 | 590,130 |
| Events in quadrant C | 4,242,003 | 516,859 |
| Events in quadrant D | 5,145,681 | 544,431 |
| Mode M0 | |||
|---|---|---|---|
| Quadrant | BADHDUFLAG | Total packets | Discarded packets |
| A | 0 | 11914 | 1 |
| B | 0 | 17170 | 1 |
| C | 0 | 16185 | 1 |
| D | 0 | 19222 | 1 |
| Mode SS | |||
|---|---|---|---|
| Quadrant | BADHDUFLAG | Total packets | Discarded packets |
| A | 0 | 116 | 0 |
| B | 0 | 116 | 0 |
| C | 0 | 116 | 0 |
| D | 0 | 116 | 0 |
| Mode M9 | |||
|---|---|---|---|
| Quadrant | BADHDUFLAG | Total packets | Discarded packets |
| A | 0 | 12 | 0 |
| B | 0 | 12 | 0 |
| C | 0 | 12 | 0 |
| D | 0 | 12 | 0 |
| Quadrant | Total seconds | Saturated seconds | Saturation percentage |
|---|---|---|---|
| A | 5633 | 92 | 1.633233% |
| B | 5634 | 163 | 2.893149% |
| C | 5634 | 707 | 12.548811% |
| D | 5634 | 375 | 6.656017% |
Noise dominated data is calculated using 1-second bins in cleaned event files. If a bin has >2000 counts, and if more than 50% of those come from <1% of pixels, then it is considered to be noise-dominated and hence unusable.
| Quadrant | # 1 sec bins | Bins with >0 counts | Bins with >2000 counts | High rate bins dominated by noise | Noise dominated (total time) | Noise dominated (detector-on time) | Marked lightcurve |
|---|---|---|---|---|---|---|---|
| A | 6843 | 5634 | 0 | 0 | 0.00% | 0.00% | 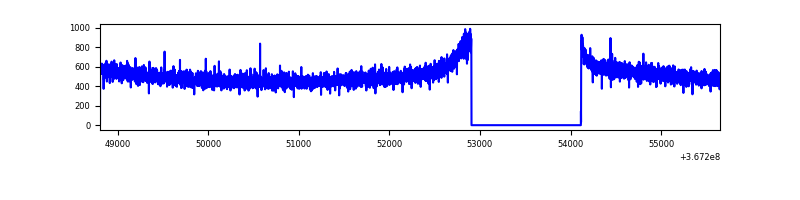 |
| B | 6844 | 5635 | 0 | 0 | 0.00% | 0.00% | 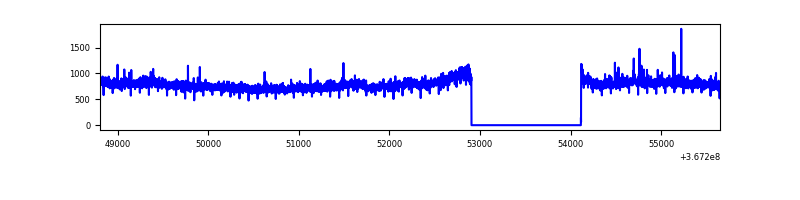 |
| C | 6844 | 5635 | 536 | 536 | 7.83% | 9.51% | 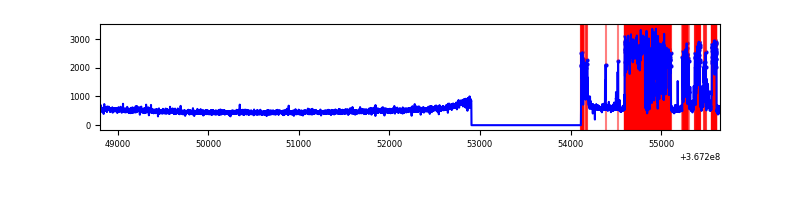 |
| D | 6844 | 5635 | 323 | 323 | 4.72% | 5.73% | 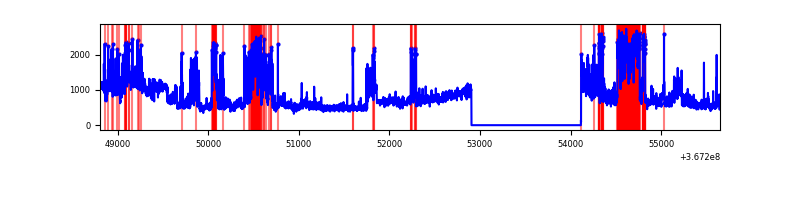 |
Top three noisy pixels from each quadrant. If the there are fewer than three noisy pixels in the level2.evt file, extra rows are filled as -1
| Pixel properties | Quadrant properties | ||||||
|---|---|---|---|---|---|---|---|
| Quadrant | DetID | PixID | Counts | Sigma | Mean | Median | Sigma |
| A | 13 | 254 | 8710 | 54.44 | 740 | 726 | 146.7 |
| A | 3 | 137 | 7075 | 43.29 | 740 | 726 | 146.7 |
| A | 0 | 226 | 6413 | 38.78 | 740 | 726 | 146.7 |
| B | 6 | 159 | 1560446 | 11500.44 | 719 | 704 | 135.6 |
| B | 12 | 111 | 15897 | 112.02 | 719 | 704 | 135.6 |
| B | 5 | 172 | 15831 | 111.54 | 719 | 704 | 135.6 |
| C | 0 | 239 | 1425804 | 9473.48 | 649 | 652 | 150.4 |
| C | 14 | 238 | 107529 | 710.45 | 649 | 652 | 150.4 |
| C | 0 | 10 | 89422 | 590.09 | 649 | 652 | 150.4 |
| D | 8 | 195 | 1266195 | 7613.87 | 698 | 680 | 166.2 |
| D | 12 | 79 | 1078446 | 6484.3 | 698 | 680 | 166.2 |
| D | 12 | 33 | 77236 | 460.59 | 698 | 680 | 166.2 |
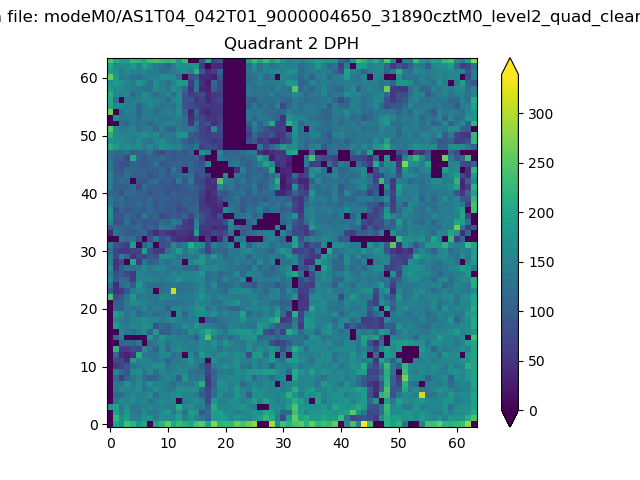
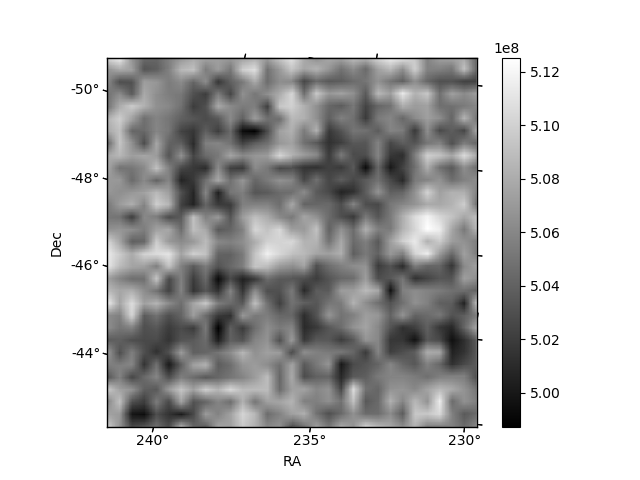
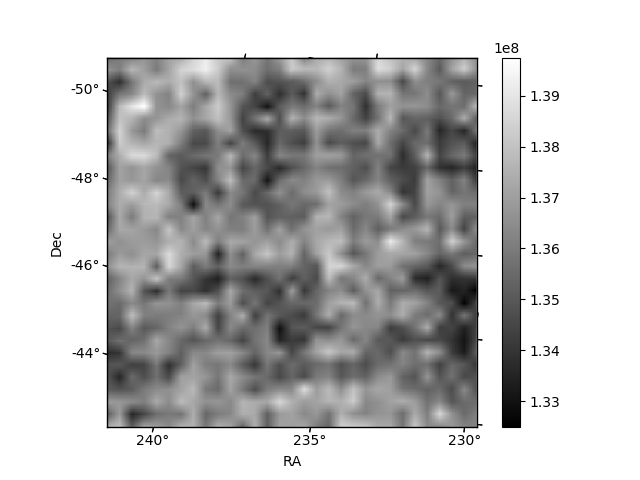
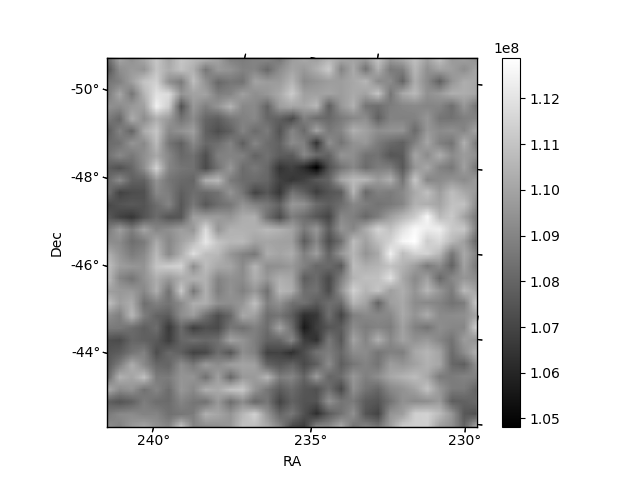
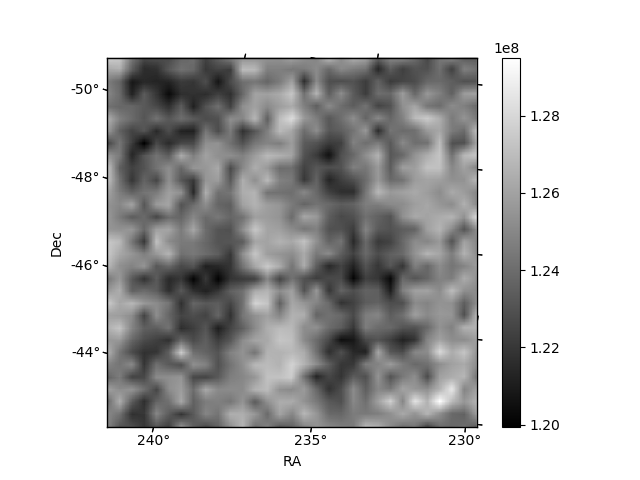
Histogram calculated using DETX and DETY for each event in the final _common_clean file
| Quadrant A | 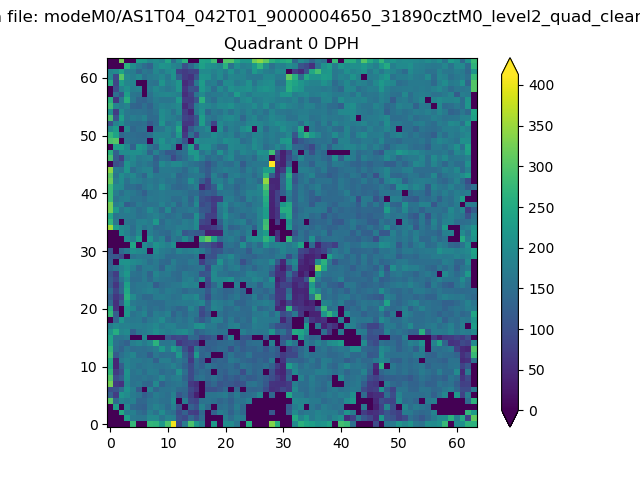 |
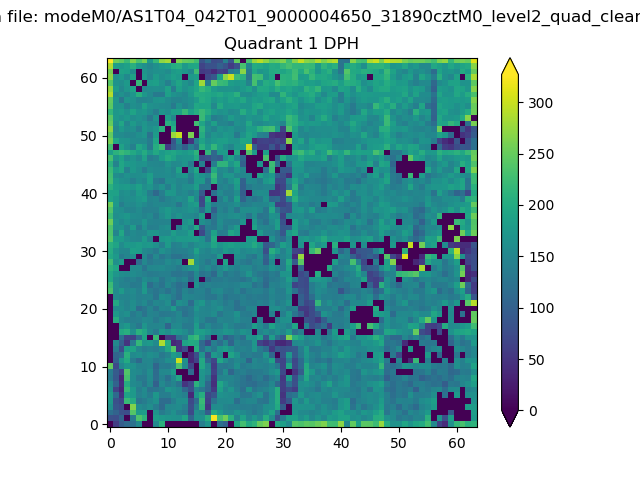 |
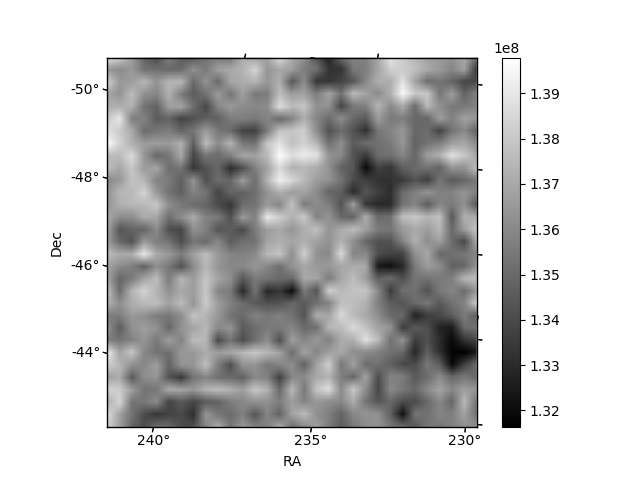
Quadrant B |
|---|---|---|---|
| Quadrant D | 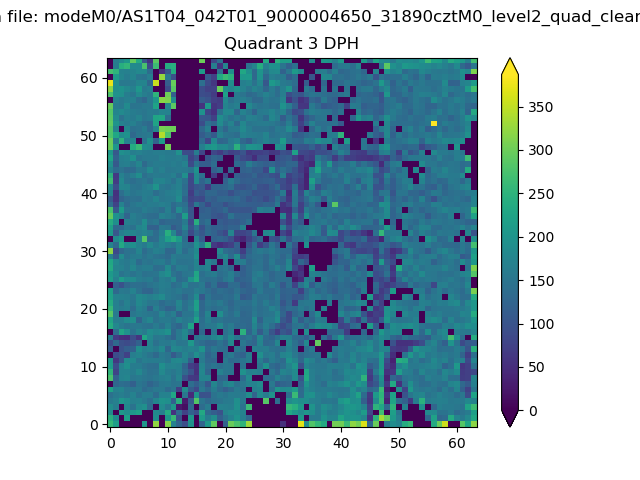 |
 |
Quadrant C |
| Plot type | Count rate plots | Images |
|---|---|---|
| Comparison with Poisson distribution Blue bars denote a histogram of data divided into 1 sec bins. Red curve is a Poisson curve with rate = median count rate of data. |
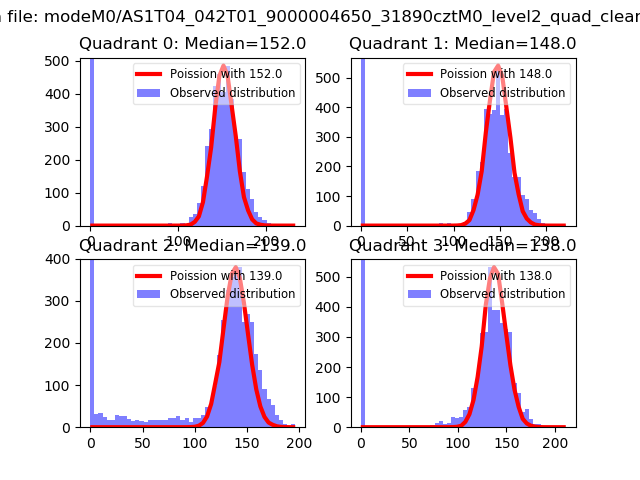 |
 |
| Quadrant-wise count rates Data is divided into 100 sec bins |
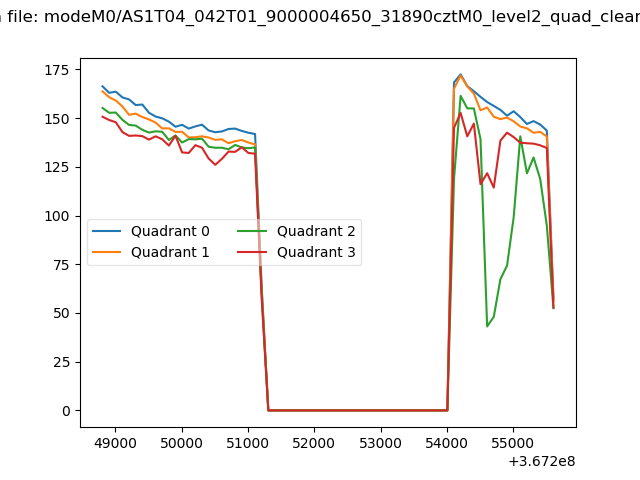 |
|
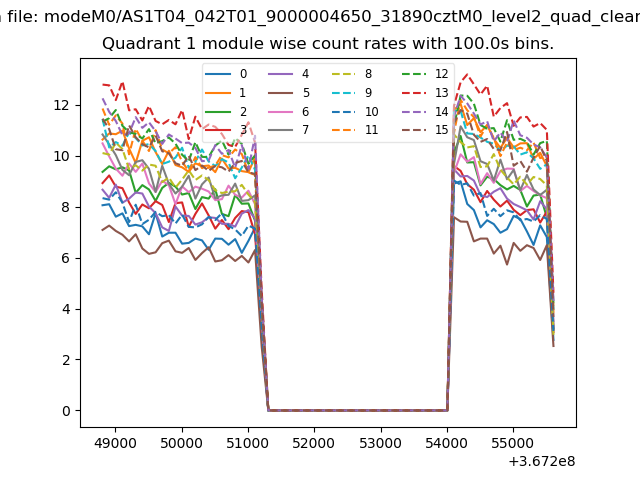
| Module-wise count rates for Quadrant A Data is divided into 100 sec bins |
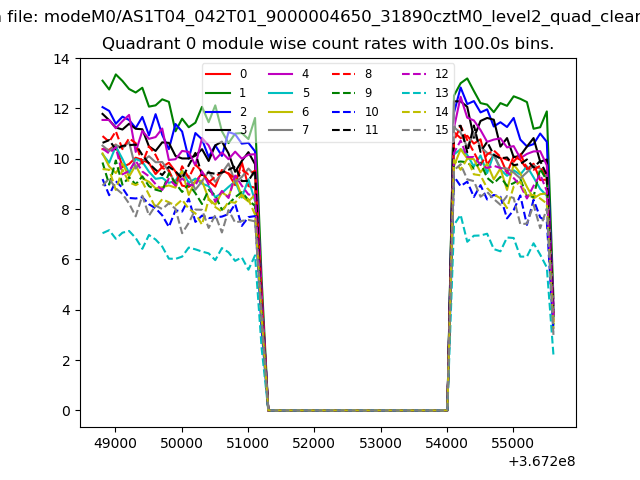 |
 |
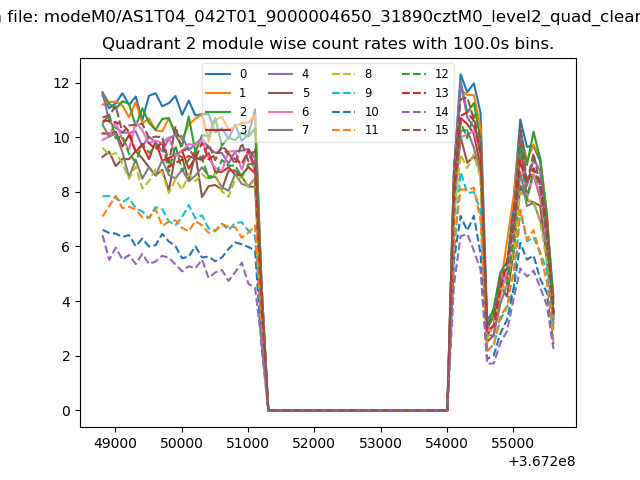
| Module-wise count rates for Quadrant B Data is divided into 100 sec bins |
 |
 |
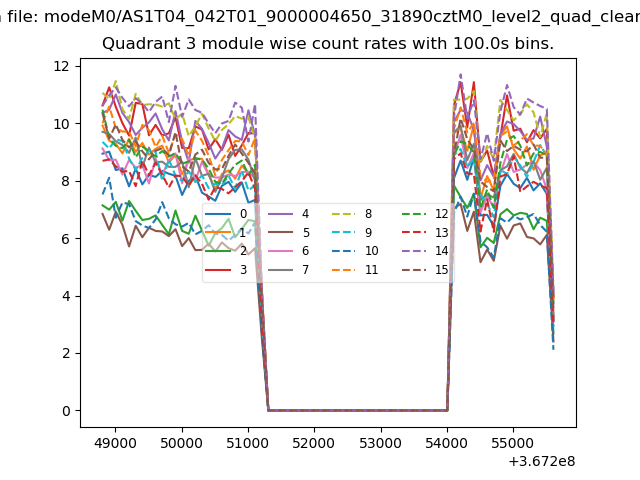
| Module-wise count rates for Quadrant C Data is divided into 100 sec bins |
 |
 |
| Module-wise count rates for Quadrant D Data is divided into 100 sec bins |
 |
 |
| Parameter | Plot |
|---|---|
| CZT HV Monitor | 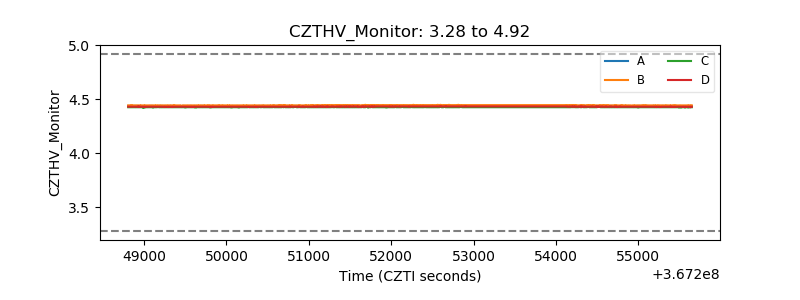 |
| D_VDD | 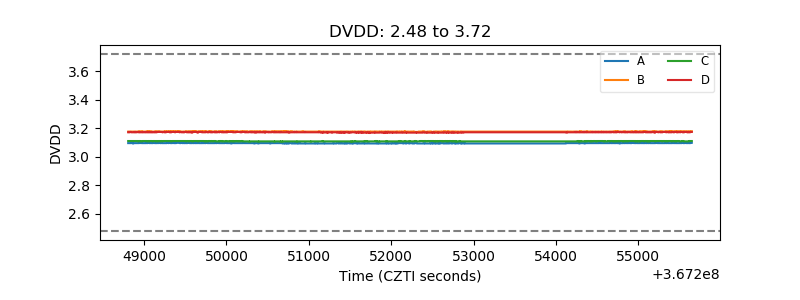 |
| Temperature 1 |  |
| Veto HV Monitor | 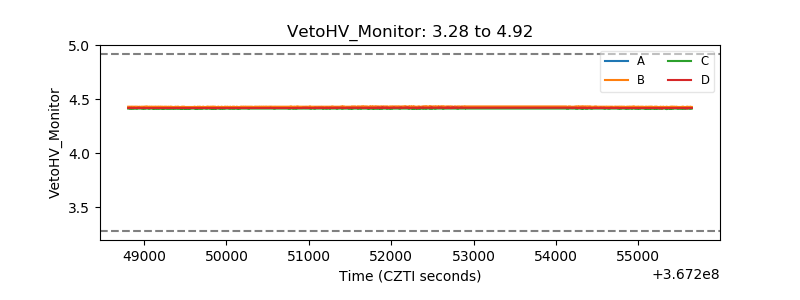 |
| Veto LLD | 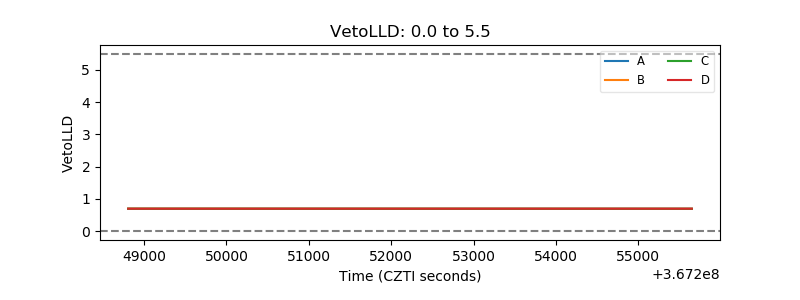 |
| Alpha Counter | 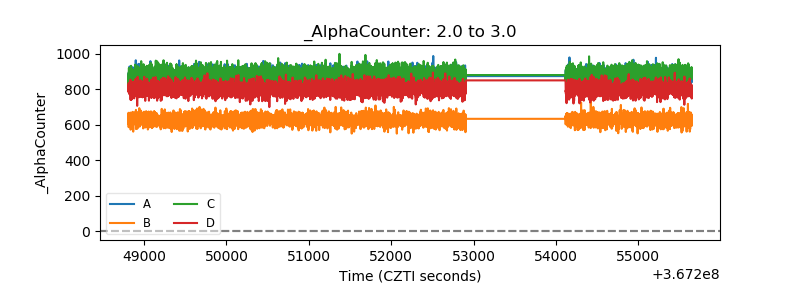 |
| _CPM_Rate | 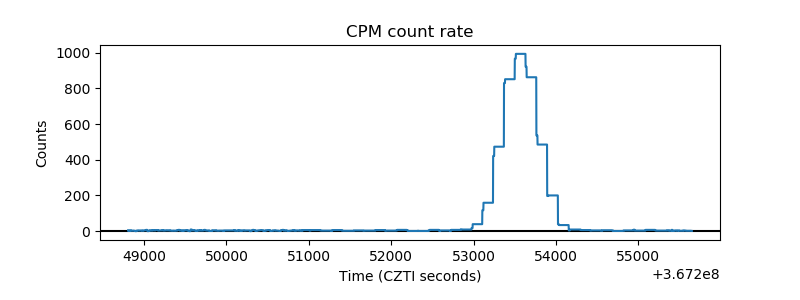 |
| CZT Counter | 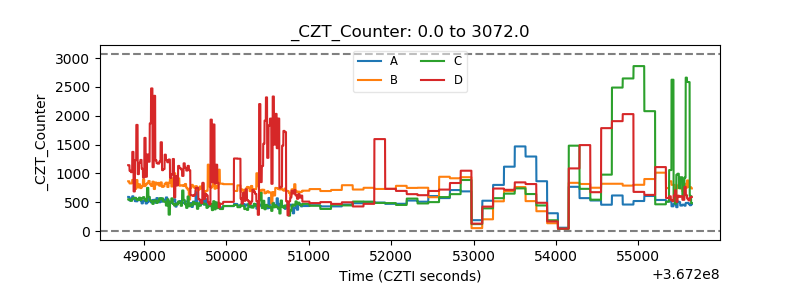 |
| +2.5 Volts monitor | 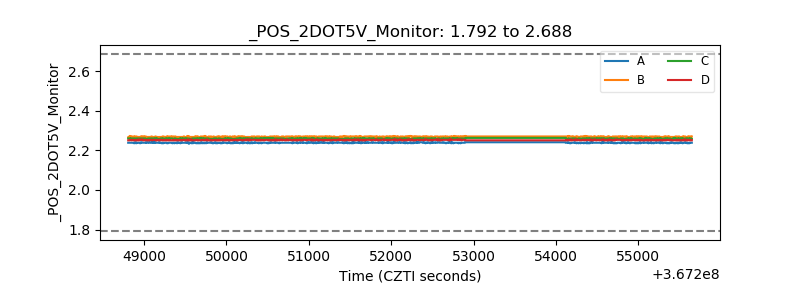 |
| +5 Volts monitor |  |
| _ROLL_ROT | 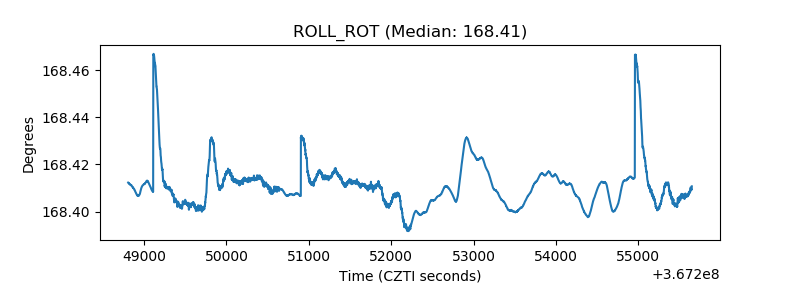 |
| _Roll_DEC |  |
| _Roll_RA | 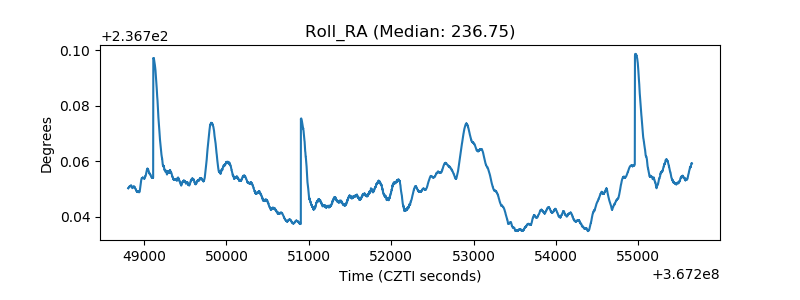 |
| Veto Counter | 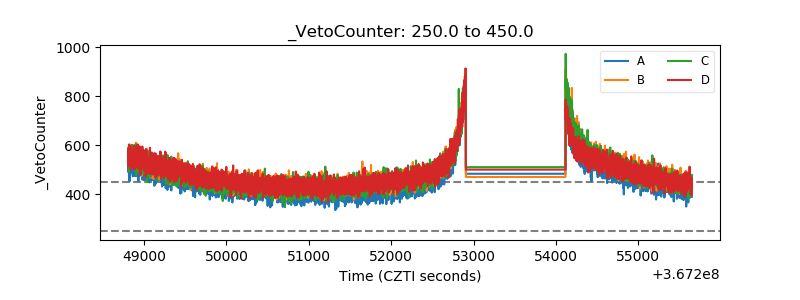 |