| Param | Original file | Final file |
|---|---|---|
| Filename | modeM0/AS1T04_042T01_9000004650_31891cztM0_level2.evt | modeM0/AS1T04_042T01_9000004650_31891cztM0_level2_quad_clean.evt |
| Size (bytes) | 553,829,760 | 88,392,960 |
| Size | 528.2 MB | 84.3 MB |
| Events in quadrant A | 2,911,549 | 599,757 |
| Events in quadrant B | 4,868,752 | 582,059 |
| Events in quadrant C | 4,969,057 | 516,625 |
| Events in quadrant D | 3,617,592 | 559,587 |
| Mode M0 | |||
|---|---|---|---|
| Quadrant | BADHDUFLAG | Total packets | Discarded packets |
| A | 0 | 12431 | 1 |
| B | 0 | 18764 | 2 |
| C | 0 | 18777 | 1 |
| D | 0 | 14718 | 1 |
| Mode SS | |||
|---|---|---|---|
| Quadrant | BADHDUFLAG | Total packets | Discarded packets |
| A | 0 | 122 | 0 |
| B | 0 | 122 | 0 |
| C | 0 | 122 | 0 |
| D | 0 | 122 | 0 |
| Mode M9 | |||
|---|---|---|---|
| Quadrant | BADHDUFLAG | Total packets | Discarded packets |
| A | 0 | 10 | 0 |
| B | 0 | 10 | 0 |
| C | 0 | 10 | 0 |
| D | 0 | 10 | 0 |
| Quadrant | Total seconds | Saturated seconds | Saturation percentage |
|---|---|---|---|
| A | 5992 | 44 | 0.734312% |
| B | 5992 | 150 | 2.503338% |
| C | 5992 | 721 | 12.032710% |
| D | 5992 | 58 | 0.967957% |
Noise dominated data is calculated using 1-second bins in cleaned event files. If a bin has >2000 counts, and if more than 50% of those come from <1% of pixels, then it is considered to be noise-dominated and hence unusable.
| Quadrant | # 1 sec bins | Bins with >0 counts | Bins with >2000 counts | High rate bins dominated by noise | Noise dominated (total time) | Noise dominated (detector-on time) | Marked lightcurve |
|---|---|---|---|---|---|---|---|
| A | 6987 | 5993 | 0 | 0 | 0.00% | 0.00% | 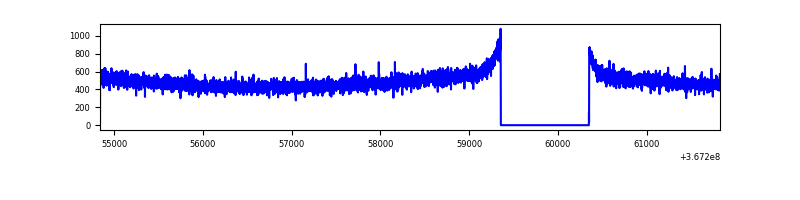 |
| B | 6987 | 5993 | 34 | 34 | 0.49% | 0.57% | 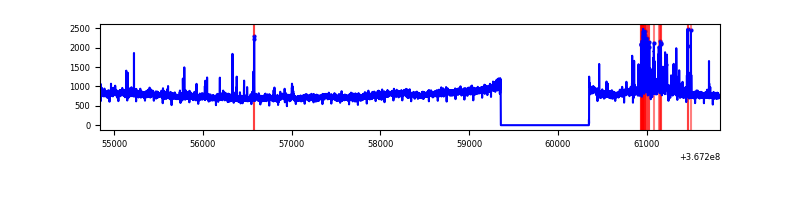 |
| C | 6987 | 5993 | 540 | 540 | 7.73% | 9.01% | 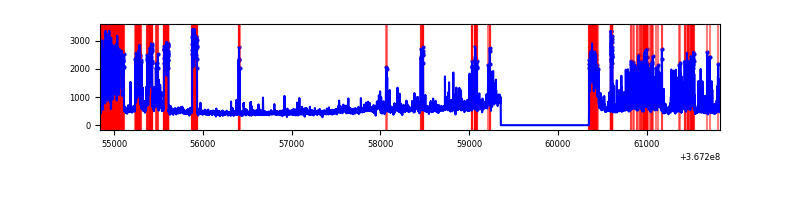 |
| D | 6987 | 5993 | 39 | 39 | 0.56% | 0.65% | 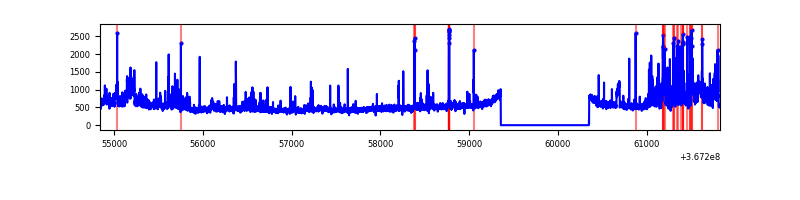 |
Top three noisy pixels from each quadrant. If the there are fewer than three noisy pixels in the level2.evt file, extra rows are filled as -1
| Pixel properties | Quadrant properties | ||||||
|---|---|---|---|---|---|---|---|
| Quadrant | DetID | PixID | Counts | Sigma | Mean | Median | Sigma |
| A | 13 | 254 | 8585 | 52.08 | 753 | 740 | 150.6 |
| A | 3 | 137 | 7435 | 44.45 | 753 | 740 | 150.6 |
| A | 0 | 226 | 6570 | 38.7 | 753 | 740 | 150.6 |
| B | 6 | 159 | 1729170 | 12444.05 | 737 | 721 | 138.9 |
| B | 5 | 172 | 144672 | 1036.38 | 737 | 721 | 138.9 |
| B | 0 | 229 | 26969 | 188.97 | 737 | 721 | 138.9 |
| C | 0 | 239 | 1376116 | 8846.4 | 668 | 673 | 155.5 |
| C | 0 | 10 | 665823 | 4278.03 | 668 | 673 | 155.5 |
| C | 3 | 233 | 148308 | 949.54 | 668 | 673 | 155.5 |
| D | 8 | 195 | 479209 | 2766.21 | 720 | 700 | 173.0 |
| D | 12 | 233 | 209718 | 1208.31 | 720 | 700 | 173.0 |
| D | 12 | 218 | 90471 | 518.96 | 720 | 700 | 173.0 |
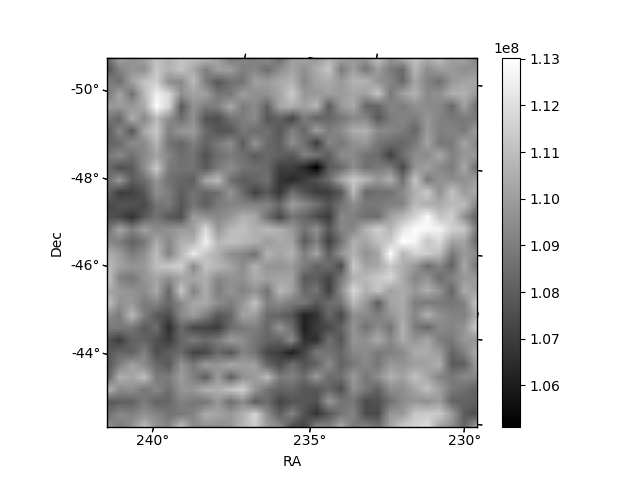
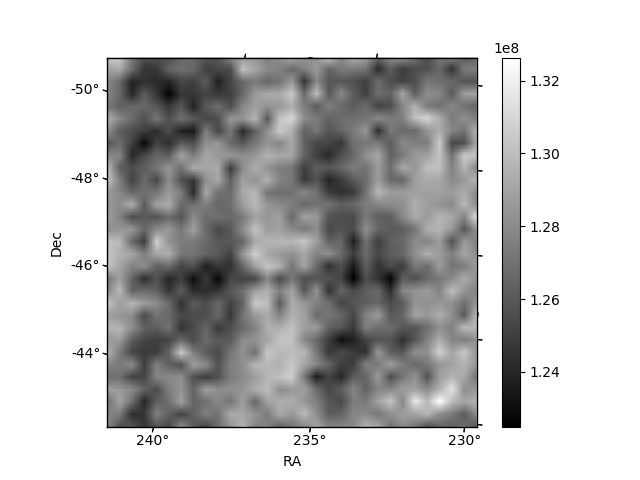
Histogram calculated using DETX and DETY for each event in the final _common_clean file
| Quadrant A |  |
 |
Quadrant B |
|---|---|---|---|
| Quadrant D |  |
 |
Quadrant C |
| Plot type | Count rate plots | Images |
|---|---|---|
| Comparison with Poisson distribution Blue bars denote a histogram of data divided into 1 sec bins. Red curve is a Poisson curve with rate = median count rate of data. |
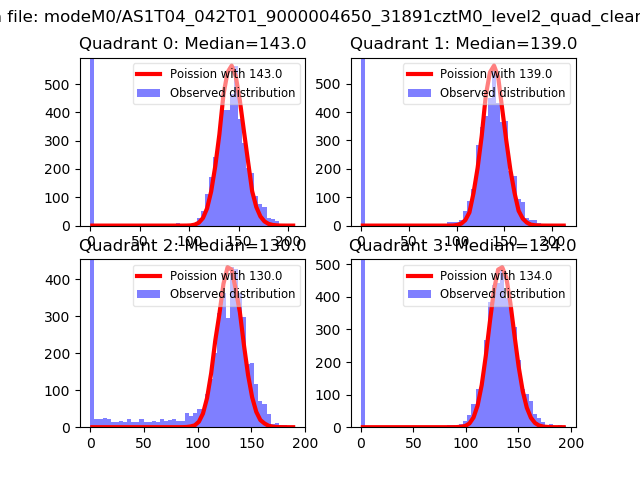 |
 |
| Quadrant-wise count rates Data is divided into 100 sec bins |
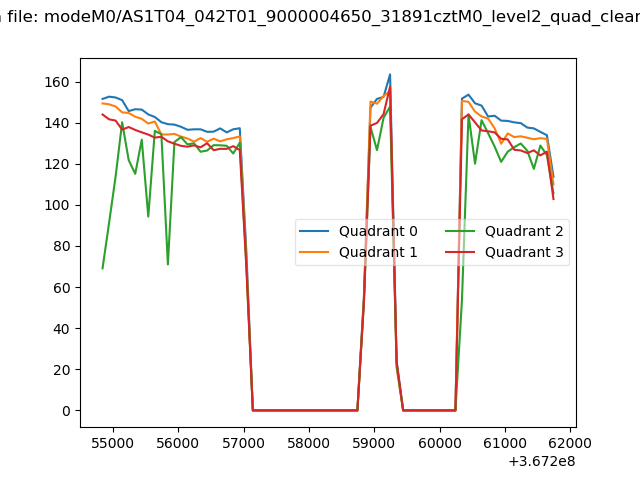 |
|
| Module-wise count rates for Quadrant A Data is divided into 100 sec bins |
 |
 |
| Module-wise count rates for Quadrant B Data is divided into 100 sec bins |
 |
 |
| Module-wise count rates for Quadrant C Data is divided into 100 sec bins |
 |
 |
| Module-wise count rates for Quadrant D Data is divided into 100 sec bins |
 |
 |
| Parameter | Plot |
|---|---|
| CZT HV Monitor |  |
| D_VDD | 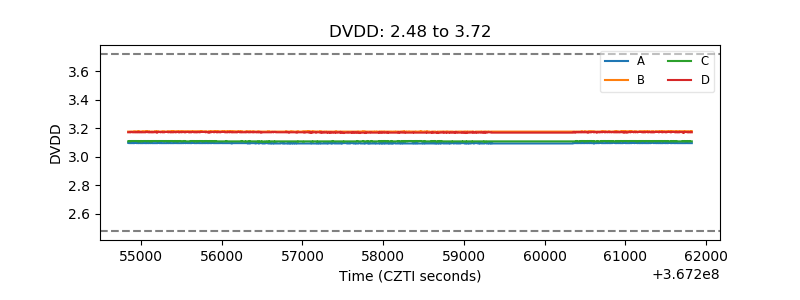 |
| Temperature 1 |  |
| Veto HV Monitor |  |
| Veto LLD |  |
| Alpha Counter |  |
| _CPM_Rate | 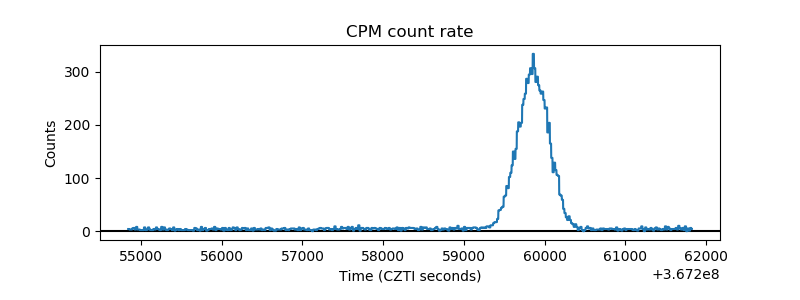 |
| CZT Counter |  |
| +2.5 Volts monitor |  |
| +5 Volts monitor |  |
| _ROLL_ROT |  |
| _Roll_DEC |  |
| _Roll_RA |  |
| Veto Counter |  |