| Param | Original file | Final file |
|---|---|---|
| Filename | modeM0/AS1T04_042T01_9000004650_31892cztM0_level2.evt | modeM0/AS1T04_042T01_9000004650_31892cztM0_level2_quad_clean.evt |
| Size (bytes) | 593,130,240 | 94,184,640 |
| Size | 565.7 MB | 89.8 MB |
| Events in quadrant A | 3,052,521 | 630,564 |
| Events in quadrant B | 5,483,275 | 609,167 |
| Events in quadrant C | 4,947,301 | 574,118 |
| Events in quadrant D | 4,045,801 | 590,633 |
| Mode M0 | |||
|---|---|---|---|
| Quadrant | BADHDUFLAG | Total packets | Discarded packets |
| A | 0 | 13250 | 1 |
| B | 0 | 20937 | 1 |
| C | 0 | 19032 | 1 |
| D | 0 | 16224 | 2 |
| Mode SS | |||
|---|---|---|---|
| Quadrant | BADHDUFLAG | Total packets | Discarded packets |
| A | 0 | 130 | 0 |
| B | 0 | 130 | 0 |
| C | 0 | 130 | 0 |
| D | 0 | 130 | 0 |
| Mode M9 | |||
|---|---|---|---|
| Quadrant | BADHDUFLAG | Total packets | Discarded packets |
| A | 0 | 6 | 0 |
| B | 0 | 6 | 0 |
| C | 0 | 6 | 0 |
| D | 0 | 6 | 0 |
| Quadrant | Total seconds | Saturated seconds | Saturation percentage |
|---|---|---|---|
| A | 6416 | 38 | 0.592269% |
| B | 6416 | 319 | 4.971945% |
| C | 6416 | 573 | 8.930798% |
| D | 6415 | 77 | 1.200312% |
Noise dominated data is calculated using 1-second bins in cleaned event files. If a bin has >2000 counts, and if more than 50% of those come from <1% of pixels, then it is considered to be noise-dominated and hence unusable.
| Quadrant | # 1 sec bins | Bins with >0 counts | Bins with >2000 counts | High rate bins dominated by noise | Noise dominated (total time) | Noise dominated (detector-on time) | Marked lightcurve |
|---|---|---|---|---|---|---|---|
| A | 6996 | 6417 | 0 | 0 | 0.00% | 0.00% | 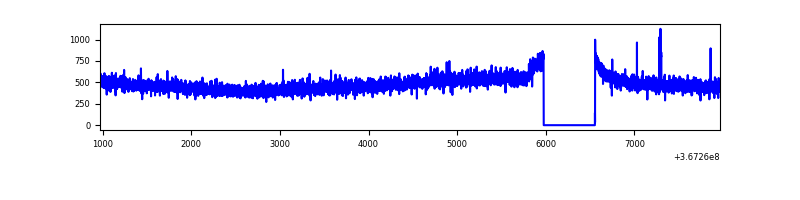 |
| B | 6996 | 6417 | 93 | 93 | 1.33% | 1.45% | 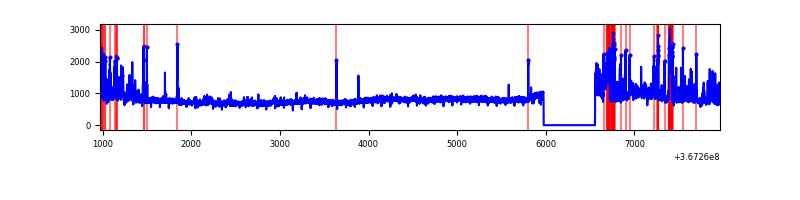 |
| C | 6996 | 6417 | 341 | 341 | 4.87% | 5.31% | 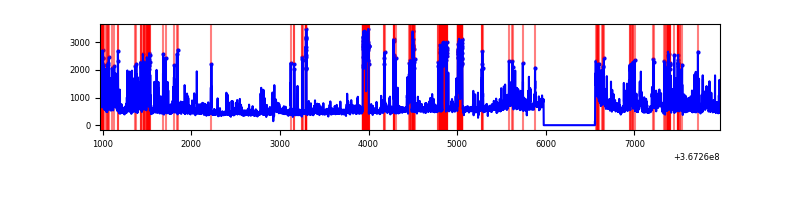 |
| D | 6995 | 6416 | 58 | 58 | 0.83% | 0.90% | 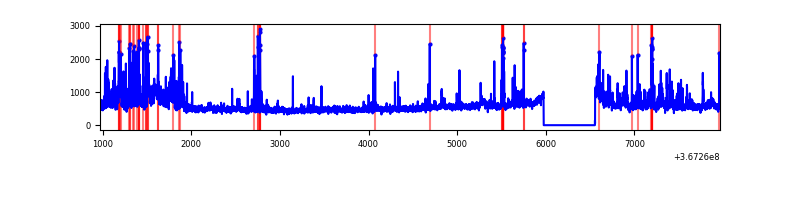 |
Top three noisy pixels from each quadrant. If the there are fewer than three noisy pixels in the level2.evt file, extra rows are filled as -1
| Pixel properties | Quadrant properties | ||||||
|---|---|---|---|---|---|---|---|
| Quadrant | DetID | PixID | Counts | Sigma | Mean | Median | Sigma |
| A | 13 | 254 | 9481 | 54.96 | 788 | 771 | 158.5 |
| A | 13 | 6 | 7973 | 45.44 | 788 | 771 | 158.5 |
| A | 3 | 137 | 7858 | 44.72 | 788 | 771 | 158.5 |
| B | 6 | 159 | 1847666 | 12583.32 | 767 | 747 | 146.8 |
| B | 5 | 172 | 304296 | 2068.12 | 767 | 747 | 146.8 |
| B | 5 | 255 | 99019 | 669.54 | 767 | 747 | 146.8 |
| C | 0 | 10 | 971013 | 5815.79 | 711 | 714 | 166.8 |
| C | 0 | 239 | 760573 | 4554.45 | 711 | 714 | 166.8 |
| C | 3 | 233 | 241718 | 1444.53 | 711 | 714 | 166.8 |
| D | 8 | 195 | 591744 | 3251.34 | 753 | 731 | 181.8 |
| D | 12 | 233 | 348041 | 1910.66 | 753 | 731 | 181.8 |
| D | 12 | 218 | 142965 | 782.47 | 753 | 731 | 181.8 |
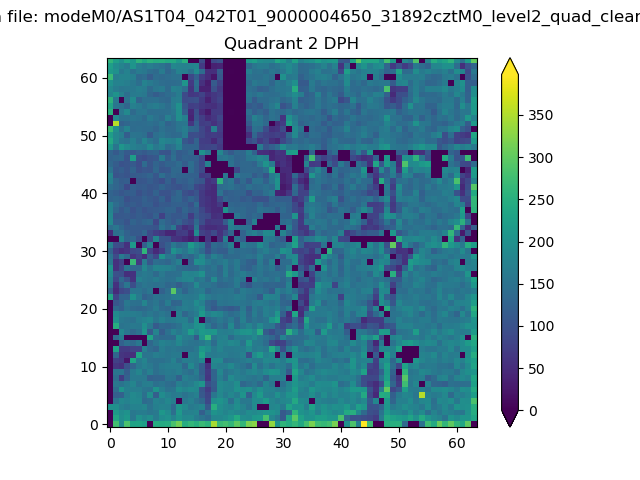
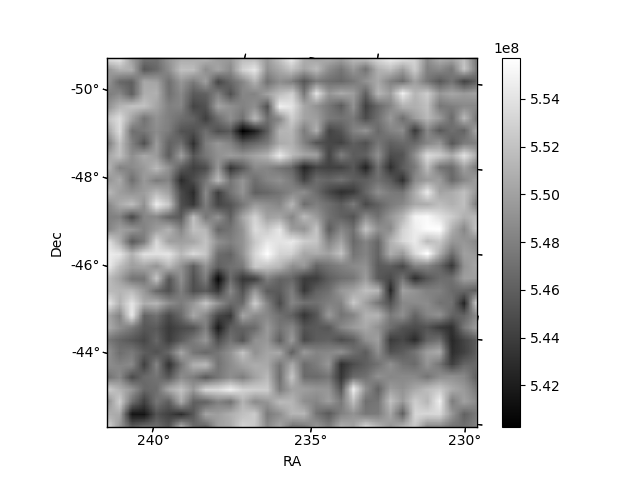
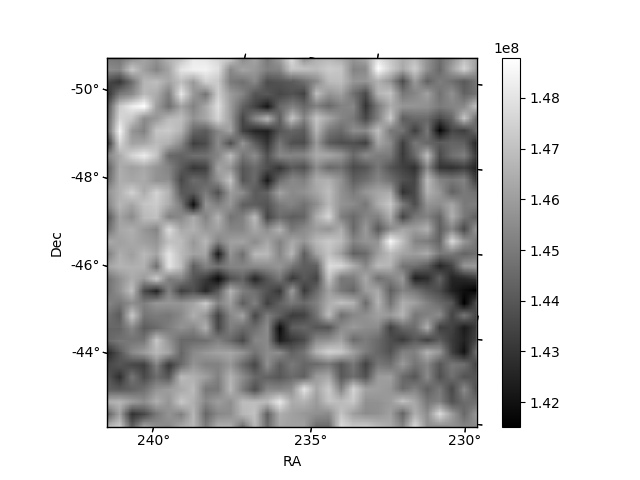
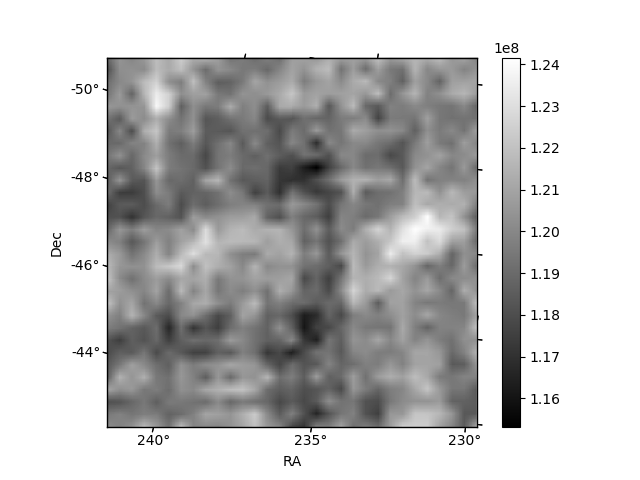
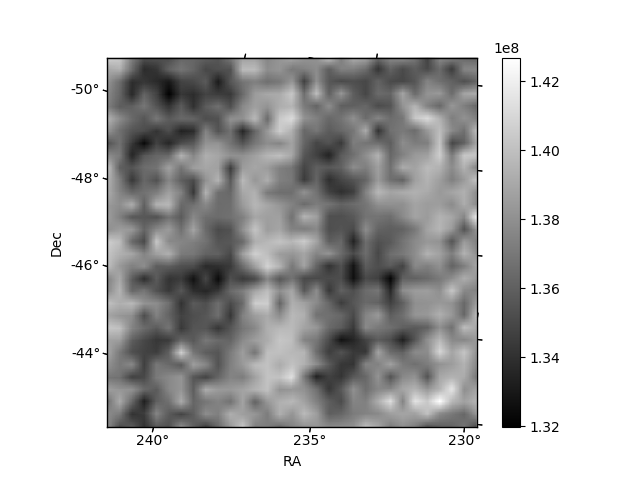
Histogram calculated using DETX and DETY for each event in the final _common_clean file
| Quadrant A | 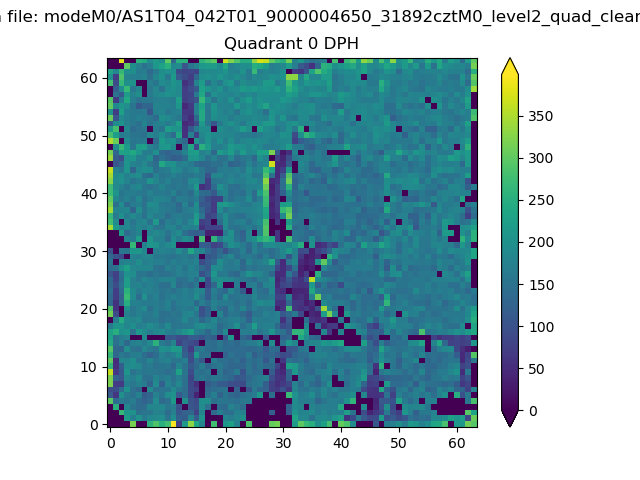 |
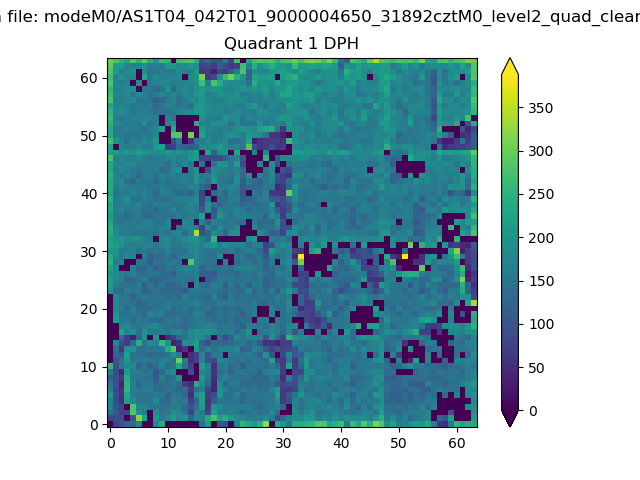 |
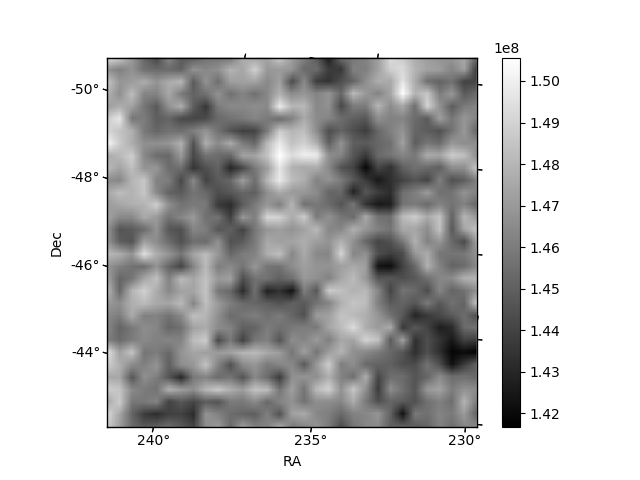
Quadrant B |
|---|---|---|---|
| Quadrant D | 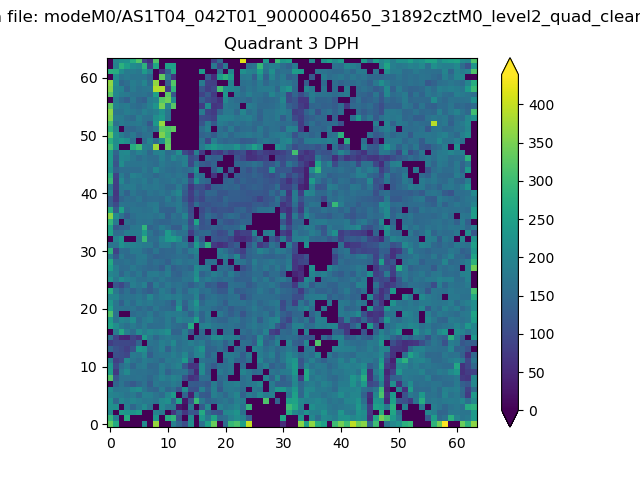 |
 |
Quadrant C |
| Plot type | Count rate plots | Images |
|---|---|---|
| Comparison with Poisson distribution Blue bars denote a histogram of data divided into 1 sec bins. Red curve is a Poisson curve with rate = median count rate of data. |
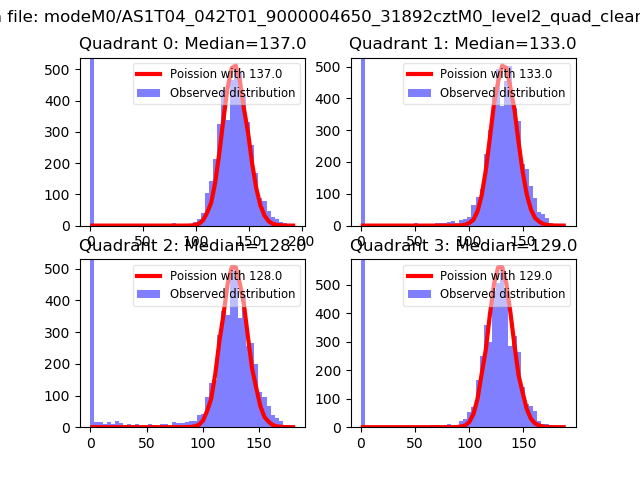 |
 |
| Quadrant-wise count rates Data is divided into 100 sec bins |
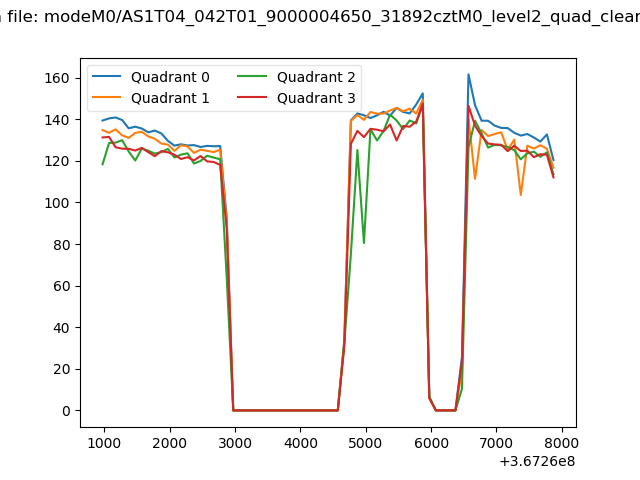 |
|
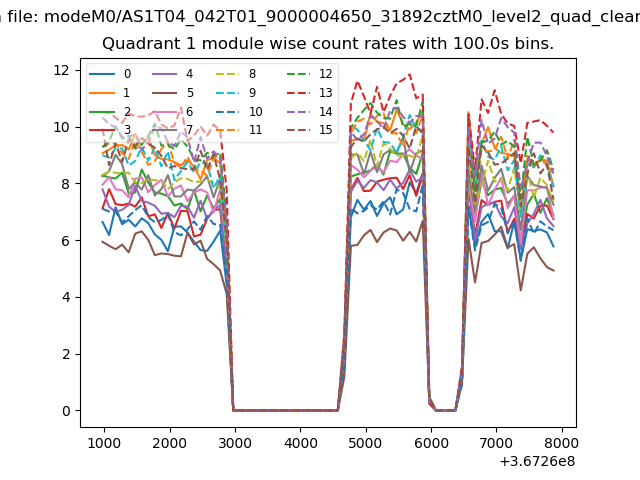
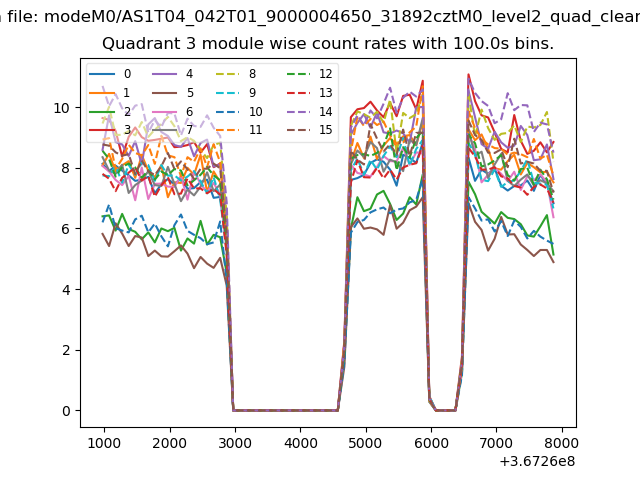
| Module-wise count rates for Quadrant A Data is divided into 100 sec bins |
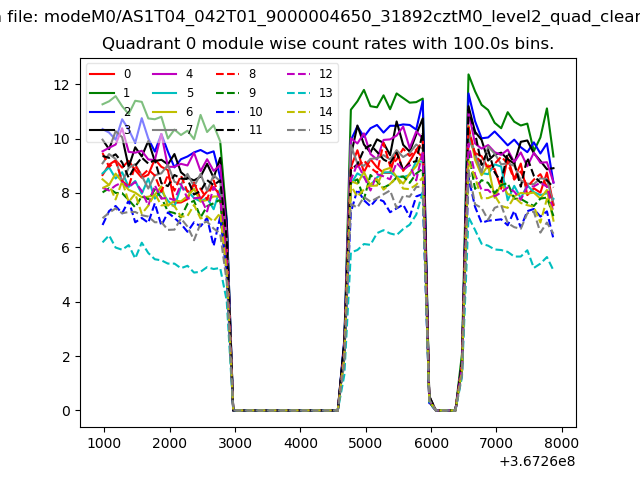 |
 |
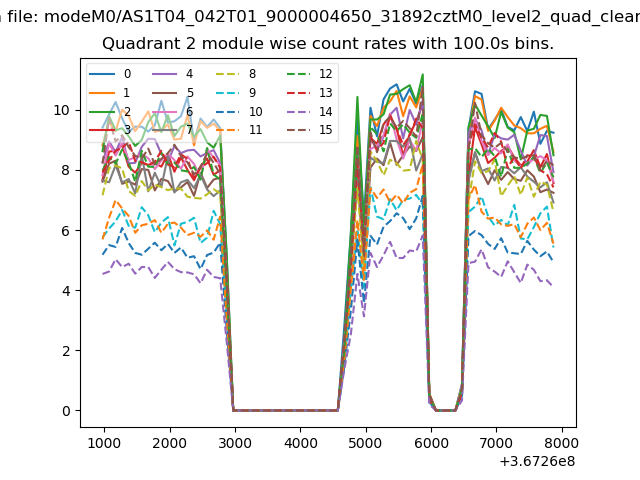
| Module-wise count rates for Quadrant B Data is divided into 100 sec bins |
 |
 |
| Module-wise count rates for Quadrant C Data is divided into 100 sec bins |
 |
 |
| Module-wise count rates for Quadrant D Data is divided into 100 sec bins |
 |
 |
| Parameter | Plot |
|---|---|
| CZT HV Monitor | 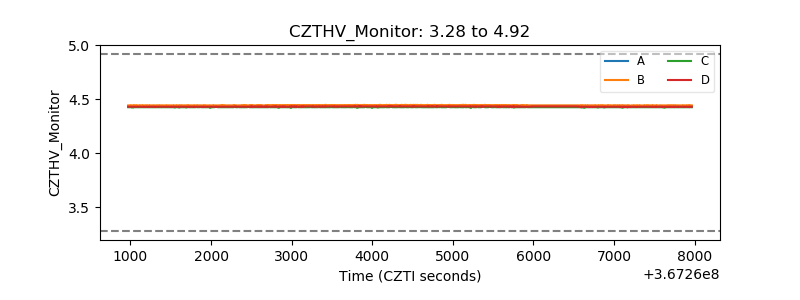 |
| D_VDD | 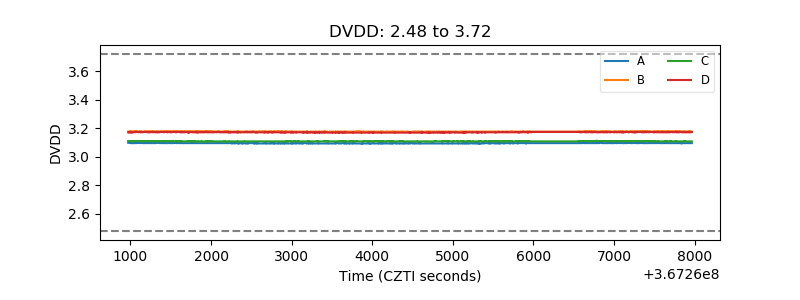 |
| Temperature 1 | 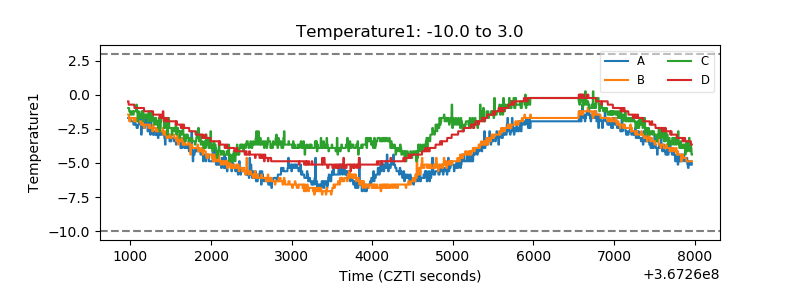 |
| Veto HV Monitor | 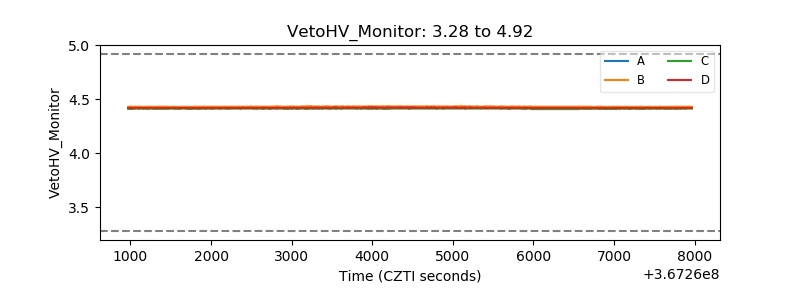 |
| Veto LLD | 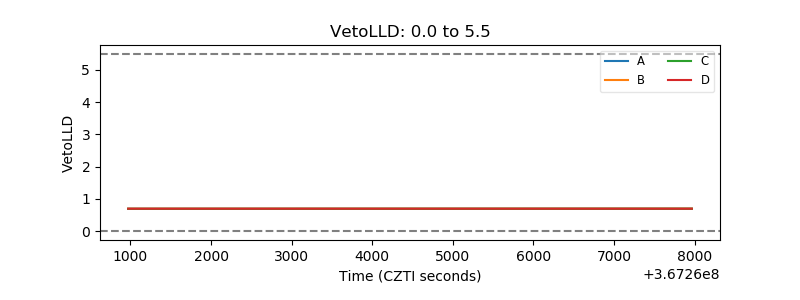 |
| Alpha Counter | 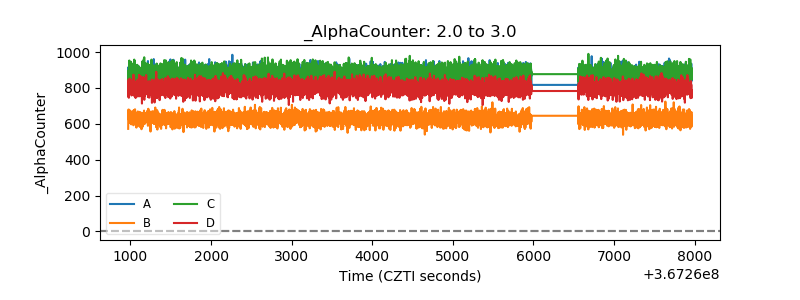 |
| _CPM_Rate | 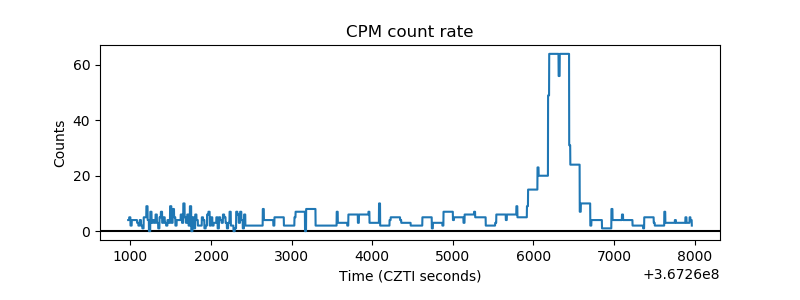 |
| CZT Counter | 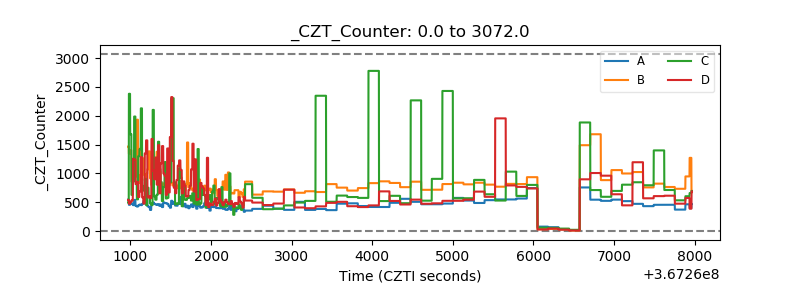 |
| +2.5 Volts monitor |  |
| +5 Volts monitor |  |
| _ROLL_ROT | 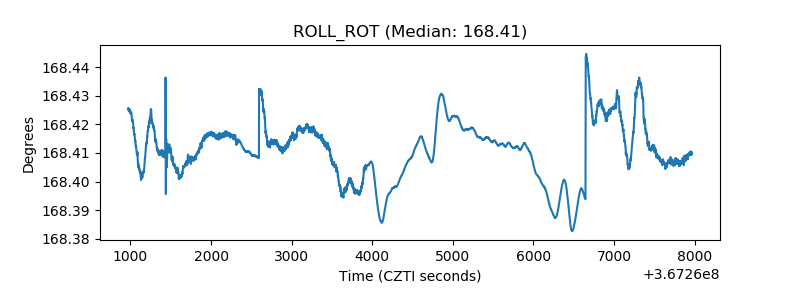 |
| _Roll_DEC |  |
| _Roll_RA | 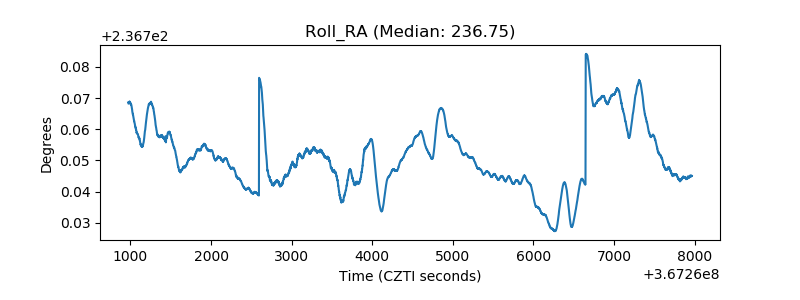 |
| Veto Counter | 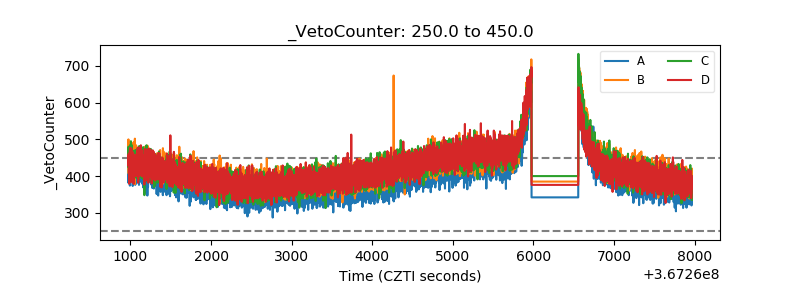 |