| Param | Original file | Final file |
|---|---|---|
| Filename | modeM0/AS1T04_042T01_9000004650_31893cztM0_level2.evt | modeM0/AS1T04_042T01_9000004650_31893cztM0_level2_quad_clean.evt |
| Size (bytes) | 659,983,680 | 105,730,560 |
| Size | 629.4 MB | 100.8 MB |
| Events in quadrant A | 3,331,196 | 712,132 |
| Events in quadrant B | 6,215,510 | 662,816 |
| Events in quadrant C | 5,464,087 | 669,278 |
| Events in quadrant D | 4,495,969 | 662,225 |
| Mode M0 | |||
|---|---|---|---|
| Quadrant | BADHDUFLAG | Total packets | Discarded packets |
| A | 0 | 14558 | 1 |
| B | 0 | 23731 | 1 |
| C | 0 | 21148 | 1 |
| D | 0 | 18096 | 1 |
| Mode SS | |||
|---|---|---|---|
| Quadrant | BADHDUFLAG | Total packets | Discarded packets |
| A | 0 | 144 | 0 |
| B | 0 | 144 | 0 |
| C | 0 | 144 | 0 |
| D | 0 | 144 | 0 |
| Mode M9 | |||
|---|---|---|---|
| Quadrant | BADHDUFLAG | Total packets | Discarded packets |
| A | 0 | 4 | 0 |
| B | 0 | 4 | 0 |
| C | 0 | 4 | 0 |
| D | 0 | 4 | 0 |
| Quadrant | Total seconds | Saturated seconds | Saturation percentage |
|---|---|---|---|
| A | 7118 | 24 | 0.337173% |
| B | 7118 | 447 | 6.279854% |
| C | 7118 | 328 | 4.608036% |
| D | 7119 | 117 | 1.643489% |
Noise dominated data is calculated using 1-second bins in cleaned event files. If a bin has >2000 counts, and if more than 50% of those come from <1% of pixels, then it is considered to be noise-dominated and hence unusable.
| Quadrant | # 1 sec bins | Bins with >0 counts | Bins with >2000 counts | High rate bins dominated by noise | Noise dominated (total time) | Noise dominated (detector-on time) | Marked lightcurve |
|---|---|---|---|---|---|---|---|
| A | 7458 | 7119 | 0 | 0 | 0.00% | 0.00% | 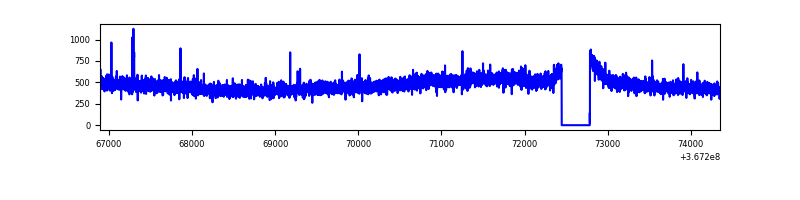 |
| B | 7458 | 7119 | 262 | 262 | 3.51% | 3.68% | 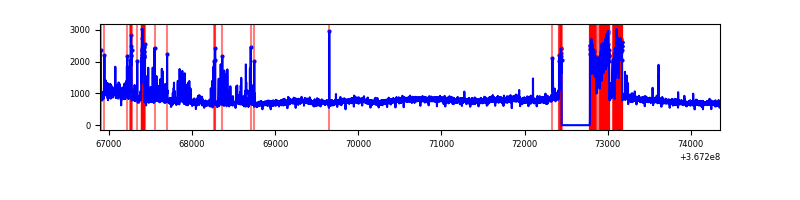 |
| C | 7458 | 7119 | 81 | 81 | 1.09% | 1.14% | 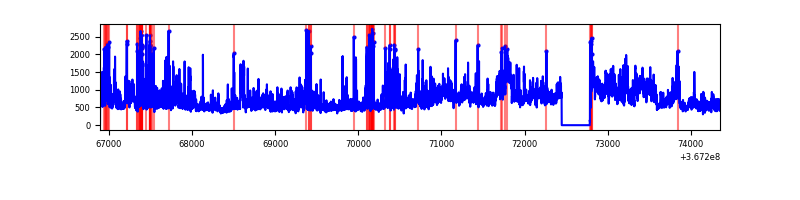 |
| D | 7459 | 7120 | 88 | 88 | 1.18% | 1.24% | 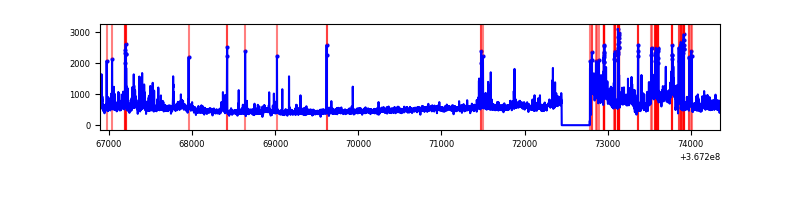 |
Top three noisy pixels from each quadrant. If the there are fewer than three noisy pixels in the level2.evt file, extra rows are filled as -1
| Pixel properties | Quadrant properties | ||||||
|---|---|---|---|---|---|---|---|
| Quadrant | DetID | PixID | Counts | Sigma | Mean | Median | Sigma |
| A | 13 | 254 | 10613 | 56.55 | 860 | 842 | 172.8 |
| A | 3 | 137 | 8972 | 47.05 | 860 | 842 | 172.8 |
| A | 13 | 6 | 7641 | 39.35 | 860 | 842 | 172.8 |
| B | 6 | 159 | 2002049 | 12833.64 | 815 | 797 | 155.9 |
| B | 5 | 172 | 683499 | 4378.04 | 815 | 797 | 155.9 |
| B | 5 | 255 | 191522 | 1223.08 | 815 | 797 | 155.9 |
| C | 3 | 233 | 1193488 | 6282.97 | 805 | 809 | 189.8 |
| C | 0 | 10 | 921672 | 4851.06 | 805 | 809 | 189.8 |
| C | 14 | 238 | 132846 | 695.56 | 805 | 809 | 189.8 |
| D | 8 | 195 | 875959 | 4414.41 | 818 | 795 | 198.3 |
| D | 7 | 38 | 148832 | 746.71 | 818 | 795 | 198.3 |
| D | 12 | 218 | 125669 | 629.87 | 818 | 795 | 198.3 |
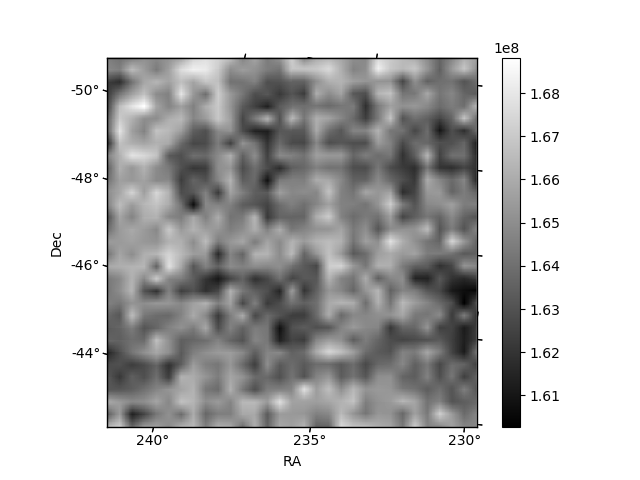
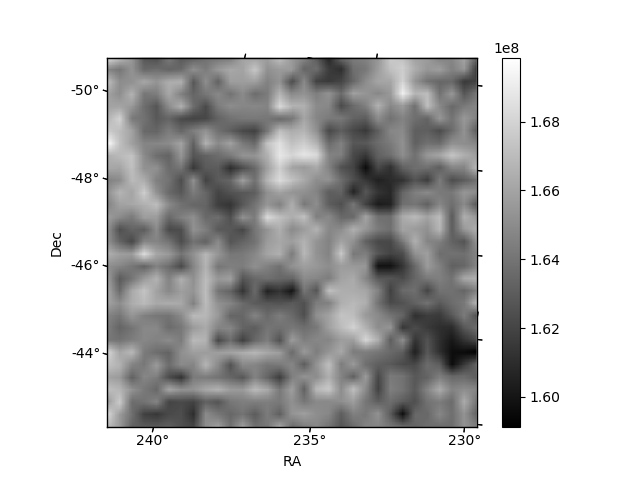
Histogram calculated using DETX and DETY for each event in the final _common_clean file
| Quadrant A | 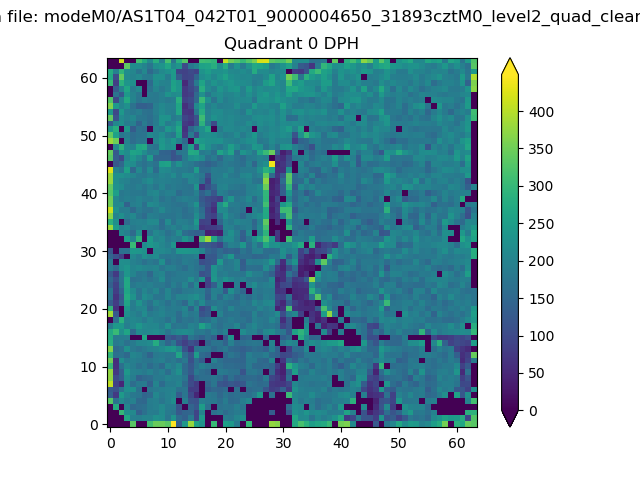 |
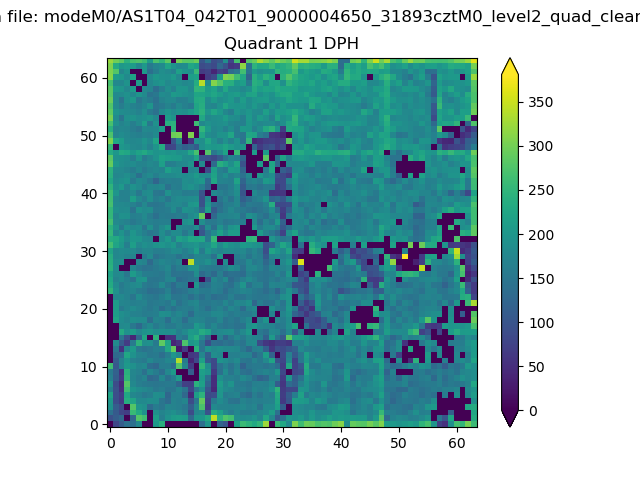 |
Quadrant B |
|---|---|---|---|
| Quadrant D | 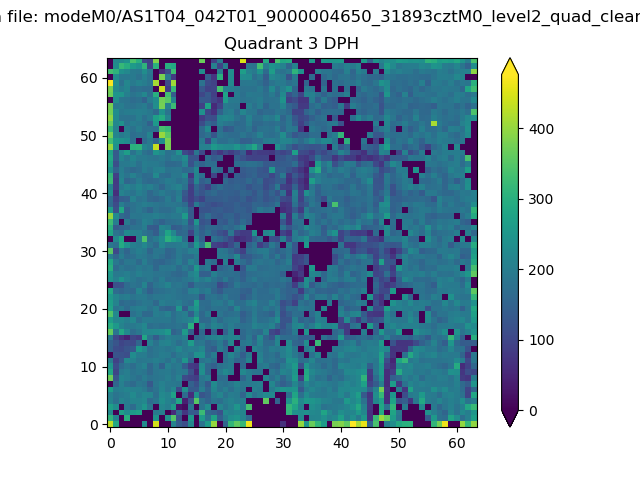 |
 |
Quadrant C |
| Plot type | Count rate plots | Images |
|---|---|---|
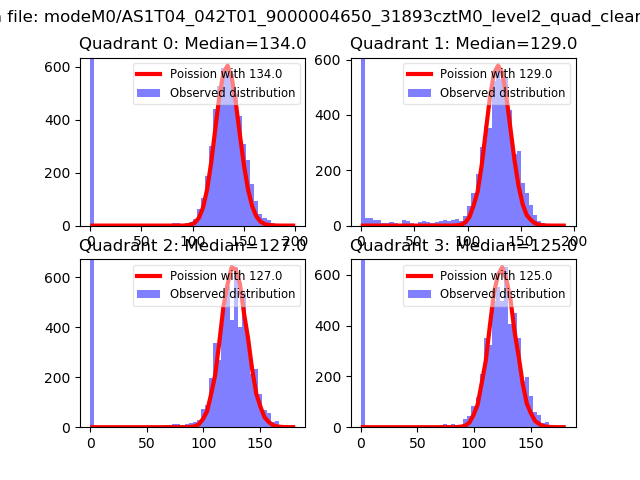
| Comparison with Poisson distribution Blue bars denote a histogram of data divided into 1 sec bins. Red curve is a Poisson curve with rate = median count rate of data. |
 |
 |
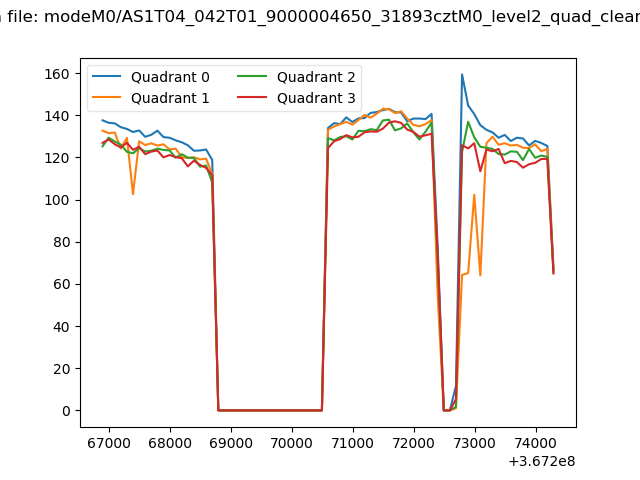
| Quadrant-wise count rates Data is divided into 100 sec bins |
 |
|
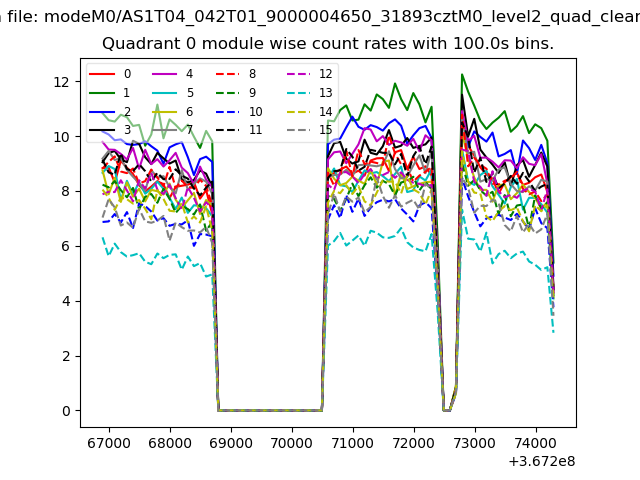
| Module-wise count rates for Quadrant A Data is divided into 100 sec bins |
 |
 |
| Module-wise count rates for Quadrant B Data is divided into 100 sec bins |
 |
 |
| Module-wise count rates for Quadrant C Data is divided into 100 sec bins |
 |
 |
| Module-wise count rates for Quadrant D Data is divided into 100 sec bins |
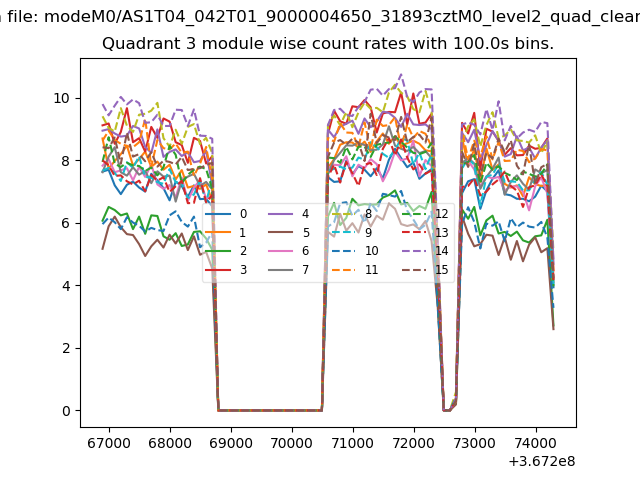 |
 |
| Parameter | Plot |
|---|---|
| CZT HV Monitor | 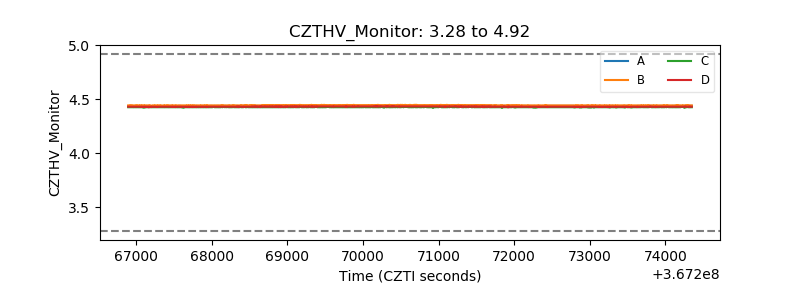 |
| D_VDD | 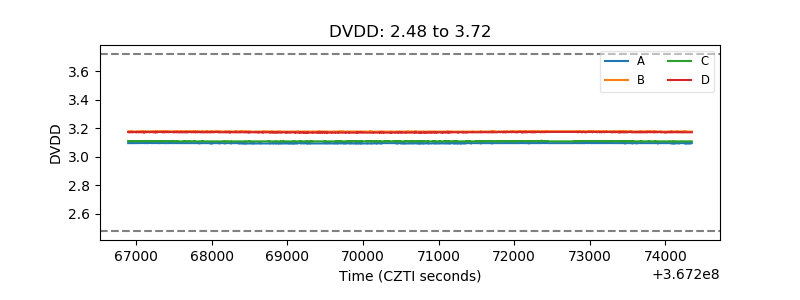 |
| Temperature 1 | 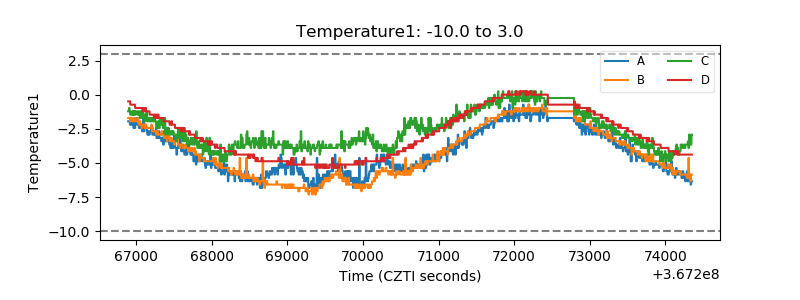 |
| Veto HV Monitor | 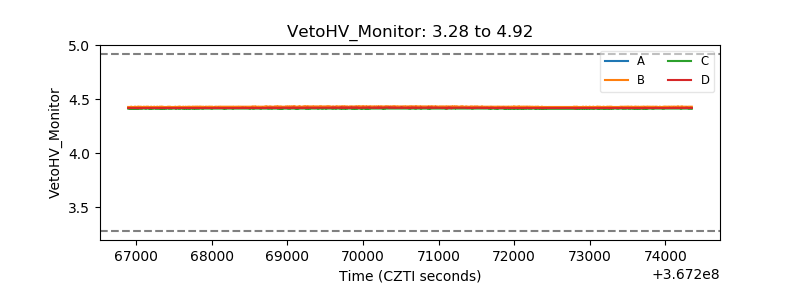 |
| Veto LLD | 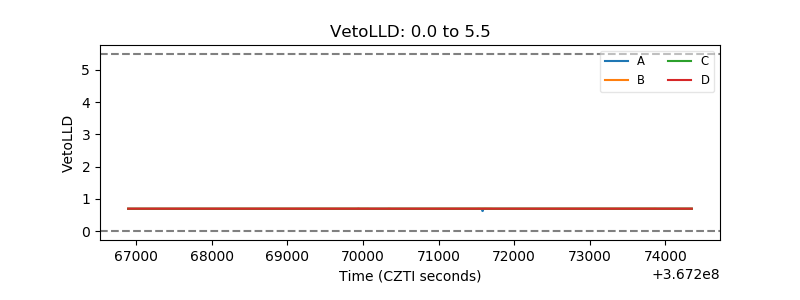 |
| Alpha Counter |  |
| _CPM_Rate | 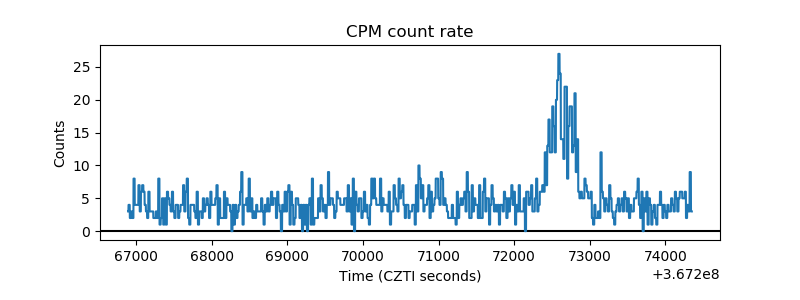 |
| CZT Counter | 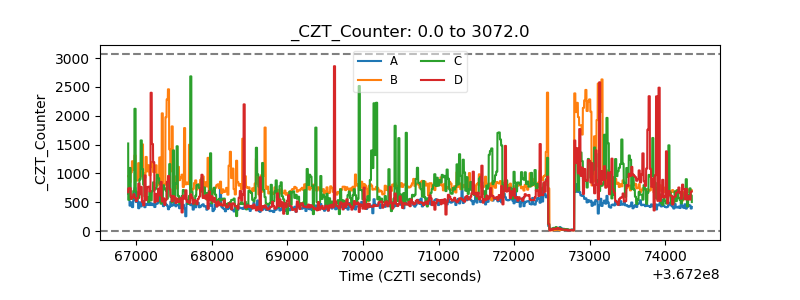 |
| +2.5 Volts monitor |  |
| +5 Volts monitor |  |
| _ROLL_ROT | 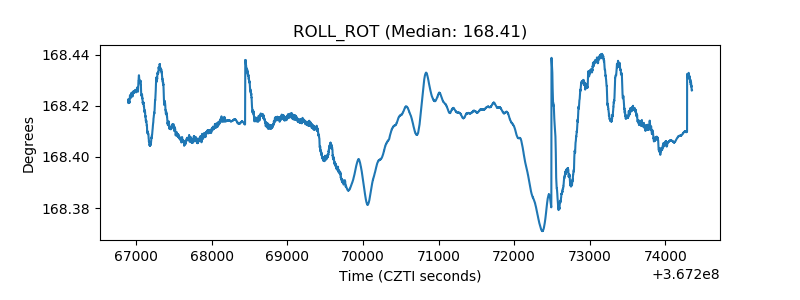 |
| _Roll_DEC | 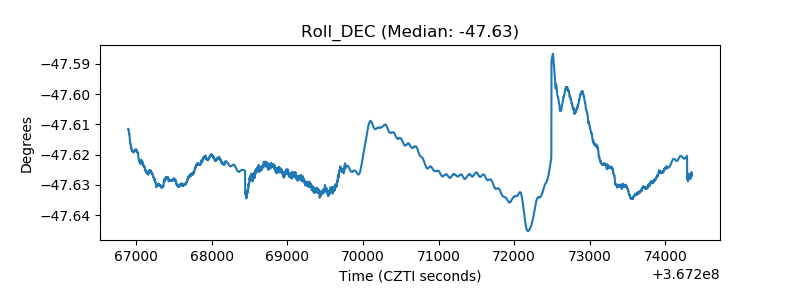 |
| _Roll_RA |  |
| Veto Counter | 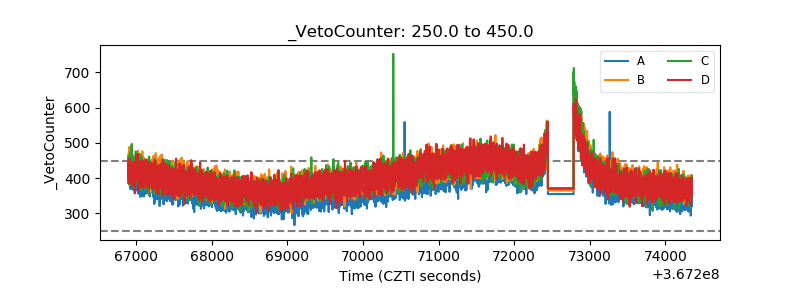 |