| Param | Original file | Final file |
|---|---|---|
| Filename | modeM0/AS1T04_042T01_9000004650_31898cztM0_level2.evt | modeM0/AS1T04_042T01_9000004650_31898cztM0_level2_quad_clean.evt |
| Size (bytes) | 127,782,720 | 28,880,640 |
| Size | 121.9 MB | 27.5 MB |
| Events in quadrant A | 704,255 | 196,928 |
| Events in quadrant B | 1,209,748 | 191,774 |
| Events in quadrant C | 841,087 | 189,112 |
| Events in quadrant D | 1,011,530 | 186,341 |
| Mode M0 | |||
|---|---|---|---|
| Quadrant | BADHDUFLAG | Total packets | Discarded packets |
| A | 0 | 2979 | 0 |
| B | 0 | 4694 | 0 |
| C | 0 | 3392 | 0 |
| D | 0 | 3943 | 0 |
| Mode SS | |||
|---|---|---|---|
| Quadrant | BADHDUFLAG | Total packets | Discarded packets |
| A | 0 | 30 | 0 |
| B | 0 | 30 | 0 |
| C | 0 | 30 | 0 |
| D | 0 | 30 | 0 |
| Quadrant | Total seconds | Saturated seconds | Saturation percentage |
|---|---|---|---|
| A | 1481 | 1 | 0.067522% |
| B | 1482 | 22 | 1.484480% |
| C | 1482 | 17 | 1.147099% |
| D | 1482 | 27 | 1.821862% |
Noise dominated data is calculated using 1-second bins in cleaned event files. If a bin has >2000 counts, and if more than 50% of those come from <1% of pixels, then it is considered to be noise-dominated and hence unusable.
| Quadrant | # 1 sec bins | Bins with >0 counts | Bins with >2000 counts | High rate bins dominated by noise | Noise dominated (total time) | Noise dominated (detector-on time) | Marked lightcurve |
|---|---|---|---|---|---|---|---|
| A | 1481 | 1481 | 0 | 0 | 0.00% | 0.00% | 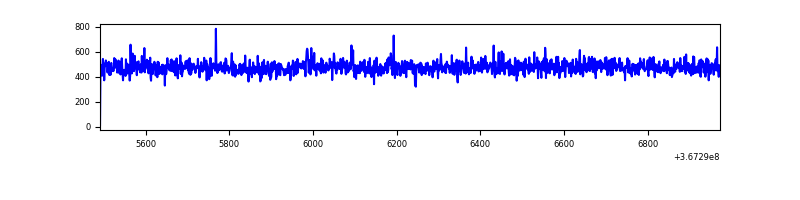 |
| B | 1482 | 1482 | 10 | 10 | 0.67% | 0.67% | 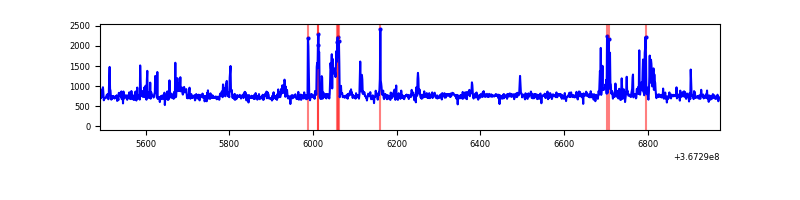 |
| C | 1482 | 1482 | 0 | 0 | 0.00% | 0.00% | 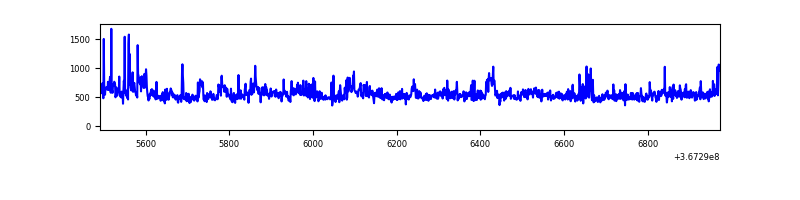 |
| D | 1482 | 1482 | 31 | 31 | 2.09% | 2.09% | 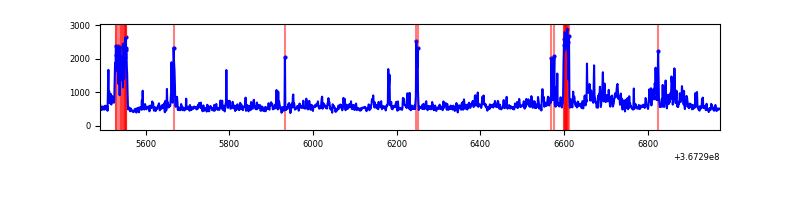 |
Top three noisy pixels from each quadrant. If the there are fewer than three noisy pixels in the level2.evt file, extra rows are filled as -1
| Pixel properties | Quadrant properties | ||||||
|---|---|---|---|---|---|---|---|
| Quadrant | DetID | PixID | Counts | Sigma | Mean | Median | Sigma |
| A | 15 | 174 | 2244 | 52.96 | 182 | 177 | 39.0 |
| A | 13 | 254 | 2122 | 49.84 | 182 | 177 | 39.0 |
| A | 3 | 137 | 1884 | 43.74 | 182 | 177 | 39.0 |
| B | 6 | 159 | 388161 | 10626.1 | 177 | 172 | 36.5 |
| B | 10 | 245 | 102742 | 2809.15 | 177 | 172 | 36.5 |
| B | 0 | 213 | 11284 | 304.33 | 177 | 172 | 36.5 |
| C | 3 | 233 | 86622 | 2114.41 | 168 | 169 | 40.9 |
| C | 0 | 10 | 55683 | 1357.73 | 168 | 169 | 40.9 |
| C | 14 | 238 | 30951 | 752.85 | 168 | 169 | 40.9 |
| D | 8 | 195 | 180784 | 4191.15 | 172 | 166 | 43.1 |
| D | 12 | 233 | 100511 | 2328.45 | 172 | 166 | 43.1 |
| D | 13 | 174 | 44086 | 1019.14 | 172 | 166 | 43.1 |
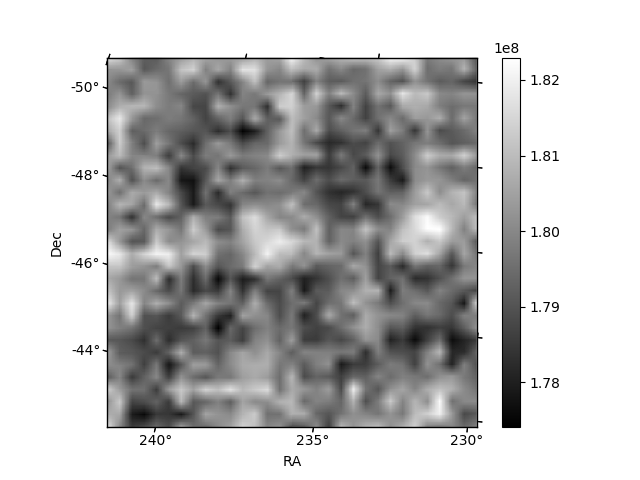
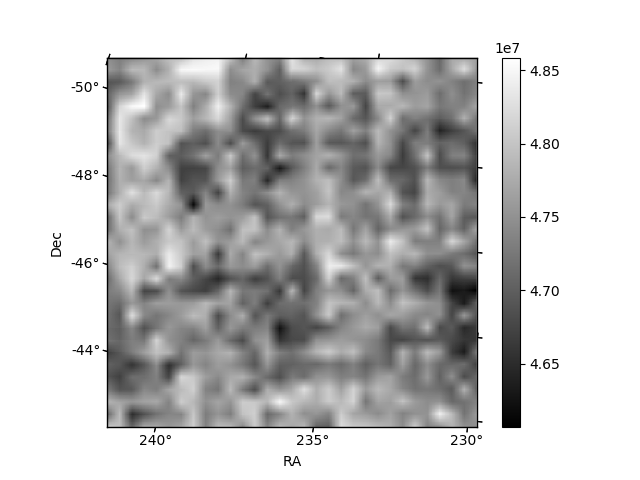
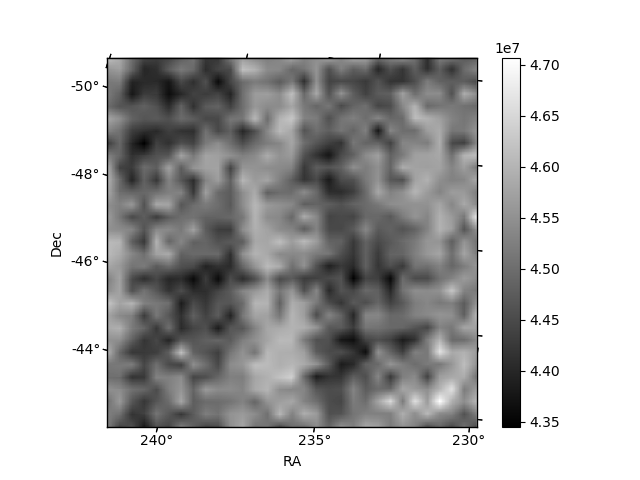
Histogram calculated using DETX and DETY for each event in the final _common_clean file
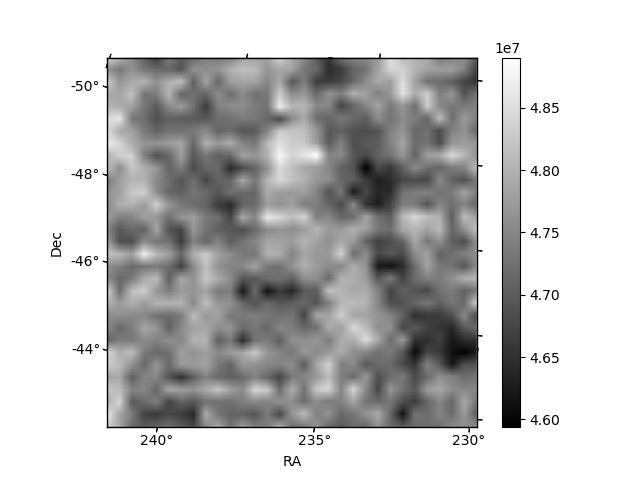
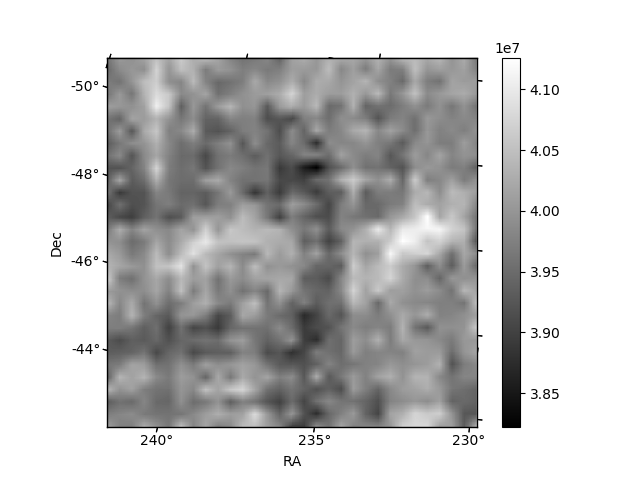
| Quadrant A | 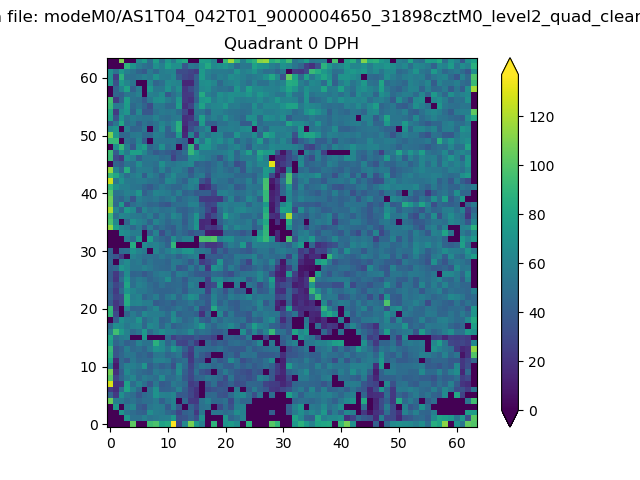 |
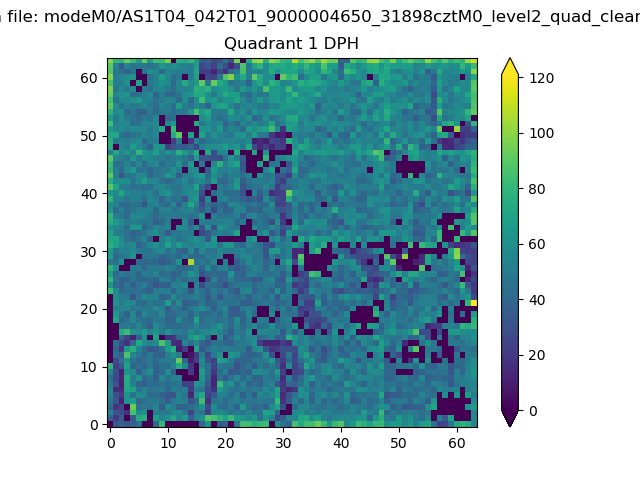 |
Quadrant B |
|---|---|---|---|
| Quadrant D | 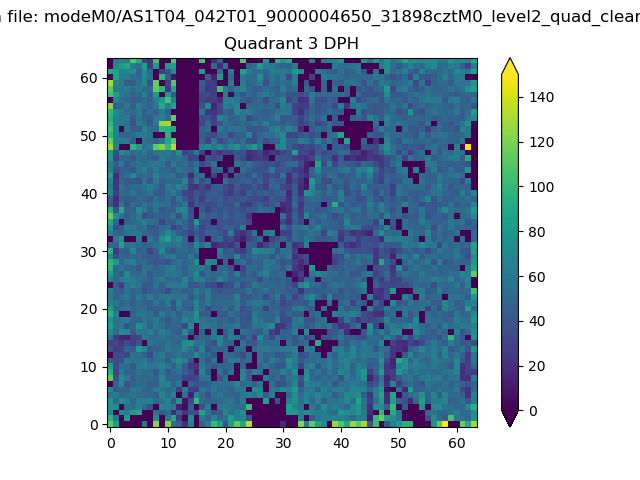 |
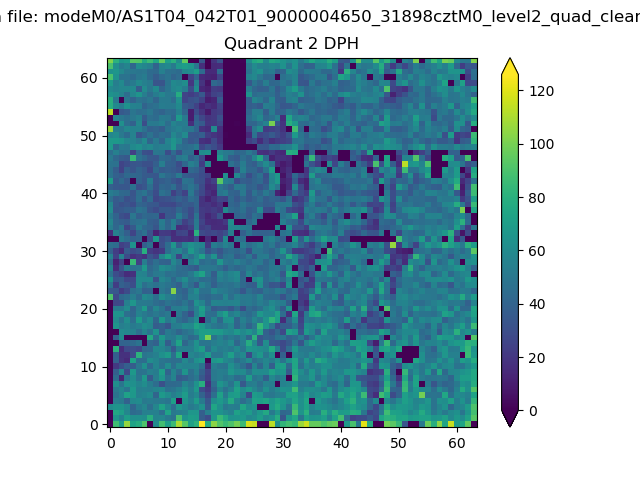 |
Quadrant C |
| Plot type | Count rate plots | Images |
|---|---|---|
| Comparison with Poisson distribution Blue bars denote a histogram of data divided into 1 sec bins. Red curve is a Poisson curve with rate = median count rate of data. |
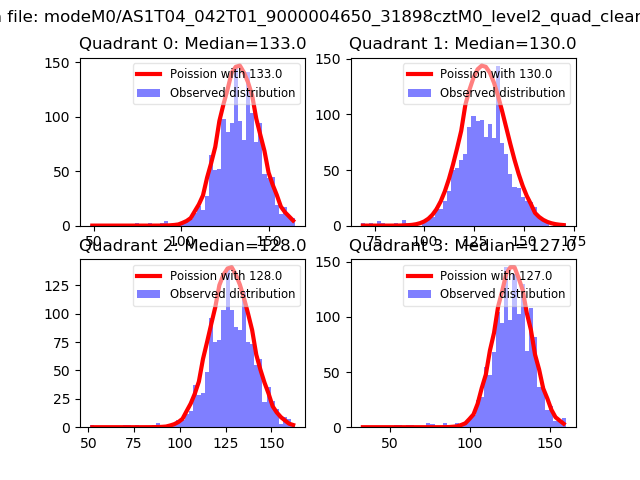 |
 |
| Quadrant-wise count rates Data is divided into 100 sec bins |
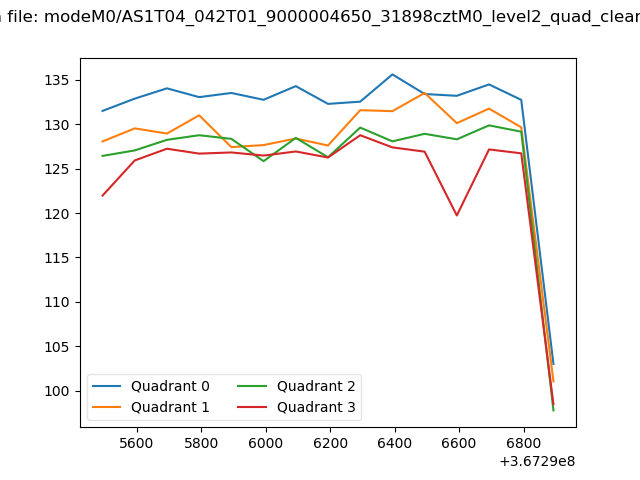 |
|
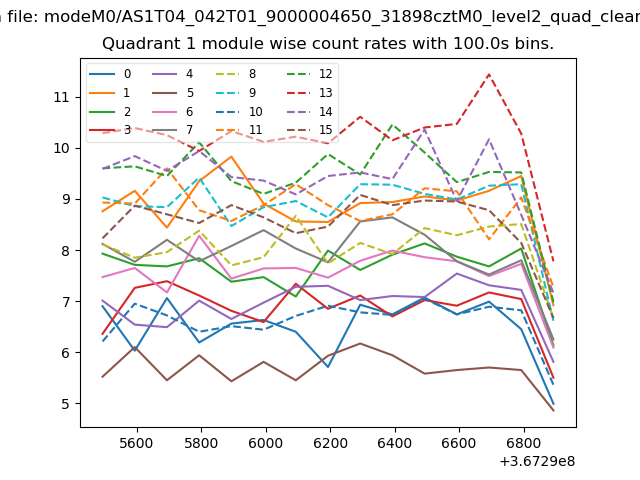
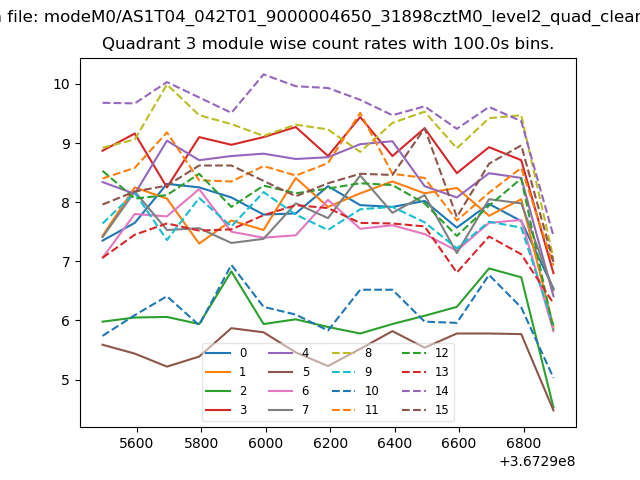
| Module-wise count rates for Quadrant A Data is divided into 100 sec bins |
 |
 |
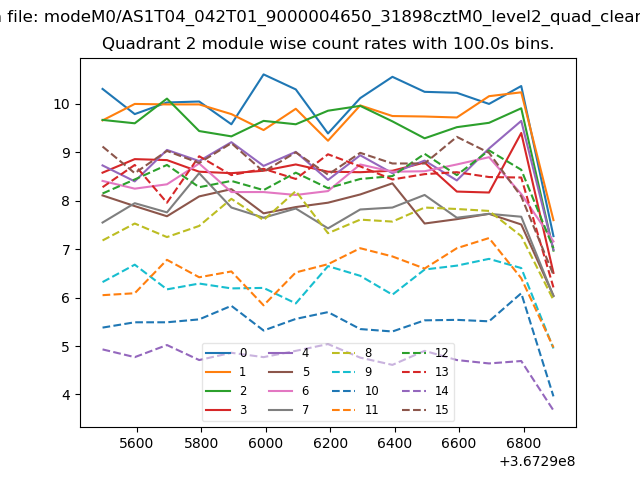
| Module-wise count rates for Quadrant B Data is divided into 100 sec bins |
 |
 |
| Module-wise count rates for Quadrant C Data is divided into 100 sec bins |
 |
 |
| Module-wise count rates for Quadrant D Data is divided into 100 sec bins |
 |
 |
| Parameter | Plot |
|---|---|
| CZT HV Monitor | 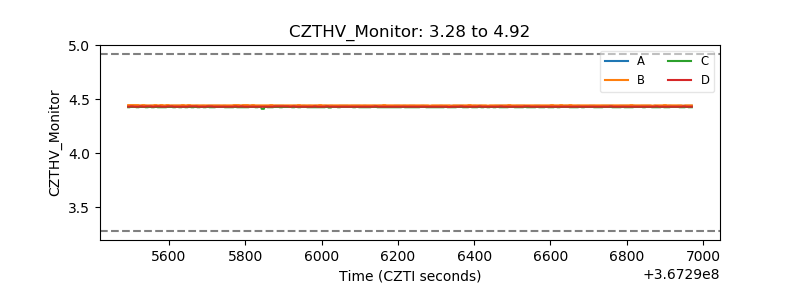 |
| D_VDD | 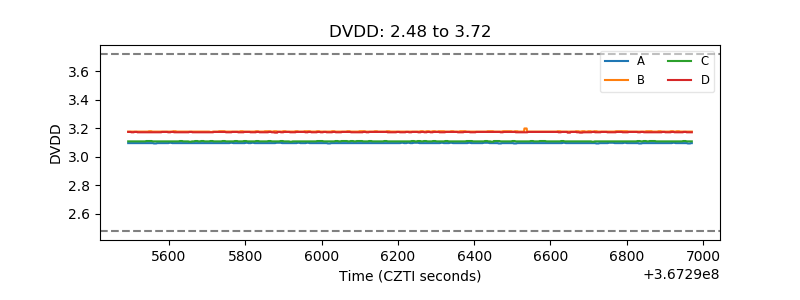 |
| Temperature 1 | 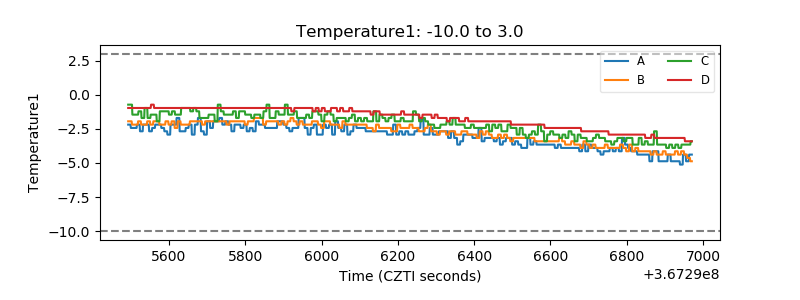 |
| Veto HV Monitor |  |
| Veto LLD | 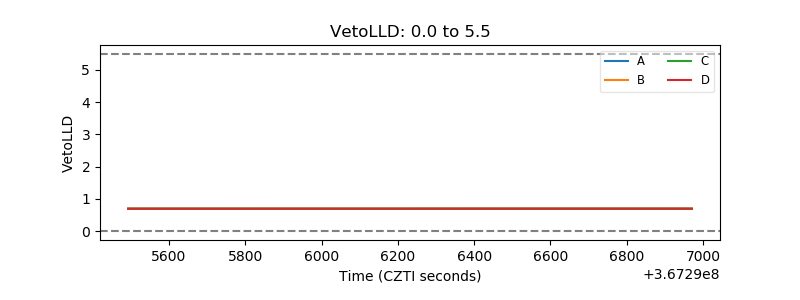 |
| Alpha Counter | 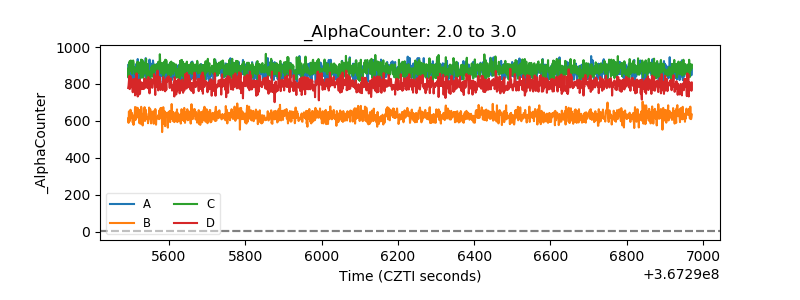 |
| _CPM_Rate | 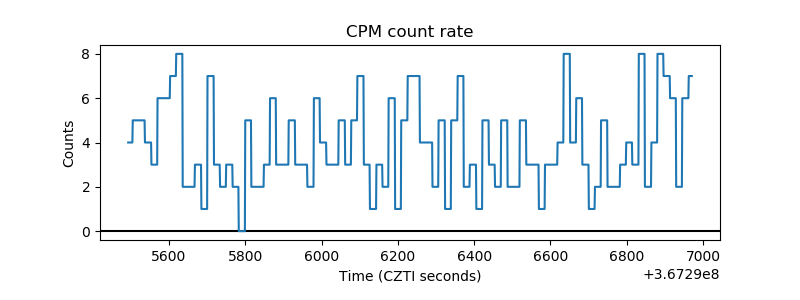 |
| CZT Counter | 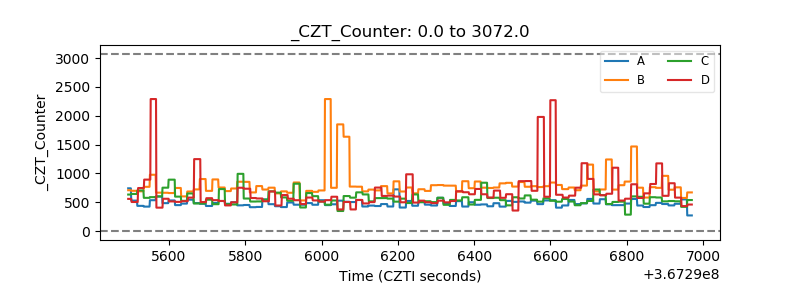 |
| +2.5 Volts monitor |  |
| +5 Volts monitor |  |
| _ROLL_ROT | 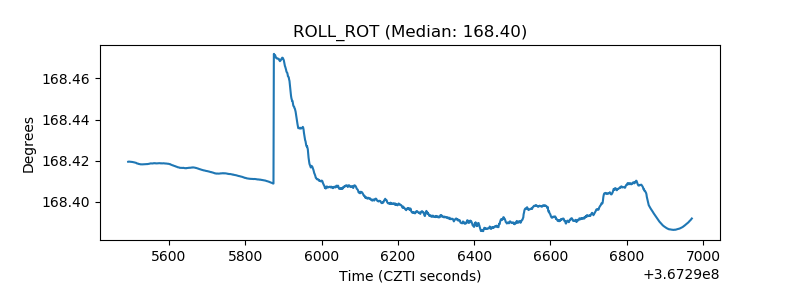 |
| _Roll_DEC | 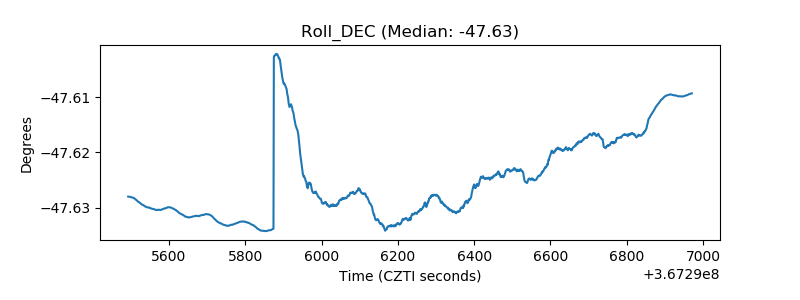 |
| _Roll_RA | 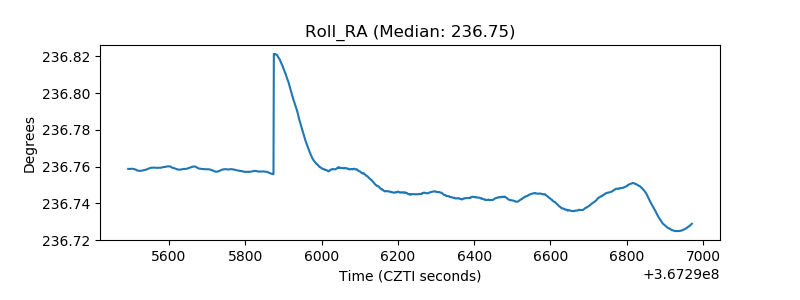 |
| Veto Counter | 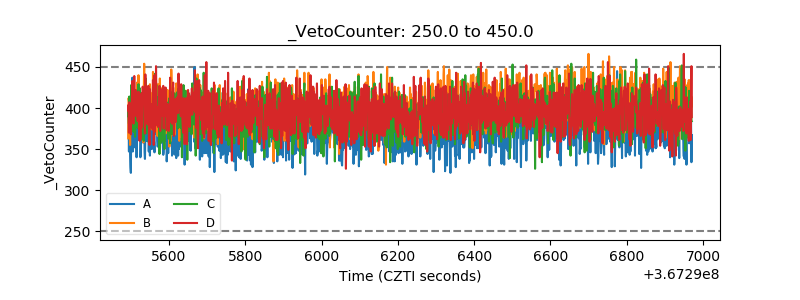 |