| Param | Original file | Final file |
|---|---|---|
| Filename | modeM0/AS1T04_043T01_9000004648cztM0_level2.fits | modeM0/AS1T04_043T01_9000004648cztM0_level2_quad_clean.evt |
| Size (bytes) | 175,089,600 | 141,022,080 |
| Size | 167.0 MB | 134.5 MB |
| Events in quadrant A | 1,091,434 | 797,083 |
| Events in quadrant B | 1,017,024 | 791,256 |
| Events in quadrant C | 1,046,206 | 763,126 |
| Events in quadrant D | 921,726 | 692,200 |
| Mode M0 | |||
|---|---|---|---|
| Quadrant | BADHDUFLAG | Total packets | Discarded packets |
| A | 0 | 36750 | 0 |
| B | 0 | 54582 | 0 |
| C | 0 | 38614 | 0 |
| D | 0 | 45855 | 0 |
| Mode M9 | |||
|---|---|---|---|
| Quadrant | BADHDUFLAG | Total packets | Discarded packets |
| A | 0 | 25 | 0 |
| B | 0 | 25 | 0 |
| C | 0 | 25 | 0 |
| D | 0 | 25 | 0 |
| Mode SS | |||
|---|---|---|---|
| Quadrant | BADHDUFLAG | Total packets | Discarded packets |
| A | 0 | 364 | 0 |
| B | 0 | 362 | 0 |
| C | 0 | 364 | 0 |
| D | 0 | 362 | 0 |
| Quadrant | Total seconds | Saturated seconds | Saturation percentage |
|---|---|---|---|
| A | 17789 | 134 | 0.753274% |
| B | 17730 | 331 | 1.866892% |
| C | 17813 | 333 | 1.869421% |
| D | 17804 | 295 | 1.656931% |
Noise dominated data is calculated using 1-second bins in cleaned event files. If a bin has >2000 counts, and if more than 50% of those come from <1% of pixels, then it is considered to be noise-dominated and hence unusable.
| Quadrant | # 1 sec bins | Bins with >0 counts | Bins with >2000 counts | High rate bins dominated by noise | Noise dominated (total time) | Noise dominated (detector-on time) | Marked lightcurve |
|---|---|---|---|---|---|---|---|
| A | 21336 | 17906 | 0 | 0 | 0.00% | 0.00% |  |
| B | 21336 | 17808 | 0 | 0 | 0.00% | 0.00% |  |
| C | 21335 | 17904 | 0 | 0 | 0.00% | 0.00% |  |
| D | 21336 | 17882 | 0 | 0 | 0.00% | 0.00% |  |
Top three noisy pixels from each quadrant. If the there are fewer than three noisy pixels in the level2.evt file, extra rows are filled as -1
| Pixel properties | Quadrant properties | ||||||
|---|---|---|---|---|---|---|---|
| Quadrant | DetID | PixID | Counts | Sigma | Mean | Median | Sigma |
| A | 0 | 29 | 892 | 8.75 | 284 | 267 | 71.4 |
| A | 7 | 110 | 839 | 8.01 | 284 | 267 | 71.4 |
| A | 9 | 19 | 813 | 7.64 | 284 | 267 | 71.4 |
| B | 2 | 9 | 837 | 10.54 | 269 | 256 | 55.1 |
| B | 3 | 17 | 696 | 7.98 | 269 | 256 | 55.1 |
| B | 5 | 128 | 685 | 7.78 | 269 | 256 | 55.1 |
| C | 1 | 81 | 817 | 7.87 | 276 | 259 | 70.9 |
| C | 1 | 80 | 807 | 7.73 | 276 | 259 | 70.9 |
| C | 3 | 187 | 746 | 6.87 | 276 | 259 | 70.9 |
| D | 15 | 47 | 714 | 6.68 | 263 | 239 | 71.2 |
| D | 10 | 189 | 677 | 6.16 | 263 | 239 | 71.2 |
| D | 7 | 3 | 659 | 5.9 | 263 | 239 | 71.2 |
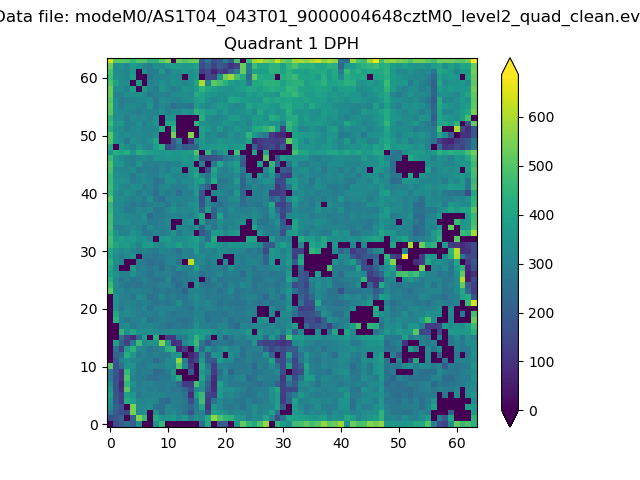
Histogram calculated using DETX and DETY for each event in the final _common_clean file
| Quadrant A |  |
 |
Quadrant B |
|---|---|---|---|
| Quadrant D |  |
 |
Quadrant C |
| Plot type | Count rate plots | Images |
|---|---|---|
| Comparison with Poisson distribution Blue bars denote a histogram of data divided into 1 sec bins. Red curve is a Poisson curve with rate = median count rate of data. |
 |
 |
| Quadrant-wise count rates Data is divided into 100 sec bins |
 |
|
| Module-wise count rates for Quadrant A Data is divided into 100 sec bins |
 |
 |
| Module-wise count rates for Quadrant B Data is divided into 100 sec bins |
 |
 |
| Module-wise count rates for Quadrant C Data is divided into 100 sec bins |
 |
 |
| Module-wise count rates for Quadrant D Data is divided into 100 sec bins |
 |
 |
| Parameter | Plot |
|---|---|
| CZT HV Monitor |  |
| D_VDD |  |
| Temperature 1 |  |
| Veto HV Monitor |  |
| Veto LLD | 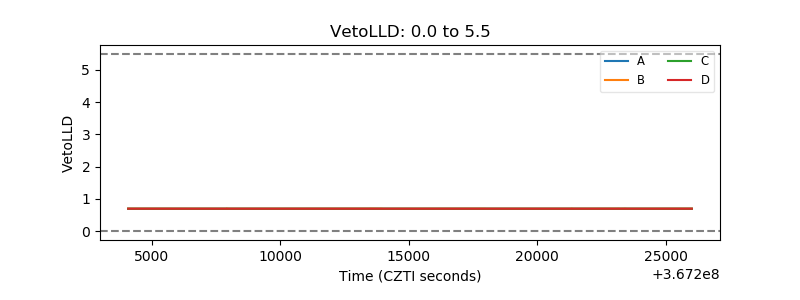 |
| Alpha Counter |  |
| _CPM_Rate |  |
| CZT Counter |  |
| +2.5 Volts monitor |  |
| +5 Volts monitor |  |
| _ROLL_ROT |  |
| _Roll_DEC | 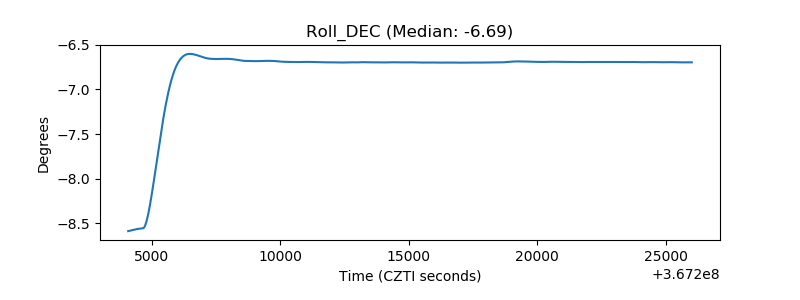 |
| _Roll_RA |  |
| Veto Counter |  |